Challenges of Rural Insurance in the Context of Climate Change: the Case of Soybeans
Promoting the modernization and sustainability of Brazilian agriculture is essential to provide greater food security, reduce the pressure for deforestation, and lower greenhouse gas emissions. The recovery of degraded areas, the conversion of pastures into cropland, and the adoption of new technologies and good practices require significant investments in intensification and productivity. These changes often lead to higher expected returns but can also cause uncertainties. Better risk management instruments, such as rural insurance, are needed to encourage such investments and to enable more efficient production decisions, since the agricultural sector is exposed to natural and market risks that often generate losses.
The current context of climate change amplifies risks in agricultural production. In recent years, adverse weather events, such as prolonged drought, hail, and frost, have become more frequent, causing significant crop failures and, consequently, a substantial increase in rural insurance claim payments. In the 2021/2022 agricultural year, the severe drought led claim payments to grow more than four times compared to the previous crop season, according to data from the Superintendence for Private Insurance (Superintendência de Seguros Privados – SUSEP). The record losses of 2022 led insurers and reinsurers to incur claim payment expenses larger than the premiums collected. Faced with higher risk, the price of rural insurance premiums tends to increase and the supply to decrease, further restricting access to insurance and leaving many producers uninsured, especially those who struggle to bear the higher costs of policy premiums.
Therefore, public policy for agricultural risk management must be improved both to ensure the necessary investments in transitioning to low-carbon production and to enable the sector to adapt to the new climate reality. That is, public policy must encourage adopting modern and sustainable practices, which will contribute to climate change adaptation and mitigation. Appropriate financial instruments are necessary to enable the substantial investments required in the face of increasingly frequent extreme weather events.
To contribute to a better understanding of climate risk and the design of public policies for agricultural risk management, researchers from Climate Policy Initiative/Pontifical Catholic University of Rio de Janeiro (CPI/PUC-Rio) examined rural insurance in Brazil, analyzing the coverage of this financial instrument for soybeans, the main insured crop. Regions with higher risk exposure, and the distribution of rural insurance in Brazilian regions were also mapped. Researchers also investigated the most relevant climate variables to explain policy claims and agricultural production losses in Brazil, an essential factor for production variability and, consequently, for implementing public policies.
Results show that rural insurance is still limited in the country, with a strong concentration in the Midwest and South regions. Despite the recent expansion of soybean production in regions such as MATOPIBA (comprising areas of the states of MAranhão, TOcantins, PIauí, and BAhia), insurance coverage did not grow proportionally. The limited policy history in underserved regions is one of the obstacles to increasing coverage of rural insurance. The researchers show that, by using machine learning models, it is only possible to establish a clear relationship between claims’ incidence and climate indicators in regions with many insurance policies.
On the other hand, even in regions with a limited insurance history, such as the Northeast, climate variables are relevant in the machine learning models to explain production losses when measured with data from the Municipal Crop Production (Produção Agrícola Municipal – PAM) survey of the Brazilian Institute of Geography and Statistics (Instituto Brasileiro de Geografia e Estatística – IBGE). The analysis shows that precipitation, fire risk, and wind variables—associated with events such as droughts and storms—strongly correlate with agricultural losses. In addition, those models allow for identifying the most relevant months in explaining the incidence of production losses in each region. This modeling capacity becomes even more relevant in the current context of climate change, in which extreme events have become more frequent, increasing agricultural risk.
PUBLIC POLICY RECOMMENDATIONS
The complexity of the climate scenario and its potential impacts on agricultural production, a key component of the national economy, requires coordinated action on multiple fronts. Public policies should be developed in a complementary and simultaneous way rather than in isolation. Risk management tools must be improved and expanded, which requires a good alignment between the government and the private sector. The main recommendations for improving public policies for agricultural risk management are listed below:
• Insurance supply must be expanded to producers and regions with limited access to financial products, which are also more vulnerable to climate events. This is the case, for example, in MATOPIBA.
• As demonstrated in this study, insurers can use prediction models capable of extracting information from available climate variables to estimate agricultural losses. In addition to claims history, it is possible to use historical agricultural production and yield data at the municipality level, allowing for pricing policies in areas that are not yet insured.
• The Rural Insurance Premium Subsidy Program (Programa de Subvenção ao Prêmio do Seguro Rural – PSR), which subsidizes the cost of policies, should favor regions where coverage is still scarce. In areas where climate risk is high, insurers tend to increase prices, limit the supply of insurance, or even decide not to enter the market.
• The constant improvement of the Agricultural Climate Risk Zoning (Zoneamento Agrícola de Risco Climático – ZARC) should contribute to producers operating with lower risk, reducing the occurrence of claims.
• Ensuring insurers’ liquidity is essential in an increasing risk scenario. Insurers must have instruments to protect themselves from generalized agricultural losses, which generate difficulties in covering claim payments. In addition to boosting the activity of reinsurers, it is important to advance with the regulation and implementation of a public-private fund that can be activated in these situations.
• Public policy must be aligned with environmental preservation objectives, favoring sustainable and low-carbon agricultural practices, and producers who do not engage in deforestation.
Soybean production and crop insurance in Brazil
Brazil is the largest soybean producer in the world. According to data from the Food and Agriculture Organization (FAO), Brazil produced around 122 million tons of soybeans in 2020, corresponding to a production value of US$ 44 billion.[1] This was equivalent to 30% of the global value of soybean production in that year. Nationally, soybeans also account for most of the crop production. The production value of soybeans in 2020 corresponded to 36% of all crop production in the country, according to data from PAM/IBGE.
Soybean production in Brazil is concentrated in the Midwest and South regions. The Midwest accounted for 44% of the soybean production value in the country in 2020, while the South accounted for 30%. It is worth noting that the states in the North and Northeast regions that make up MATOPIBA have increased their share of national production, rising from 10% in 2010 to 14% of the production value in 2020. The presence of soybeans has been expanding throughout the national territory: 1,800 municipalities produced soybeans in 2010, a number that rose to 2,388 municipalities in 2020.
Soybean-producing establishments present quite distinct regional patterns. The Southern region concentrates 83% of the establishments in an area that represents 29% of the total area dedicated to soybean production in the country, according to data from the IBGE Agricultural Census of 2017 in Table 1. On the other hand, the Midwest region has a larger area (45%) but with a smaller number of establishments (10%). Therefore, the average size of establishments in the South is much smaller than in the Midwest. In this regard, the Northeast region has a peculiarity. Although characterized by small properties for certain crops, this is not the case for soybeans, which follow a pattern more similar to that of the Midwest region. In fact, the Northeast region has the highest average area per soybean-producing establishment in the country, followed by the North region.
Table 1. Regional Distribution of Soybean-Producing Establishments, 2017
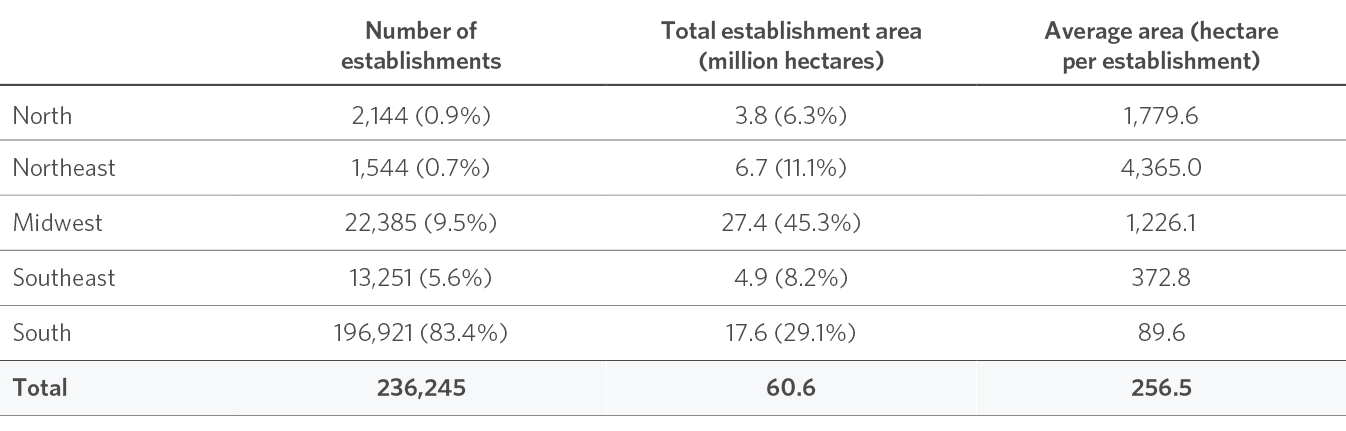
Source: CPI/PUC-Rio with data from IBGE/Agricultural Census 2017, 2023
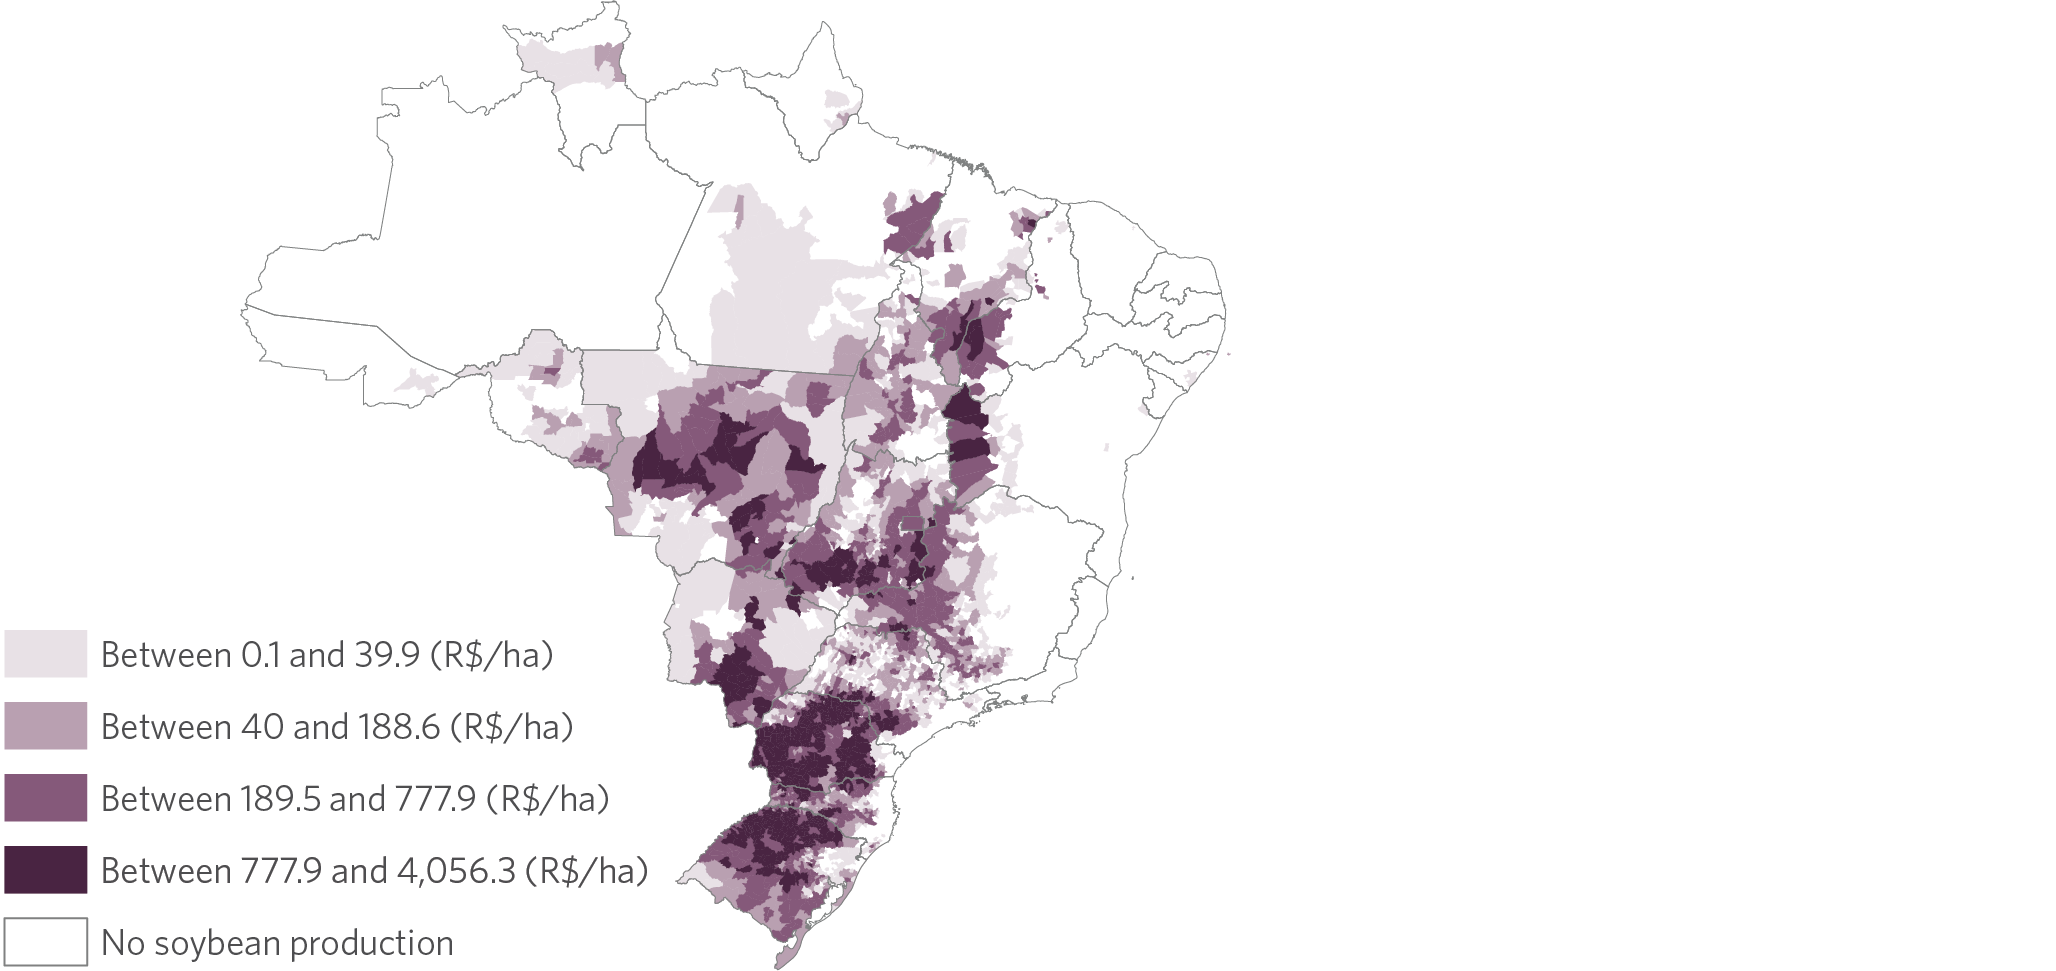
Like the rest of the agricultural sector, soybean producers are subject to a series of climate risks that can result in production losses.[2] Some places are more exposed to risks than others, given the climatic and geographic diversity of the national territory. Figures 1a and 1b identify regions with high production intensity and greater risk exposure based on municipality-level data from PAM/IBGE. The figures show, respectively, the production value per area of the municipality in 2018[3] and the coefficient of variation (standard deviation over the mean) of the average soybean yield between 2006 and 2018. The average yield is the quantity produced per harvested area (in kilograms per hectare), which measures productivity. A high coefficient of variation accounts for greater variability in soybean productivity in a given place, a possible indicator of instability associated with climate events. The maps reveal some regions with high soybean production intensity and high variability, such as MATOPIBA region (especially the southwest of Piauí and the west of Bahia), the northwestern part of Rio Grande do Sul, and the west of Paraná.
Figure 1. Intensity and Variability of Soybean Production in Brazil
1a. Production Value per Municipality Area, 2018
1b. Coefficient of Variation of Average Yield, 2006 to 2018
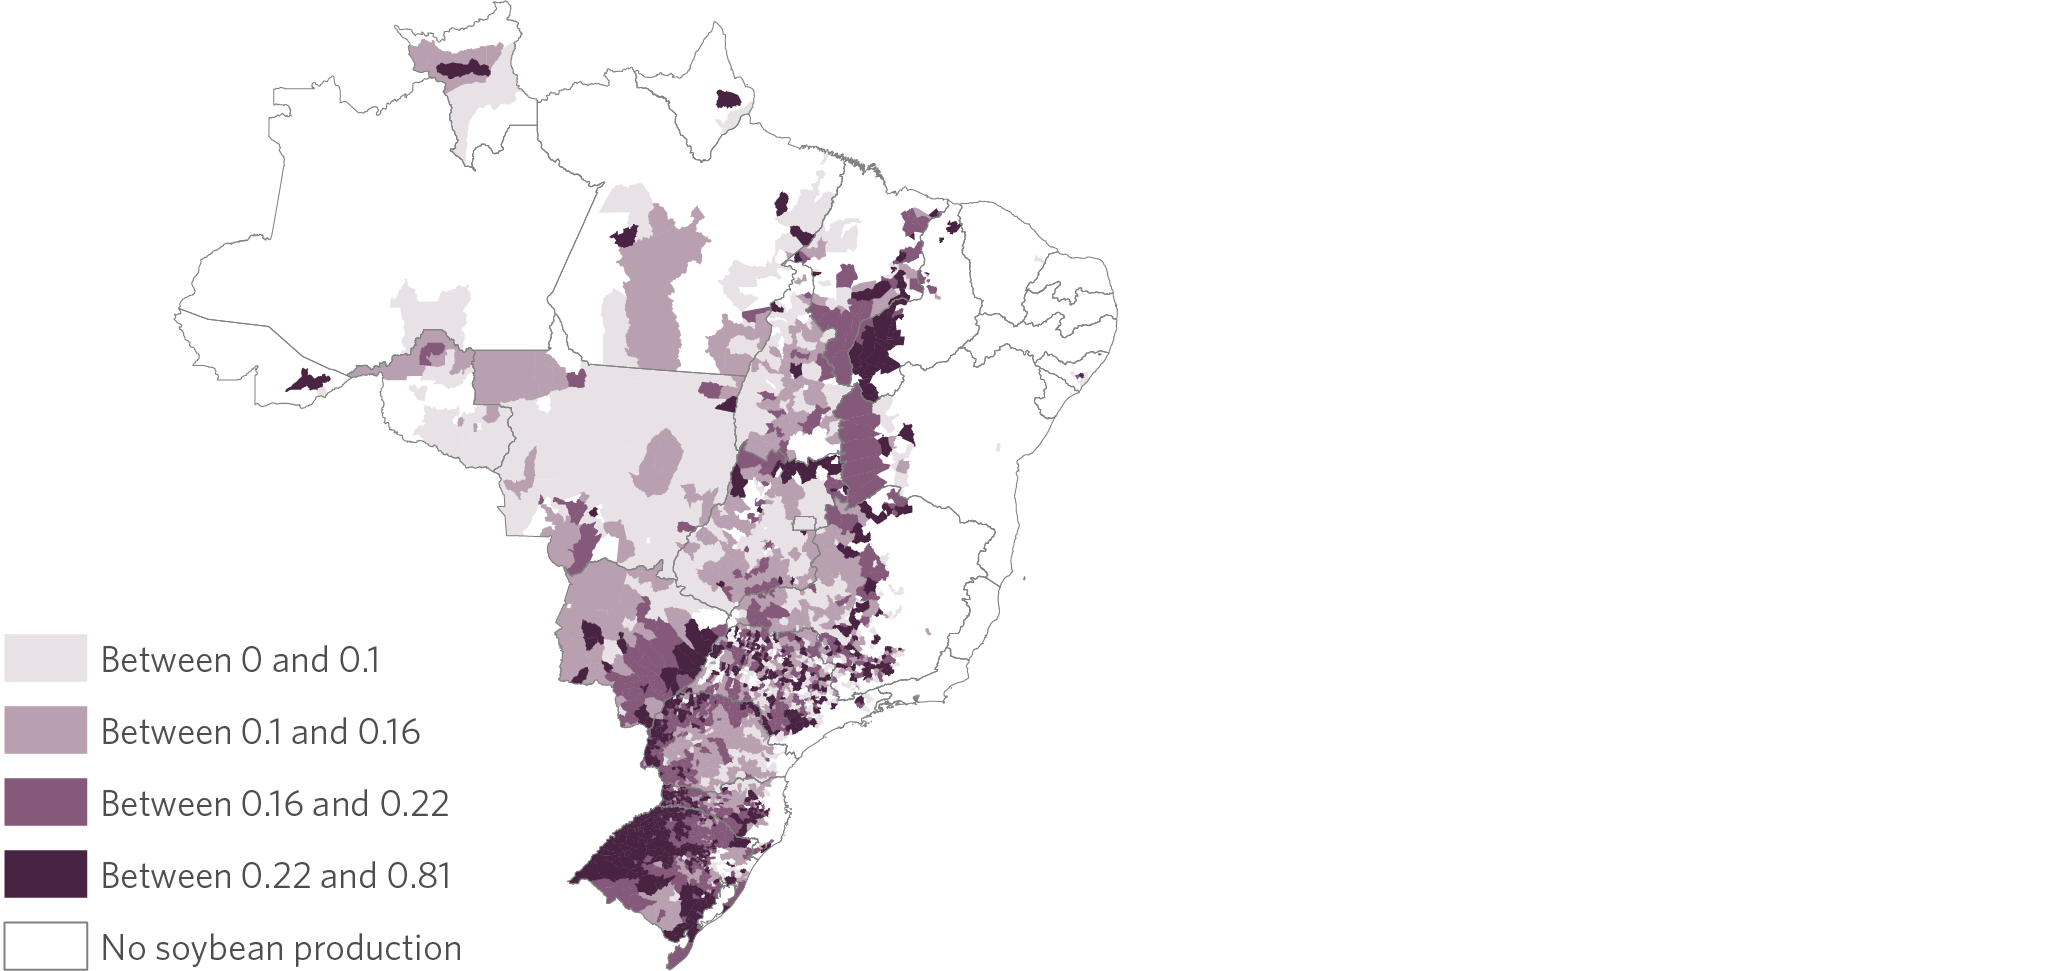
Note: In Figure 1a, the legend displays quartiles of the distribution of the production value per municipality area in 2018, measured in Brazilian reais per hectare. In Figure 1b, the legend displays quartiles of the distribution of the coefficient of variation (standard deviation divided by the mean) of the quantity produced per harvested area (average yield) between 2006 and 2018. The average yield is measured in kilograms per hectare.
Source: CPI/PUC-Rio with data from PAM/IBGE, 2023
Brazilian rural producers can access risk management instruments and rely on government insurance programs to protect themselves from natural risks.[4] However, Brazil’s crop production is less insured than other countries.[5] Furthermore, policies are strongly concentrated on specific crops, mainly cereals. Soybeans stand out with 30% of insurance policies and over half of the total premiums disbursed in 2018, according to SUSEP data.
However, the availability of rural insurance differs from the distribution of soybean production in the country. As shown in Table 2, the Southern region concentrates 60% of policies and 43% of the premium value, despite representing 37% of soybean production value between 2006 and 2018.[6] On the other hand, the Southeast region concentrates 7% of the production value but 12% of premiums and 16% of policies. The Midwest region accounts for the largest share of planted area (45%) and production value (44%), but it concentrates 20% of insurance policies and 34% of premiums disbursed.[7] This may be partly related to lower risk exposure in the region, as demonstrated by the lower soybean yield variability, as shown in Figure 1b. The Northeast region has a similar proportion of planted area (8%), production value (8%), and rural insurance premiums (9%) in soybean farming, but it presents a higher proportion of insurance claim payments (18%). This suggests that the region indeed has an increased risk of losses, as indicated in Figure 1b.
Table 2. Regional Distribution of Soybean Production and Rural Insurance Variables Associated with Soybean Farming, 2006-2018
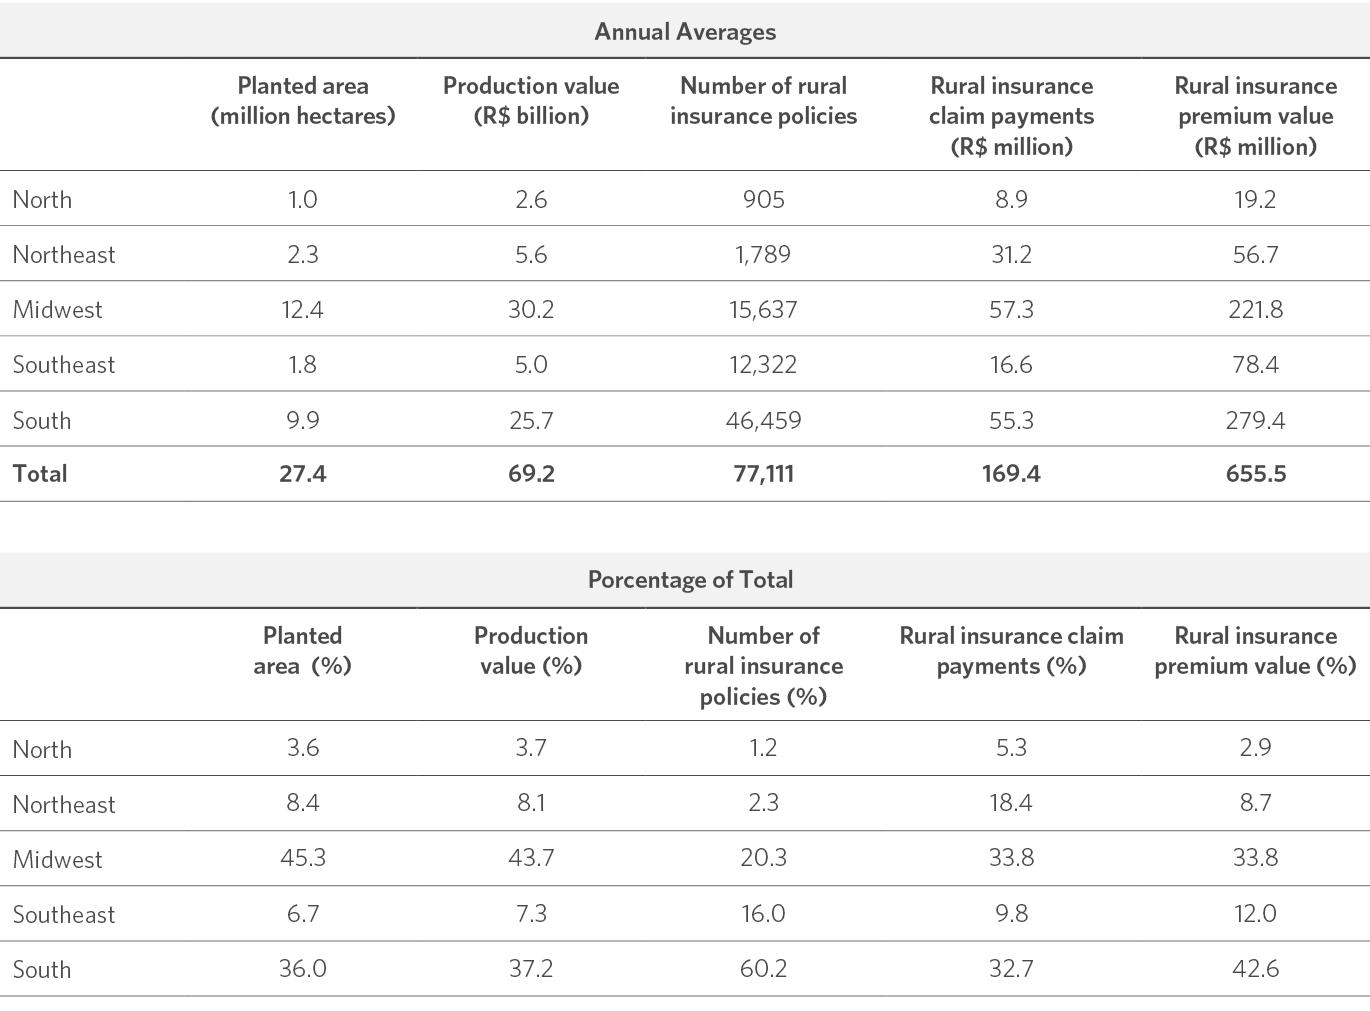
Source: CPI/PUC-Rio with data from SUSEP and PAM/IBGE, 2023
Despite its still limited coverage, the Brazilian rural insurance market has grown significantly. The total amount paid in rural insurance premiums jumped from R$ 813.7 million in 2006[8] to over R$ 13.4 billion in 2022, corresponding to a real increase of 16 times.[9] Of this amount, R$ 6.3 billion is related to crop, aquaculture, cattle, and forestry[10] insurance contracts.
Following the Brazilian rural insurance market trend, soybean insurance coverage has expanded considerably in recent years. The number of municipalities with soybean insurance increased by 22% between 2008 and 2018, from 1,074 to 1,313 municipalities, as shown in Figure 2. However, the number of insured municipalities is still far from the 2,319 soybean-producing municipalities in 2018 (data from PAM/IBGE), with more than 1,000 municipalities without insurance coverage. Although the number of policies has grown across the coverage area, reaching 266,414 in 2018, compared to 22,747 in 2008, this expansion is concentrated in the Midwest, MATOPIBA, and southern Rio Grande do Sul, regions with high production value per area.
The figure also indicates the existence of large soybean-producing regions with low insurance coverage, such as much of the state of São Paulo, western Santa Catarina, and part of northern Rio Grande do Sul. However, it is worth noting the significant expansion of rural insurance since 2018, particularly concerning the PSR.[11] Even though data for the entire universe of rural insurance (SUSEP) for more recent periods are unavailable, PSR data for 2021 suggests that these regions continue to have relatively low insurance coverage.
Figure 2. Distribution of the Number of Soybean Insurance Policies in Brazilian Municipalities, 2008 and 2018
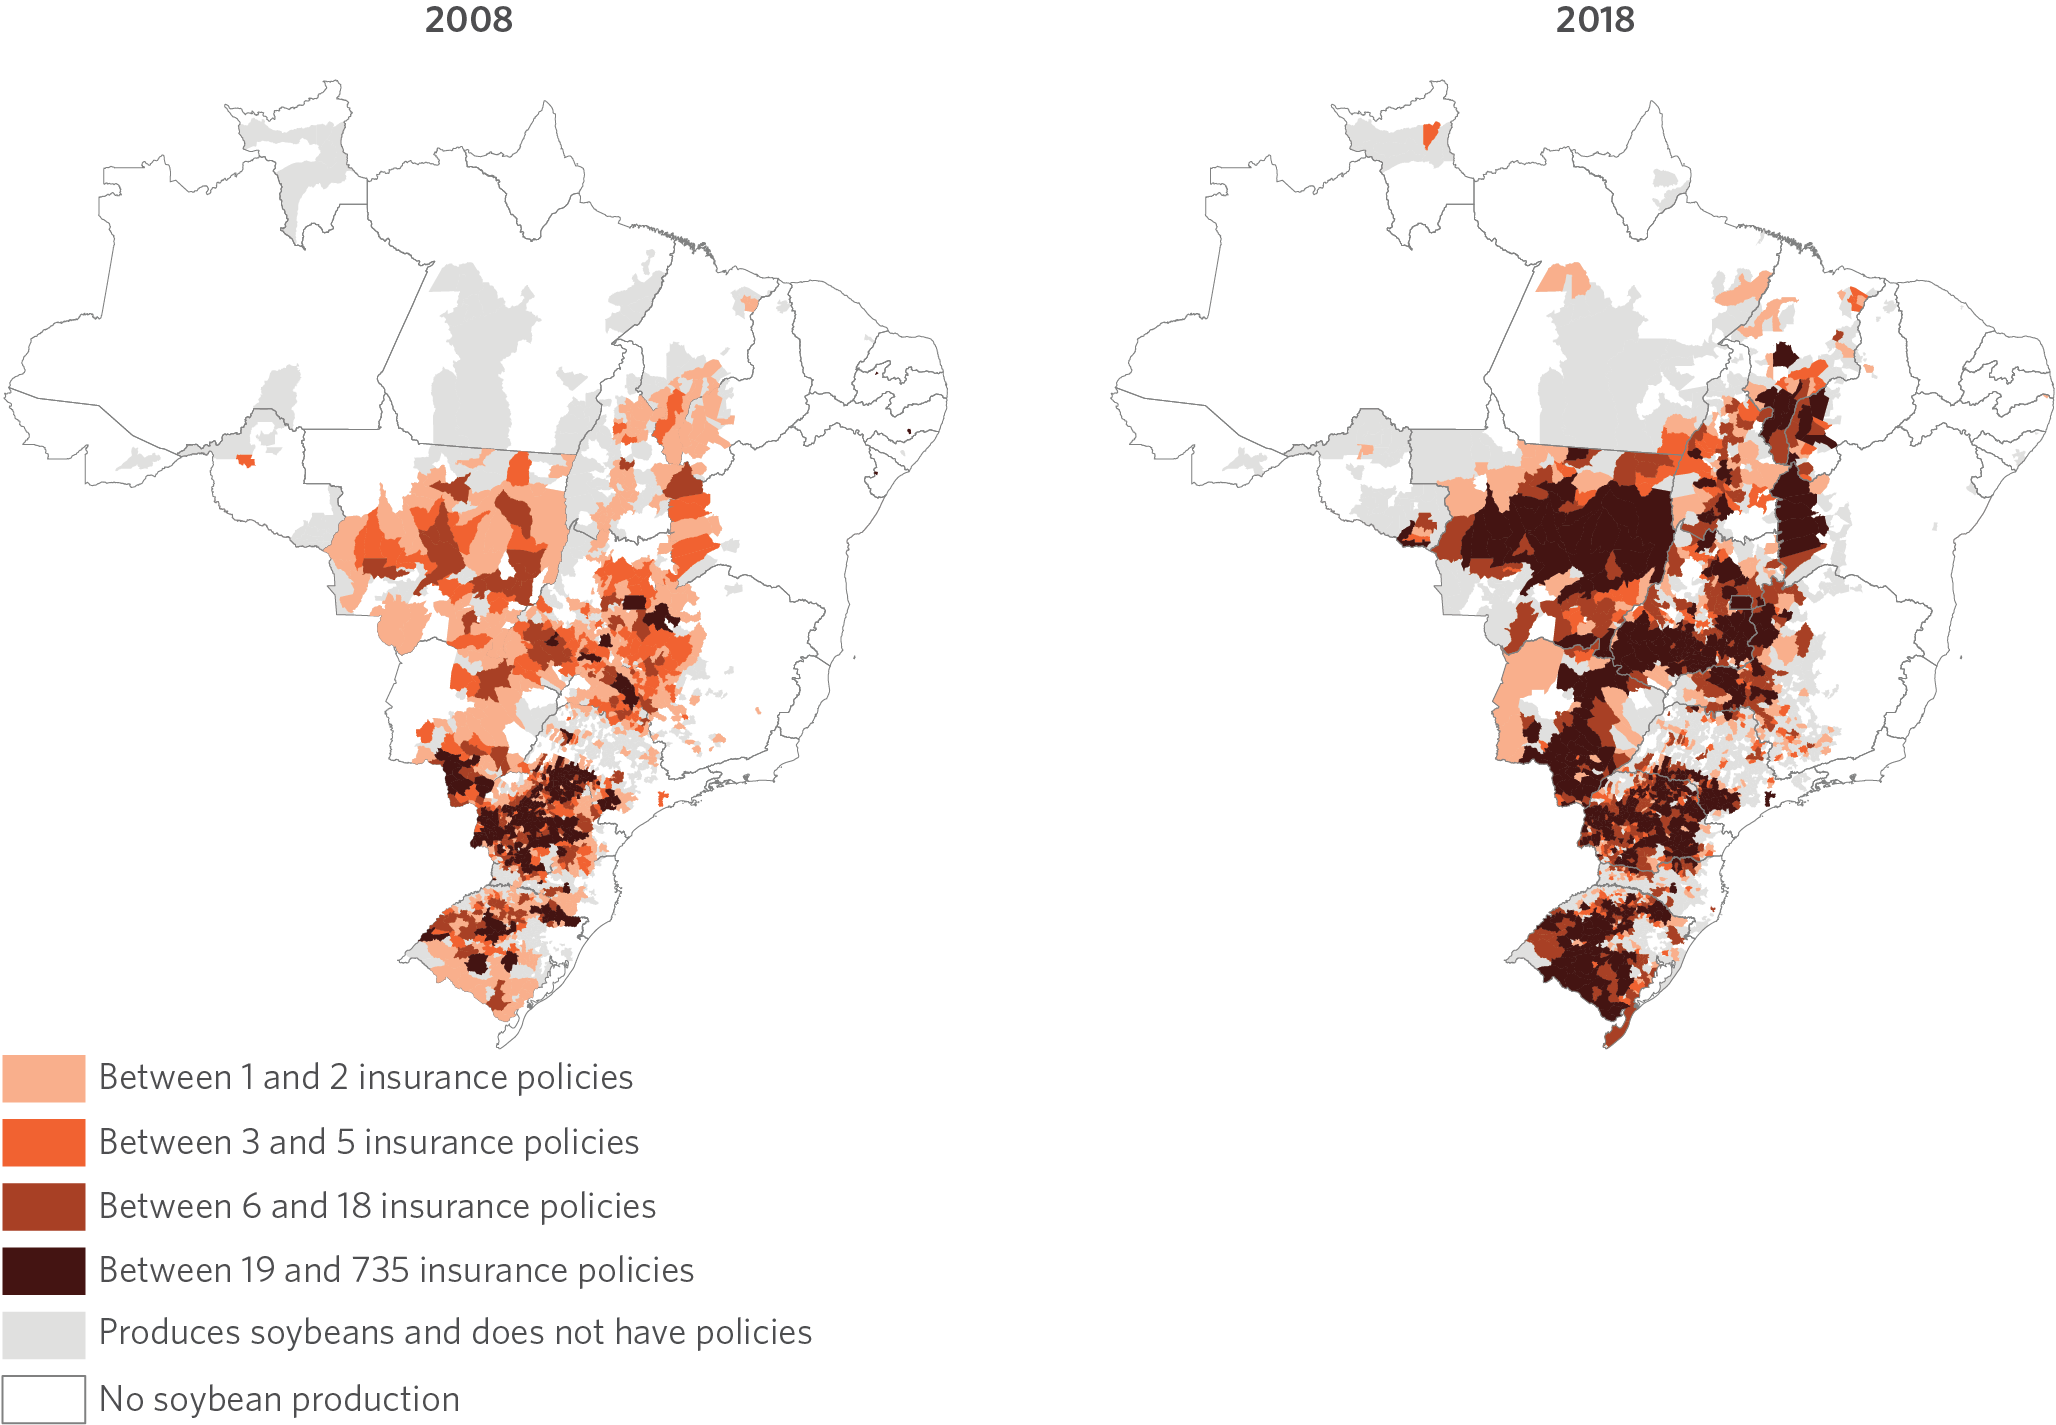
Note: The figure refers to the quartiles of the distribution of the number of crop insurance policies for soybeans, considering the joint distribution of soybean policies from 2008 and 2018.
Source: CPI/PUC-Rio with data from SUSEP and PAM/IBGE, 2023
Climate Change Impacts on Rural Insurance
The relevance of risk management tools in agriculture, particularly in soybean production, is expected to increase with the growing uncertainty associated with climate events. This section discusses how climate change affects agricultural production and rural insurance, and analyzes recent extreme events observed in Brazil.
In recent years, severe droughts have significantly impacted the number of claims in rural insurance. These climate events occurred mainly in the Center-South region of the country and caused claims in soybean and corn crops, two of the primary insured crops. In 2022, the total amount of rural insurance claims was R$ 8.8 billion,[12] higher than the total premiums collected. With climate change, events of this intensity are expected to become increasingly common.[13] Therefore, rural producers and insurers must be prepared to adapt to global warming.
Although it is a gradual phenomenon, important variations in climate are already being perceived. New evidence reinforces the conclusion of the report by the Intergovernmental Panel on Climate Change (IPCC) that global temperature increases cause climate extremes, such as exceptionally high or low temperatures, intensification of precipitation, including tropical cyclones, and worsening droughts in some regions.[14]
There is high confidence among IPCC scientists that hot extremes have increased and cold extremes have decreased in Central and South America in recent decades. Between 1961 and 2014, most of South America experienced an increase in the intensity and frequency of heat wave events. In addition, there is a decrease in daily precipitation in Northeast Brazil and an increase in extreme rainfall in Southeast South America and the Amazon. Furthermore, compound events—when several extreme events of different or similar types occur simultaneously or in succession—impact ecosystems and societies more strongly than when such events occur in isolation. As individual extreme events become more severe due to climate change, the combined occurrence of these events creates unprecedented compound events. When we add the effects of drought and extreme heat, for example, there is an increased risk of forest fires and damage or crop losses.
In addition to climate change, regional rainfall and drought patterns make it difficult for producers and insurers to predict. Figure 3 shows the most extended streak of consecutive days without precipitation per municipality each year. The maps show that some regions are more affected by droughts in some years and less affected in others. With droughts distributed across the territory in different ways each year, risk calculation and climate prediction are complicated. This is the case for the MATOPIBA, Goiás, Northern Minas Gerais, and Ceará regions. On the other hand, some areas have a more stable pattern, such as the country’s Southern region. This reinforces the inclination of insurers to stay in areas where the risk is lower, and there is greater predictability of claims occurrence. It should be mentioned that even these regions are not free from extreme events, and the recent crop losses were primarily due to droughts in the South.
Figure 3. Consecutive Days without Precipitation per Municipality, 2007-2021
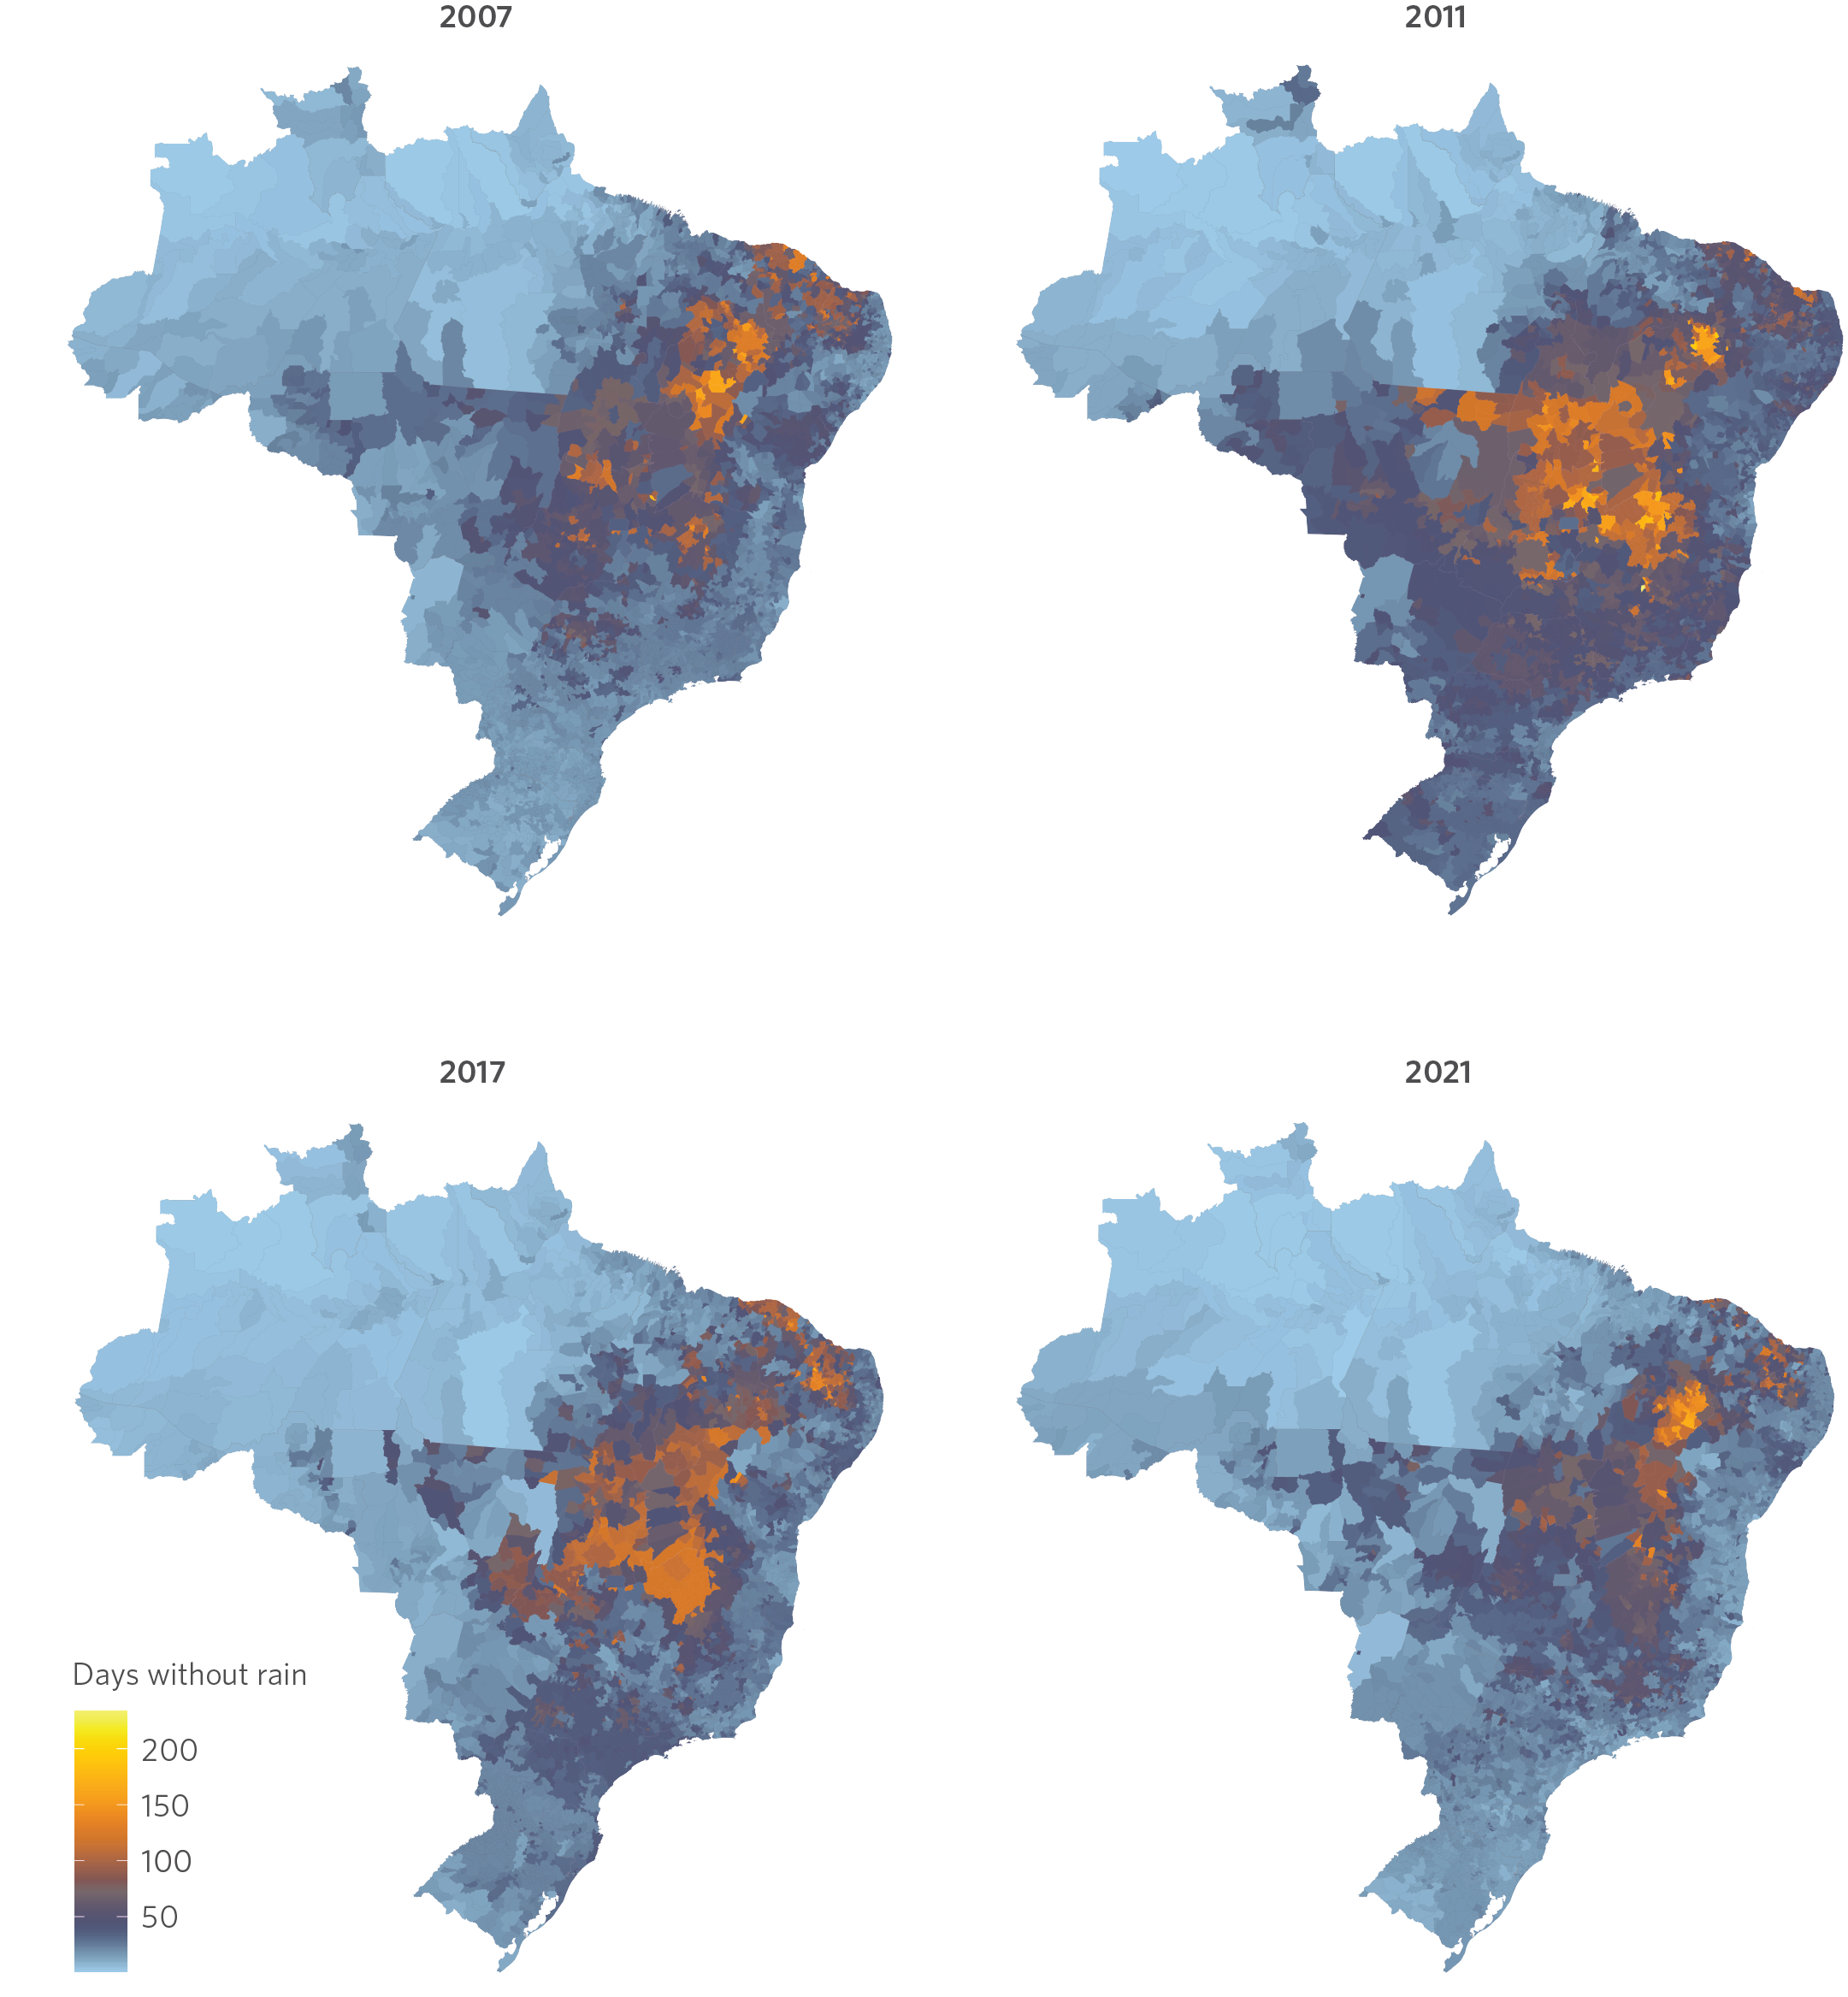
Note: The above maps show the maximum number of consecutive days with precipitation equal to 0 in Brazilian municipalities each year. The numbers were built based on daily precipitation data aggregated by municipality.
Source: CPI/PUC-Rio with data from CHIRPS Daily: Climate Hazards Group InfraRed Precipitation with Station Data (Version 2.0 Final), 2023
These local weather patterns bring challenges to agricultural production in Brazil. The unpredictability of the climate and the increasing frequency of extreme events have resulted in significant economic losses in recent years, a situation that is likely to worsen. When analyzing agricultural, cattle, aquaculture, and forestry insurance premiums for crops over the last decade, it is observed that the premiums received by insurers exceed the value of claim payments for losses, except for the 2015/16 and 2018/19 crops. However, the value of claim payments (R$ 11.4 billion) for the 2021/22 crop was more than double the value of premiums (R$ 5.1 billion), according to data from SUSEP, an unprecedented figure in the available historical series.[15]
Insurers seek to ensure their financial liquidity and protect themselves against generalized risks through financial instruments, primarily through reinsurance, an operation in which part of the risk is transferred to another entity, the reinsurer. The reinsurance market for rural operations in Brazil has expanded in the last decade, growing more than five times in terms of the total reinsurance premiums between the 2010/11 and 2021/22 crops, according to SUSEP data.[16] However, the market is highly concentrated, with a single company (IRB Brasil) holding 89% of premiums in the 2011/12 crop. Since then, this percentage has declined, reaching 38% in 2021/22. During this period, there has been an increase in the participation of foreign companies, which can mitigate their risks globally.
In the face of a growing risk environment, ensuring insurers’ financial stability is essential. The reinsurance market is expected to become increasingly important due to the aggregate risk associated with extreme events, which will become more common with climate change. Therefore, expanding and deconcentrating the reinsurance market should generate greater risk diversification, increasing protection for producers and insurers. Advances in the regulation and operation of a public-private fund that can be activated in the event of generalized losses in the agricultural sectors can also contribute to protecting insurers’ activities in these situations.
climate risk and crop losses
Given the challenges for Brazilian agriculture generated by climate risk, researchers from CPI/PUC-Rio applied machine learning models to understand which climate variables are most relevant in explaining losses in agricultural production. The results focus on soybean production between 2006 and 2018, given the availability of data on rural insurance from SUSEP. The estimated models, called Least Absolute Shrinkage and Selection Operator (LASSO),[17] select relevant climate variables to explain the behavior of an indicator (such as the number of policies with claims) from a potentially large set of variables. The goal is that the model selects only variables in the relevant months to explain the losses. The model also allows for understanding the differences in patterns across regions.
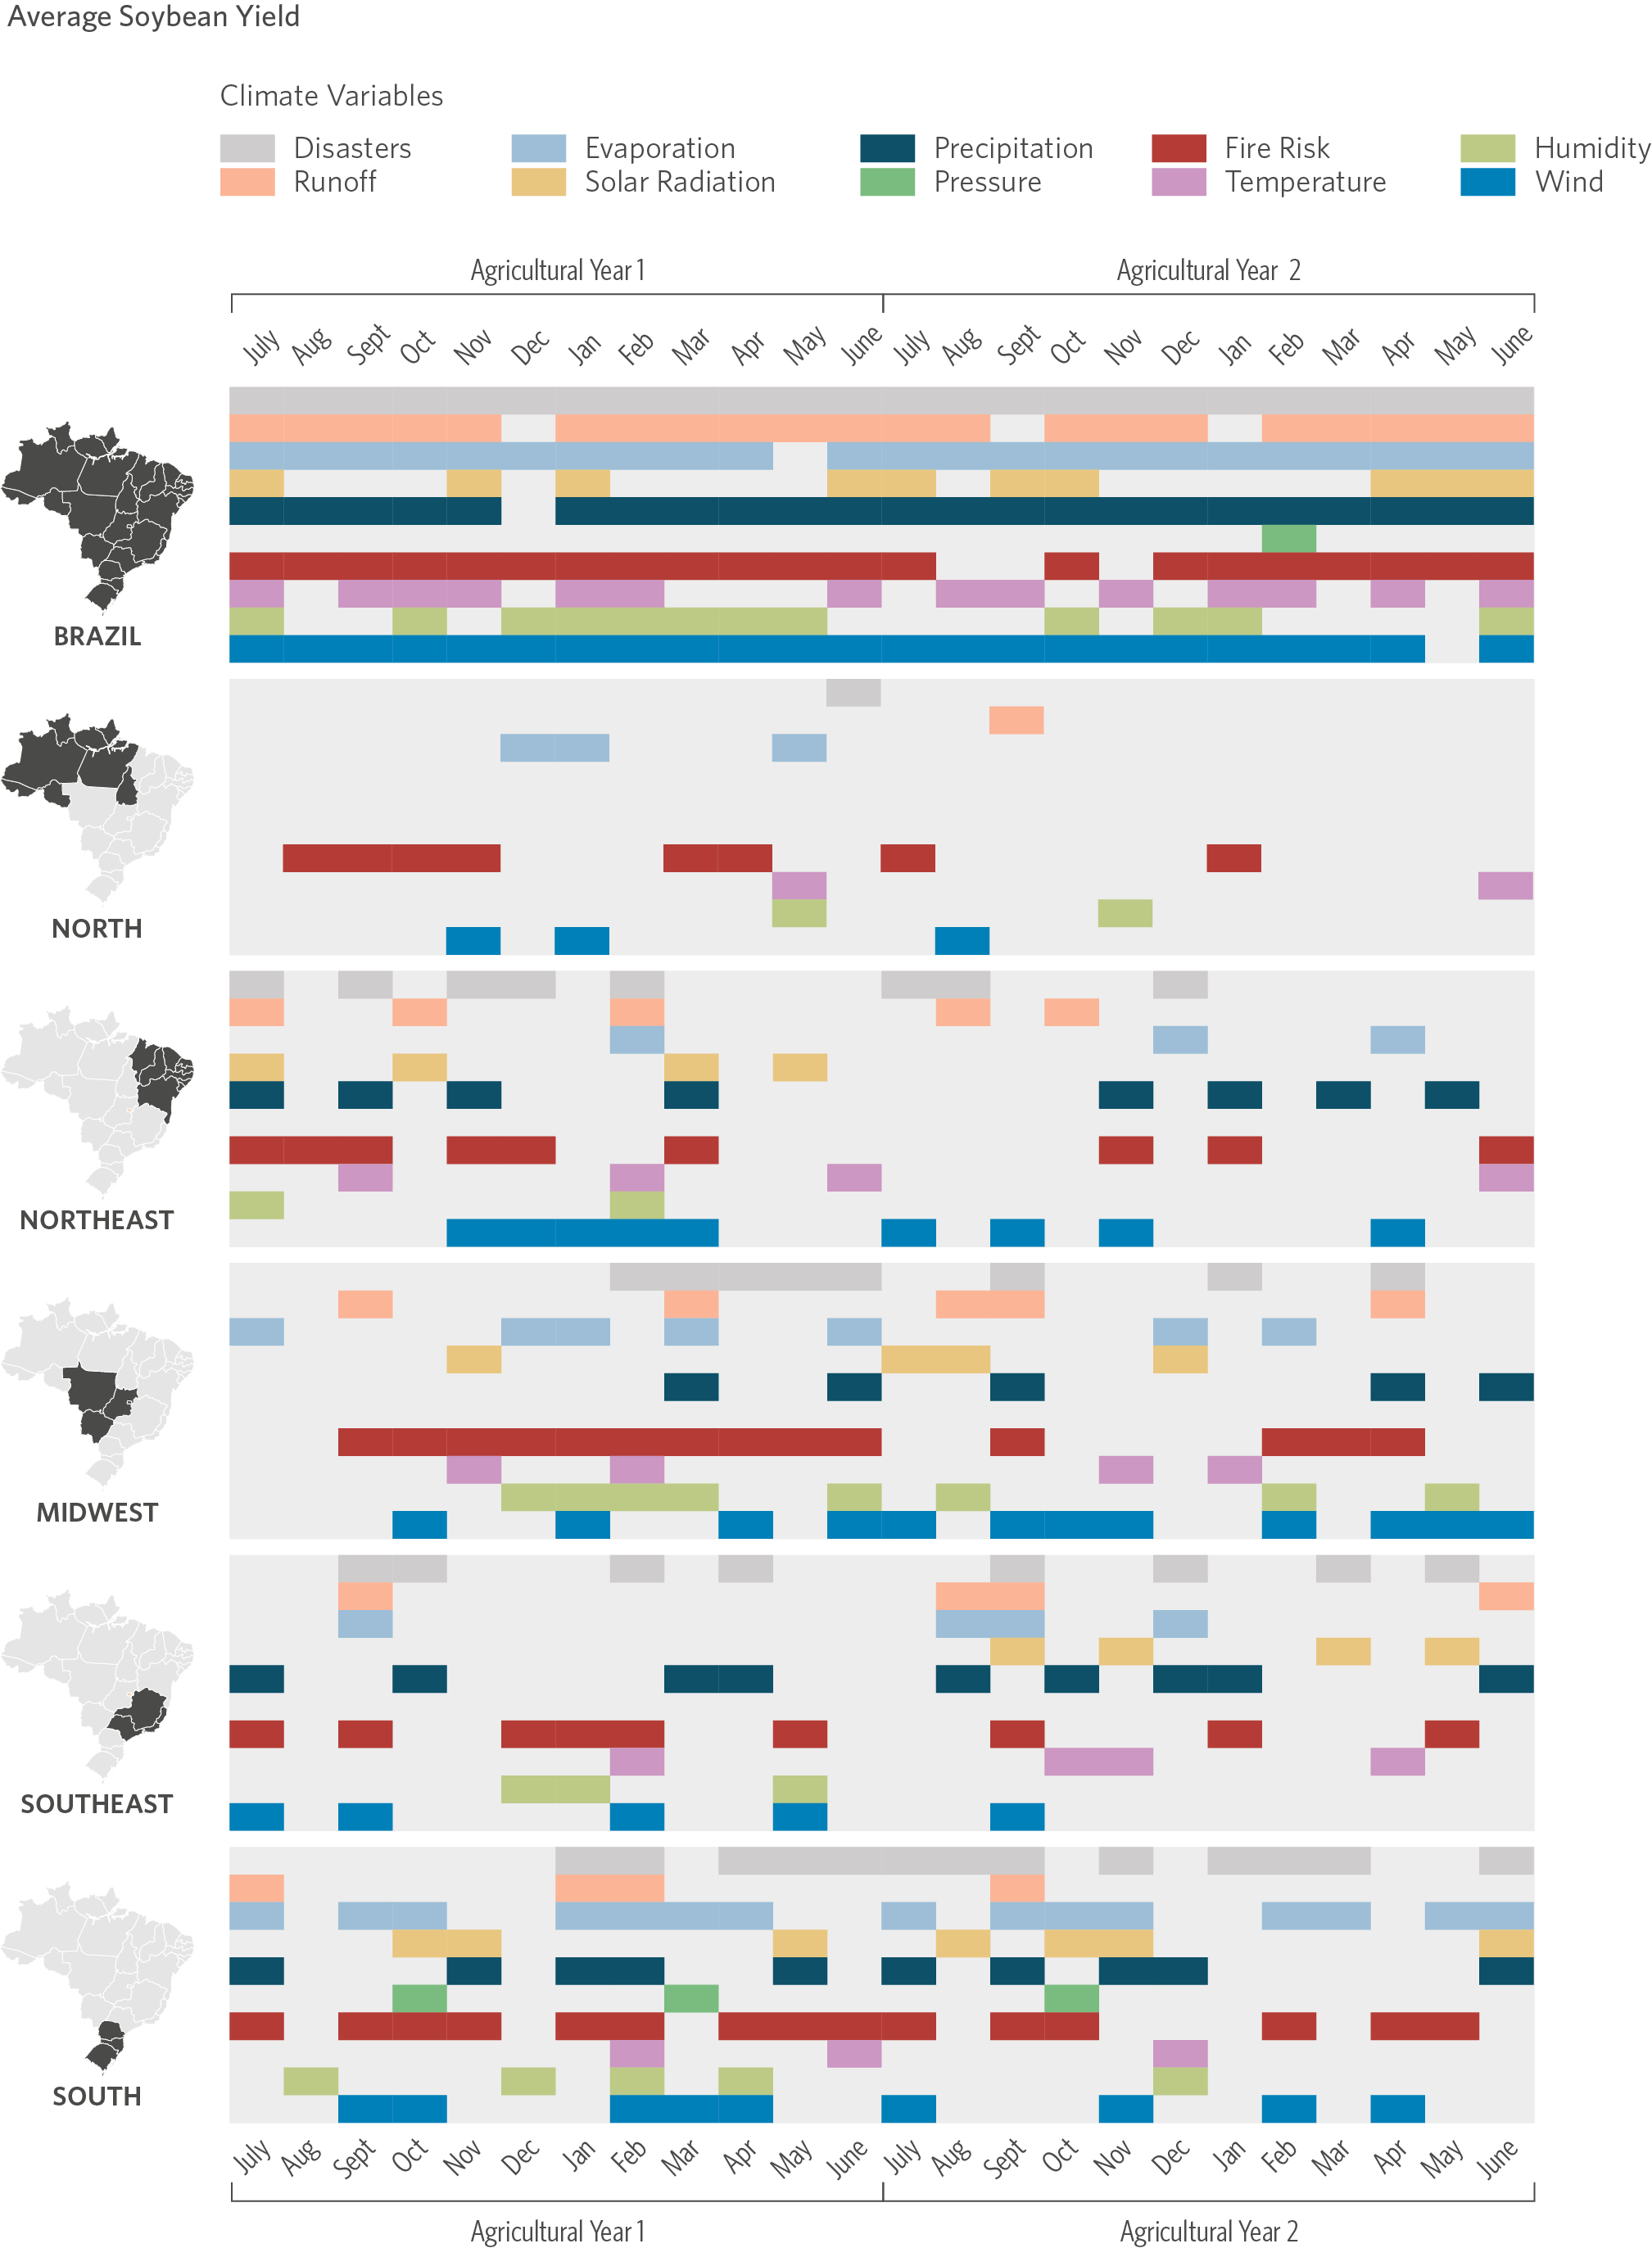
Figures 4a and 4b show the climate variables selected to explain two measures of reported losses in rural insurance policies: (i) the number of policies with claims and (ii) the value of claim payments.[18] Selected variables are highlighted in color—each representing a group of variables—and by month—each column corresponding to a month. The model considered the period corresponding to two consecutive agricultural years: the agricultural year in which the policy starts (to consider claims until the end of that same agricultural year), and the previous agricultural year (to capture potential cumulative climate effects).[19] Finally, results are displayed in panels by region. More details can be found in Annex I.
Figure 4. Climate Variables Selected by the LASSO Model per Month and Agricultural Year
4a. Policies with Claims
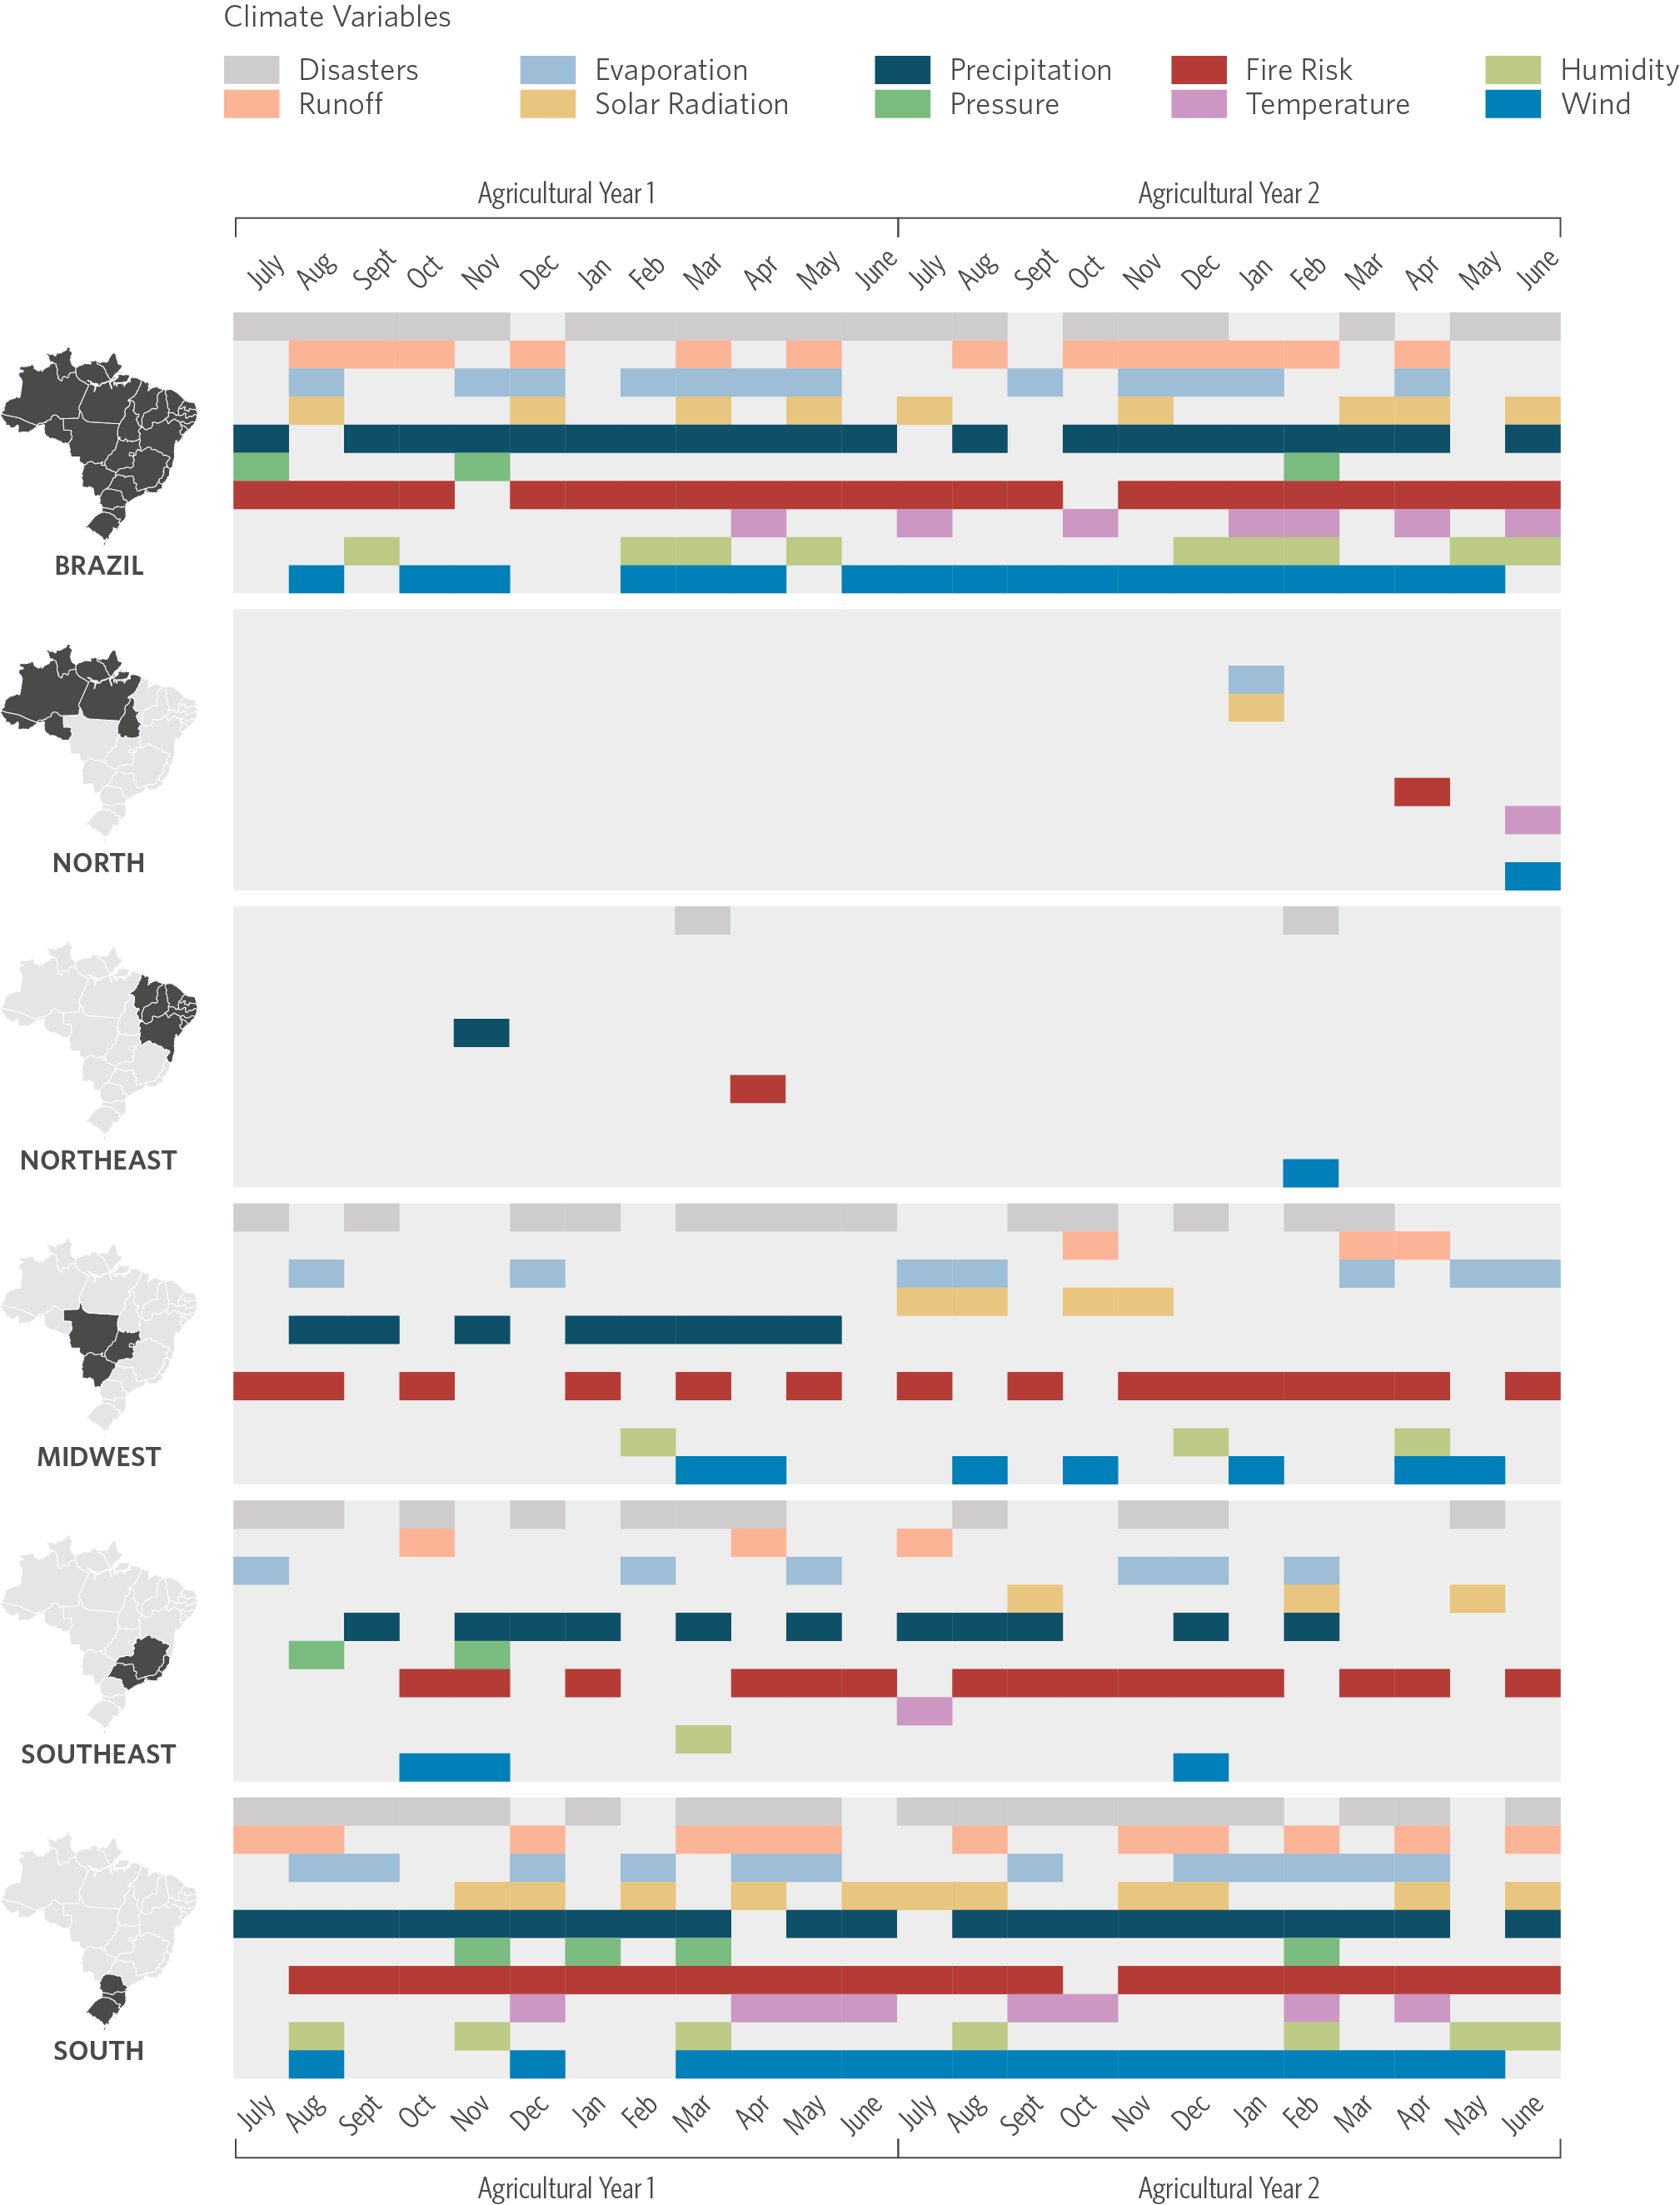
4b. Value of Claim Payments
Source: CPI/PUC-Rio with data from SUSEP, Era5, Era5-Land, CHIRPS, INPE, PAM/IBGE, Embrapa, S2iD, 2023
The overall results for Brazil indicate that models mainly select climate variables related to precipitation, fire risk, and wind. These three groups of variables influence the likelihood of drought, thus affecting the probability of losses. Higher fire risk indexes are also associated with higher drought risk. Similarly, heavy rainfall and storms are related to excessive precipitation combined with high wind speed. This result reinforces the loss report published by the Ministry of Agriculture and Livestock (Ministério da Agricultura e Pecuária – MAPA),[20] which shows that soybean crops in Brazil are mainly affected by droughts and excessive rainfall. Temperature variables have, individually, a lower explanatory potential compared to precipitation variables. In addition, the model for Brazil as a whole does not show a clear seasonal pattern, which is expected since the seasons have specific regional patterns that shape climate risk.
The models allow for exploring the temporal distribution of selected climate variables. Both the volume of claimed policies and the value of claim payments are more correlated with climate variables at certain times of the year due to their relationship with soybean planting and harvesting periods in each region. In the Southern region, models select a significantly higher number of climate variables in the second semester of the year, specifically in September and November, which coincides with the soybean planting period, according to the National Supply Company (Companhia Nacional de Abastecimento – CONAB).[21] In the Midwest region, there is an evident peak of selected variables in the first semester, particularly in March, when soybean harvesting takes place in the region.
In addition, the volume of claimed policies and the value of claim payments tend to be more related to climate variables at the beginning (January) and middle (July) of the year, but this relationship is more robust in January. This pattern is mainly explained by the South region, where the typically rainy summer plays a crucial role in the final stages of planting, which marks a critical period for the crop’s development. During this period, plants are particularly vulnerable, and droughts can significantly impact production.
Based on the analysis of the results by region, significant differences were observed in the model’s predictive power. In some regions, the models struggle to predict outcomes due to the limited data availability, particularly in areas with fewer rural insurance policies, such as the North and Northeast. The generated models aggregate little explanatory power for these regions compared to the baseline model that does not use climate variables. Regarding the claim payments variable, the model does not even select any climatic variable for the Northern region.
However, despite the low concentration of rural insurance in such regions, the municipalities of MATOPIBA concentrate around 14% of the national soybean production, as shown earlier. The area has a high exposure to climate risk, considering the high variability of the average soybean yield presented in Figure 1b and precipitation data that reveal that, in years of severe drought, the region was particularly affected, as shown in Figure 3. In addition, according to the agriculture loss study by MAPA mentioned earlier, Piauí was the state with the highest number of crop failures between 2000 and 2021.
On the other hand, models show better performance in the Southern and Midwest regions. The results indicate a strong correlation between climate variables and losses. As with the general analysis results, the three groups of variables most frequently selected are precipitation, fire risk, and wind.
Since the prevalence of rural insurance is quite unequal in the Brazilian territory, it is difficult to distinguish to what extent the low performance of models in regions such as the North and Northeast is due to structural characteristics of the local weather that make it difficult for the model to predict losses or only to the low availability of rural insurance data. In fact, the country’s soybean production distribution is quite distinct from the distribution of soybean insurance, as shown in Table 2. Regarding the number of policies, the Northern and Northeastern regions together account for 4% of the total, which partly explains the difficulty of the model in generating robust predictions in these regions. However, these regions account for a relevant part of national soybean production in the study period (equivalent to 12% of the total value of the country’s production, according to Table 2).
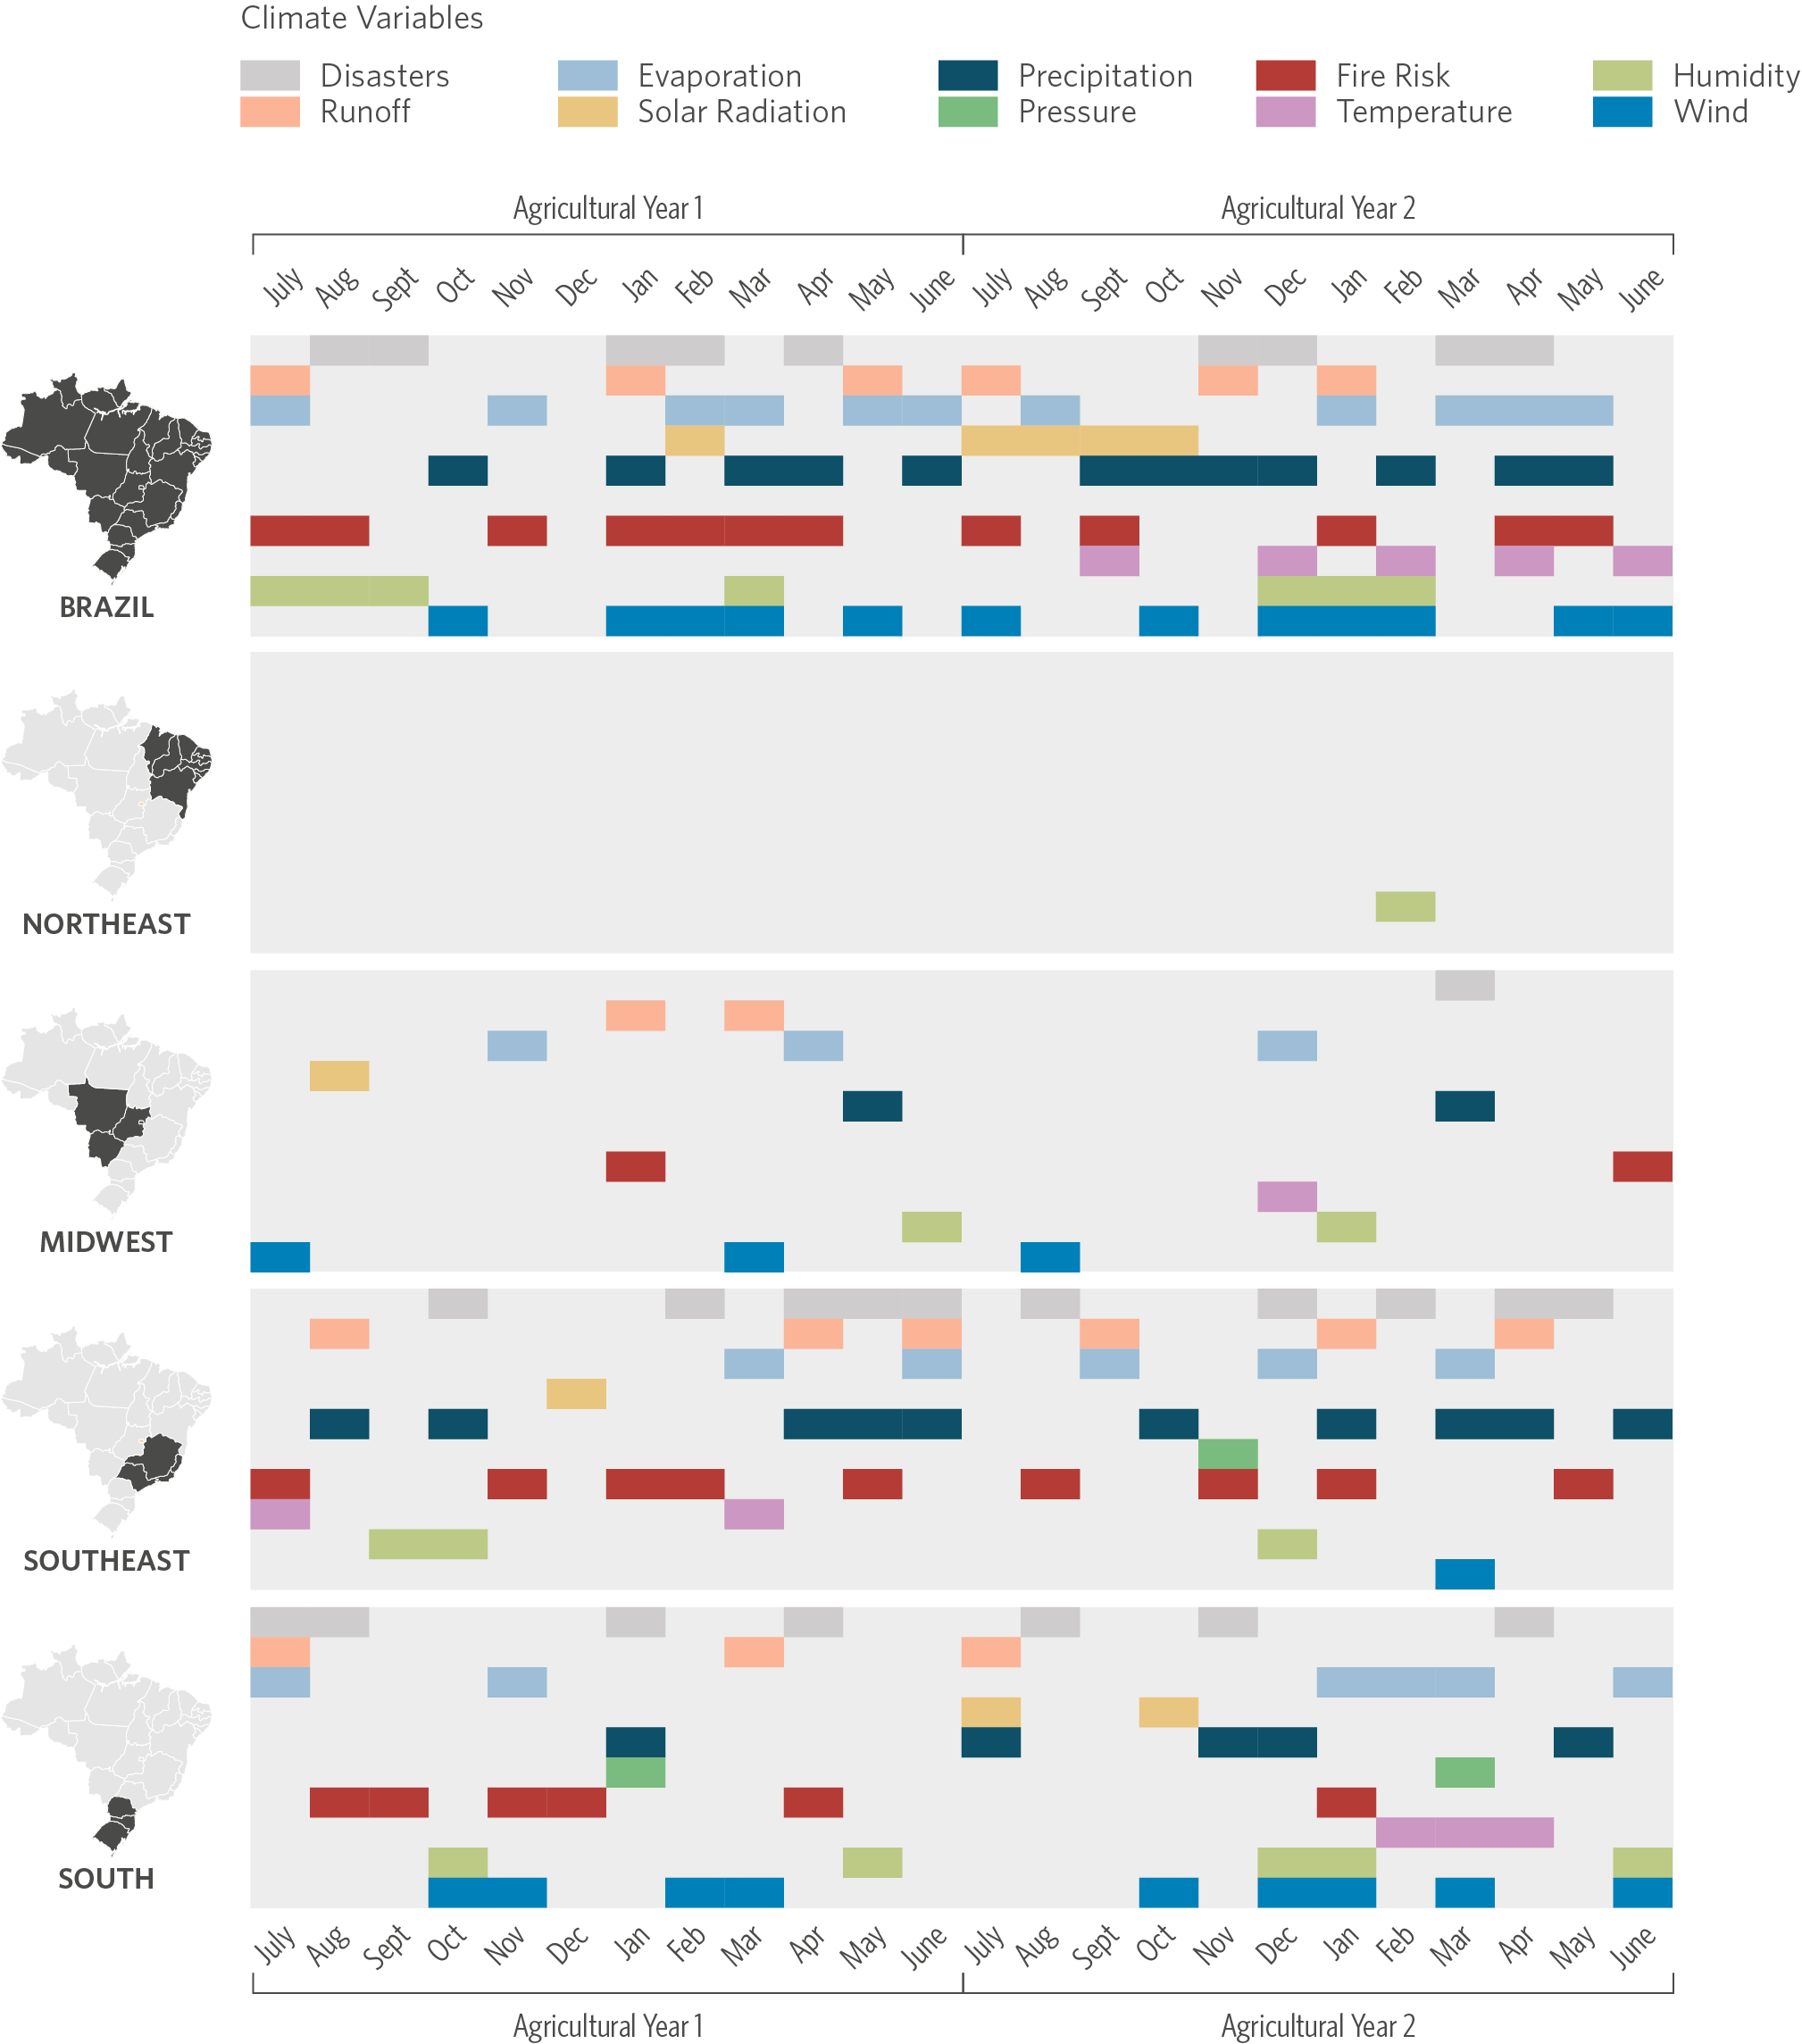
To evaluate the predictive capacity of agricultural losses without relying on information about insurance, we replaced the model’s explained variable with the average soybean yield reported in PAM/IBGE. This variable is the ratio between the amount of soybean produced (in kilograms) and the harvested area (in hectares). Naturally, generalized losses due to climatic events negatively affect this variable regardless of the presence or absence of rural insurance. Similarly to the models reported earlier, the results are presented in Figure 5.
Figure 5. Climate Variables Selected by the LASSO Model by Month and Agricultural Year
Source: CPI/PUC-Rio with data from PAM/IBGE, Era5, Era5-Land, CHIRPS, INPE, Embrapa, S2iD, 2023
In this case, the model in Figure 5 can use much information from climate variables to predict what happens to the average soybean yield. The model selects variables in virtually all groups and months, except for atmospheric pressure variables, which appear less frequently. Similar to the previous models that sought to explain the behavior of insurance variables, this new model also selects many variables in the Southern region. However, in contrast to the other models, a large set of climate variables can explain the average soybean yield in the Northeast region. When analyzed in association with the statistics presented in Table 2, this result suggests that the Northeast region presents significant climatic variations that eventually generate widespread losses in soybean production and increases in the volume of claim payments. The low concentration of insurance policies in the region creates obstacles to predicting the probability of losses due to climatic events. This suggests that there is room to increase the presence of insurance in the area, but the high risk may be an obstacle to greater supply by insurers. In the case of the Northern region, the model selects fewer variables, partly due to the region’s low representation in national soybean production.
Policy Recommendations
Brazilian rural producers face increasing risks to production due to climate change. Although rural insurance coverage has expanded recently, it is still limited, leaving many producers vulnerable to agricultural losses. The increase in such losses, exacerbated by the intensification and greater frequency of climate events, can lead to a retreat of the rural insurance market in the country and an increase in policy premiums, further aggravating the situation.
This policy brief addresses the challenge insurers face in predicting losses and the occurrence of claims in Brazilian regions. Due to its relevance in the Brazilian scenario and being a highly insured crop, soybean was used as a case study in machine learning models to identify which climate variables are most relevant in explaining claims and agricultural losses in the country between 2006 and 2018. It is important to note that although the focus of this publication is soybean, the same work could be replicated for other crops. This exercise aimed to better understand the difficulties of expanding insurance to poorly insured regions.
Models using insurance data had performance issues in the North and Northeast regions and worked well for the South, Southeast, and Midwest regions. The exercise was repeated using soybean average yield data to understand if the performance issue was due to the low availability of data or the intrinsic difficulty of predicting losses in those regions. The model with average yield data presented similar results to previous models regarding selected variables and performance but was more effective in the Northeast and North regions.
The results demonstrate that, although relevant unobservable components exist to explain agricultural losses, the analyzed data provides important explanations for such losses, constituting substantial knowledge for public policy design. Given the new climate reality that is imposed, insurers should adopt more elaborate models for predicting losses. It is possible to use existing information better, expanding the data set used to estimate losses. Production history can help expand insurance coverage to areas with little insurance, for which the claims history is limited.
It should be noted that the recent expansion of soybean production has occurred in regions with still limited presence of rural insurance, such as MATOPIBA, whose importance in national soybean production is growing. This region, as well as a large part of the state of São Paulo, the western region of Santa Catarina, and the north of Rio Grande do Sul, has high production variability, representing a greater risk for insurers, hindering the expansion of the market in these regions. The risk management instruments market needs to expand to these riskier regions and ensure the protection of rural producers, especially in the face of the intensification trend of climate events.
In this sense, implementing public policies that encourage the expansion of rural insurance in these regions is crucial to protect producers and promote sustainable agricultural development. The government must create incentives for expanding rural insurance, investing in policies such as the PSR, reducing the cost of purchasing policies, improving the ZARC, and strengthening the reinsurance market in Brazil. In a scenario of higher aggregate risk, reinsurers become increasingly important. Despite the growth of the reinsurance market in Brazil in the recent period, it is still very concentrated in a few companies. Finally, these government incentives must be directed towards a sustainable agriculture model, benefiting producers with sustainable agricultural practices, low carbon emissions, and zero deforestation.
Annex I: About the Model
Variables Used in the Model
Table 3 shows the variables used for modeling, and their definitions, based on the pre-selection performed by means of a principal component analysis.[22] It is worth noting that all climate variables generated for the panel and described in the data section below were used for the principal component analysis. Therefore, Table 3 only displays the final variables used as input for the models.
Table 3. Glossary of Model Variables
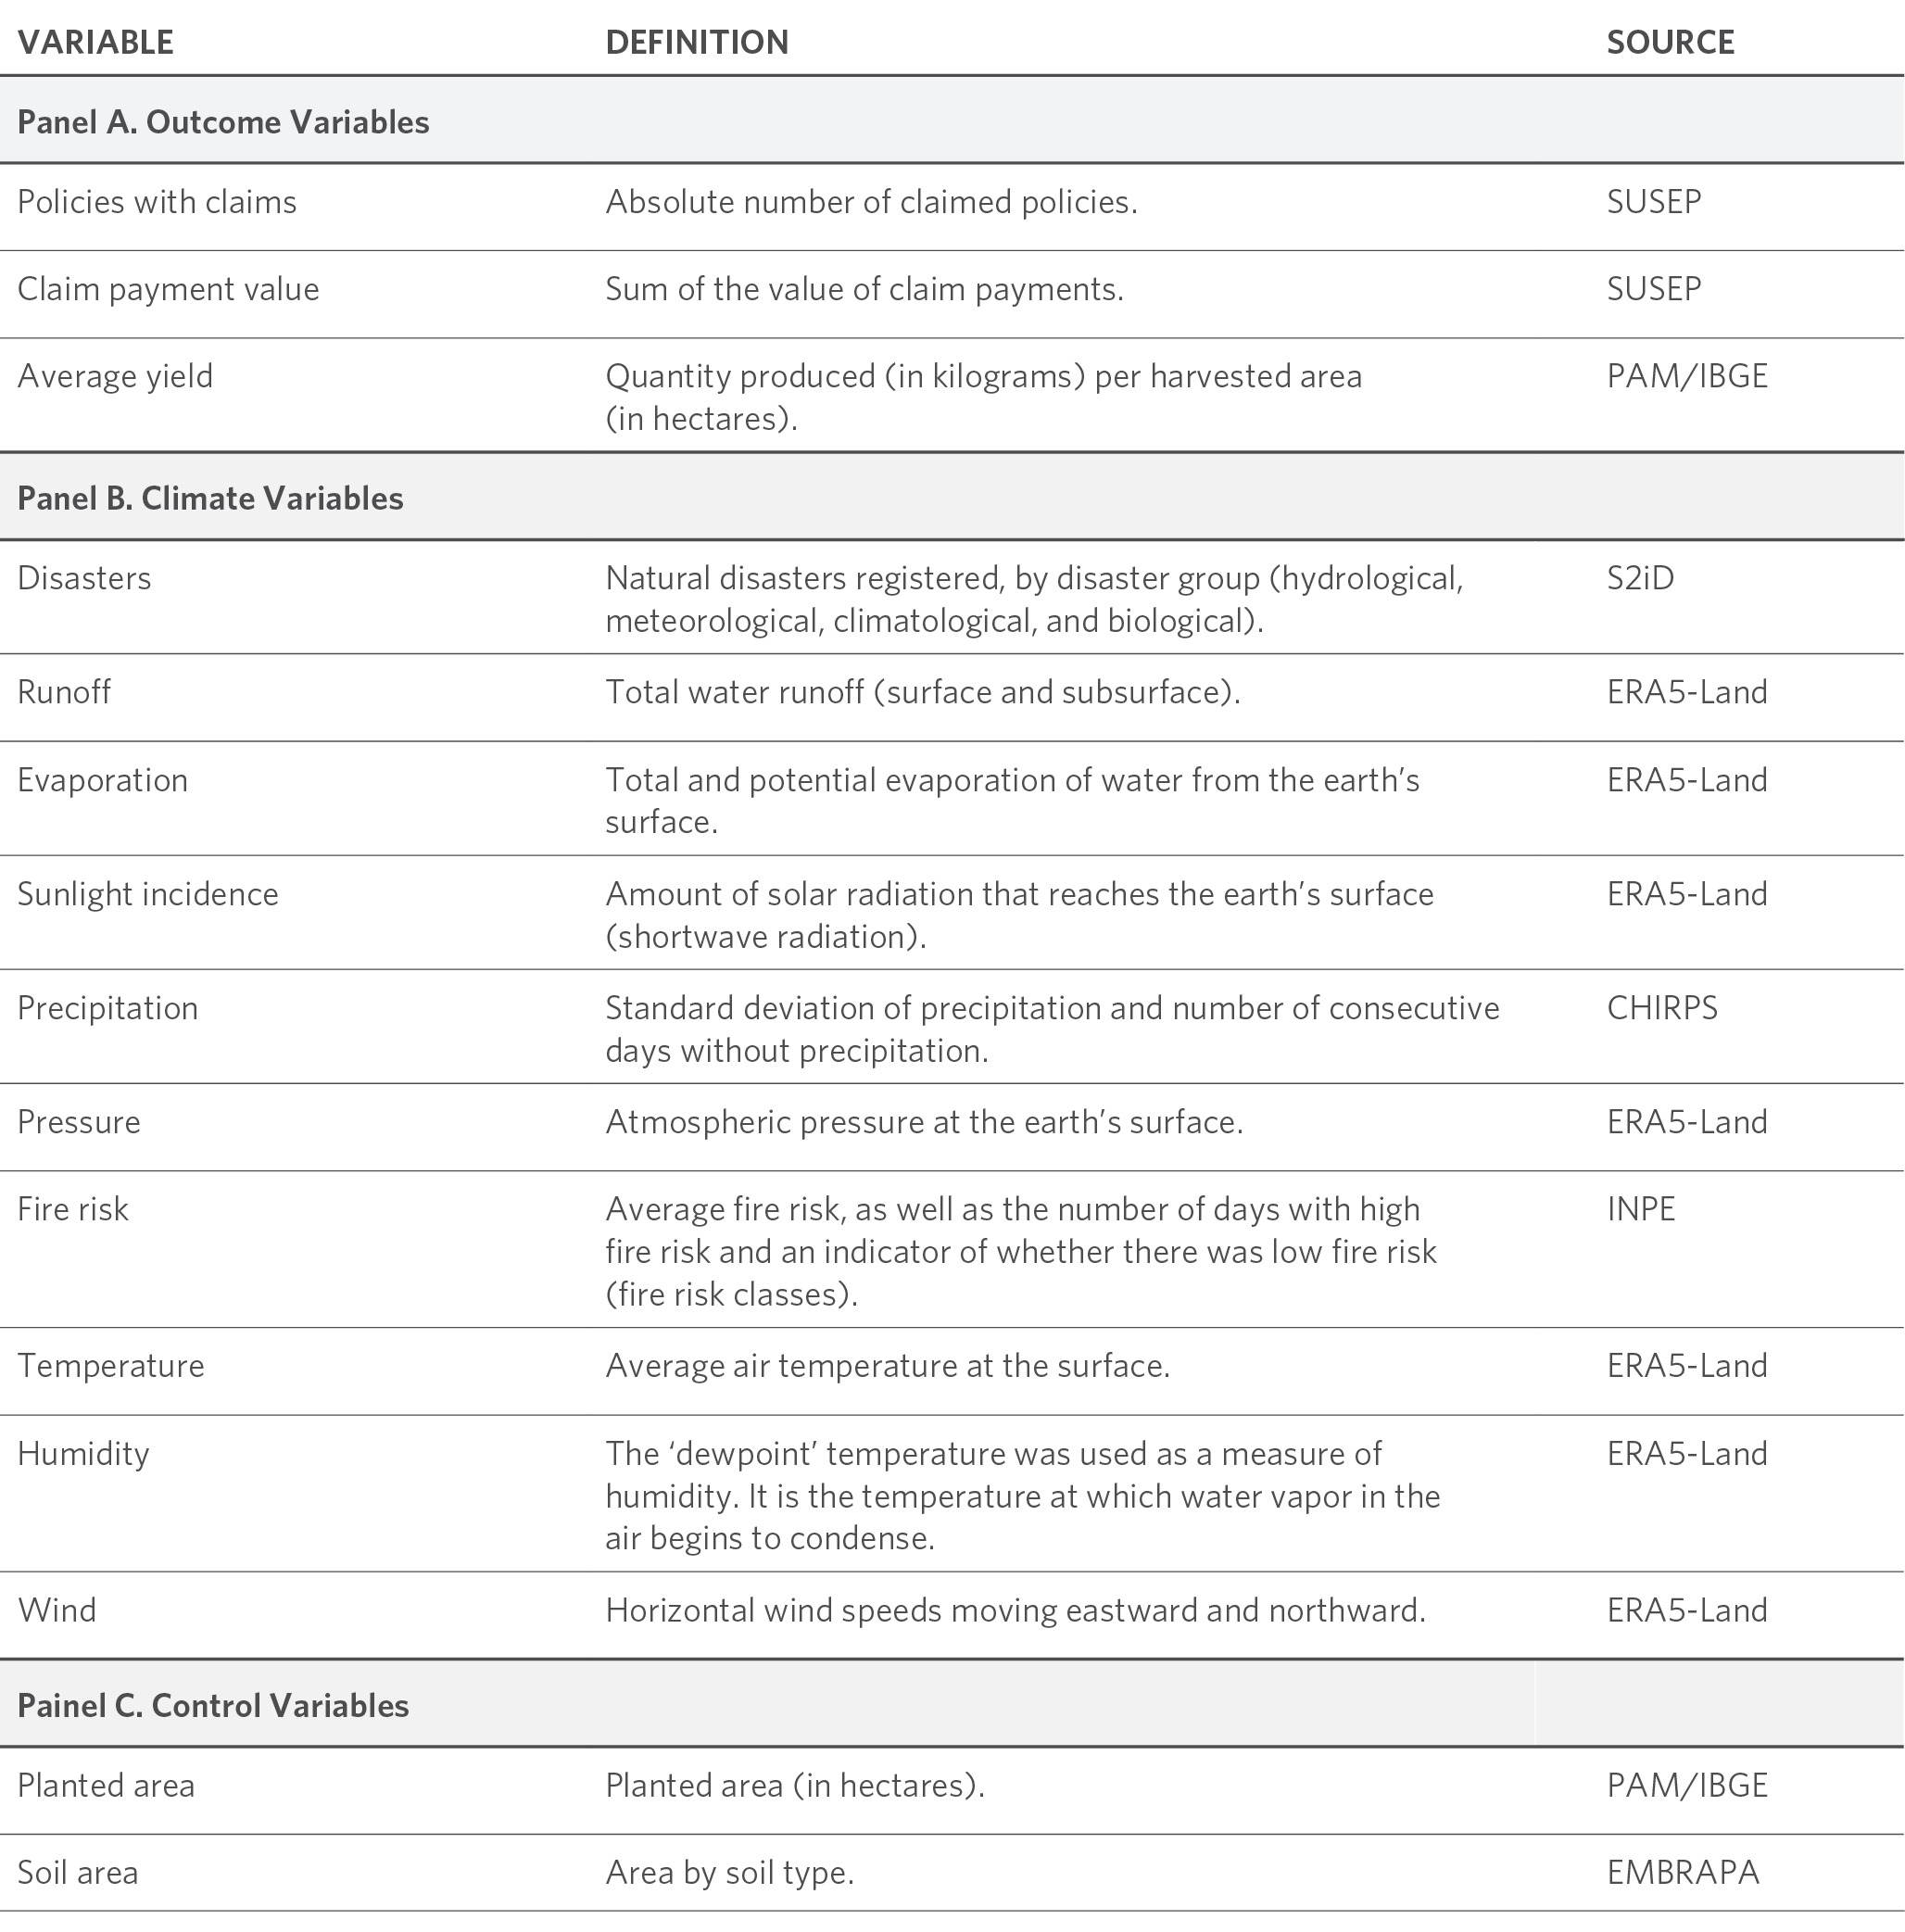
Source: CPI/PUC-Rio, 2023
Data
To conduct the analysis, the researchers built an annual municipal panel comprising climatic, rural insurance, and agricultural production data covering 5,476 municipalities[23] between 2006 and 2018.
The Superintendence for Private Insurance (Superintendência de Seguros Privados – SUSEP) publishes rural insurance data. For each year, SUSEP provides a database for policies and another for claims based on records reported by insurance companies, covering information from July 1st of the previous year to June 30th of the current year, which corresponds to the agricultural year. Based on the treatment of this data, an annual panel of policies and claims was constructed by matching the records of the two databases using an identifying key provided by SUSEP. The treated database contains information such as the number of policies issued and claimed, the value of premiums paid, and the value of claim payments. Only crop insurance for soybean farming was considered.
Regarding crop production, the PAM survey of the Brazilian Institute of Geography and Statistics (Instituto Brasileiro de Geografia e Estatística – IBGE) presents annual data on temporary and permanent crops in the country by municipality and type of crop.[24] The study incorporates variables such as planted and harvested area (in hectares), production value (in Brazilian reais), and average yield – quantity produced per harvested area (kilograms per hectare).
Most climate variables are obtained through reanalysis data, which are produced by climate models based on various sources, including satellite data and ground stations. This information is provided in satellite images segmented into squares with equal areas, called pixels. The pixel data were aggregated at the municipal level by calculating the weighted average of the variable of interest by the area the pixel represented within the municipality’s administrative boundaries. All variables were aggregated into monthly measures for the period of study.
Information on average temperature, evaporation, runoff, solar radiation, and wind speed is obtained from ERA5-Land Monthly Averaged.[25] This information is originally provided in 11 km2 pixels. On the other hand, ERA5 Monthly Aggregates[26] provides similar data but with larger pixels of 27.8 km2, complementing the data with information on maximum and minimum temperatures.[27] Information on total and maximum precipitation, days without precipitation, and consecutive dry days (dry period) was obtained through Climate Hazards Group InfraRed Precipitation with Station Data (CHIRPS)[28] in 5.5 km2 pixels.
The panel also uses information on fire risk produced by the National Institute for Space Research (Instituto Nacional de Pesquisas Espaciais – INPE). Fire risk[29] measures the susceptibility of vegetation to burning from a meteorological point of view. The data is originally available in 30m2 pixels in daily measures, which were aggregated into monthly measures, such as average risk, maximum and minimum values recorded in the month, and the number of days in which the municipality remained in each fire risk category (minimum, low, high, or critical).
Disaster records were obtained through the Integrated System of Information on Disasters (Sistema Integrado de Informações sobre Desastres – S2iD)[30] of the Ministry of Integration and Regional Development (Ministério da Integração e Desenvolvimento Regional). Formally, these records are Emergency Situations (Situações de Emergência – SE) and State of Public Calamity (Estado de Calamidade Pública – ECP) recognitions. Only disasters related to climate events were selected, including floods, windstorms, droughts, and frosts, as well as some events of biological and anthropogenic nature, such as fires, pests, and plagues.
Finally, the study used the soil map of Brazil generated by the Brazilian Agricultural Research Corporation (Empresa Brasileira de Pesquisa Agropecuária – EMBRAPA)[31] for the year 2020. The data were incorporated from vector maps with soil classification, from which it is possible to calculate the area in hectares occupied by each soil class per municipality.
Methodology
The data was collected and systematized as a panel of municipalities observed during years when these municipalities had rural insurance contracts spanning from 2006 to 2018. Fifty-seven monthly climate indicators were used, reflecting characteristics of temperature, precipitation, evaporation, humidity, atmospheric pressure, solar radiation, water runoff, wind speed, disaster records, and fire risk indicators. For each of these indicators, variables were created with their monthly values. For example, in the case of the average temperature, variables for the average temperature in January, February, and so on are created.
In addition, in each period of a calendar year, the model incorporates the monthly indicators for that year, the second half of the previous year, and the first half of the following year, equivalent to two consecutive agricultural years. For each calendar year of the model, policies may start in the first half (the agricultural year started in the previous year) or in the second half (the period in which the current agricultural year begins). Since claims occur with some lag relative to the start of the policy’s validity, the model includes climatic effects that can influence the occurrence of a claim throughout the current agricultural year andcaptures possible cumulative effects resulting from climatic events that occurred before the policy’s validity began.
To understand the relationship between climate variations and the occurrence of losses in rural insurance contracts, the CPI/PUC-Rio researchers used an econometric approach appropriate for contexts where:
- The objective is to identify which indicators within a potentially large set of variables are relevant to explain the behavior of an outcome. In this case, there is an interest in understanding which climate characteristics may be more relevant to explain losses reported in agricultural production and rural insurance contracts, and in which months this explanatory power may be greater;
- The number of variables is large, potentially greater than the number of available observations. In the case of this study, the complete panel of municipalities has around 15,000 observations. When restricted by region, the number of observations can be much smaller, in the thousands or even hundreds in some cases. The number of climate variables is given by the 57 indicators observed in each month of the current year plus the previous year’s second half and the following year’s first half. Hence, the model features all indicators at 24 time points, amounting to around 1,400 variables.
The method used was the Least Absolute Shrinkage and Selection Operator (LASSO), widely adopted in prediction and machine learning models. Like linear regression, this method seeks to generate a good prediction of the behavior of an indicator Y from a set of variables X. The main difference is that this method selects the most important variables by applying a penalty parameter[32] that forces coefficients related to less relevant variables to equal zero so that some variables are not included in the final model, making the model’s interpretation more straightforward and generating, in several cases, better predictions than linear regressions.
This method is particularly useful in cases with a high correlation between potentially selected variables, which is true for climate indicators. However, when two or more indicators are highly correlated, the model selects one of them almost randomly, making it hard to interpret the results. To minimize this problem, a subset of representative variables from each group was pre-selected based on a principal component analysis.[33]
The researchers first estimated a baseline model to evaluate the performance of these LASSO models and understand how the inclusion of pre-selected climate variables improves the model’s capacity to explain the behavior of claims in rural insurance contracts. This baseline model is a linear regression with fixed effects, excluding climate variables, estimated by Ordinary Least Squares (OLS). Fixed effects capture all municipality-specific factors that do not vary over time and all annual aggregate shocks that do not affect municipalities differently. Hence, the remaining variation to be explained is necessarily given by the observed difference for the same municipality over time. In addition, we included interactions with the planted area and the predominant soil types in the municipality to isolate factors that do not relate to climate variations but only to the intensity of crop cultivation in each location and to different geographical characteristics that may have their own trends over time.
Next, we ran the LASSO with the same fixed effects but now including climate variables. To recover the coefficients of each variable, we ran a linear regression only with the variables selected by the model. From this regression, we can recover a measure of the model’s fit quality—the R2 or coefficient of determination of a regression—and compare it to the baseline model (OLS). If it is higher, this implies that the selected climate variables add explanatory power to understand differentials in recording rural insurance losses in municipalities over time. Additionally, we can generate a prediction of the variables related to rural insurance in both models and calculate the Mean Squared Error (MSE), a measure of the model’s prediction quality. Again, if the model with the selected climate variables has a lower MSE than the baseline, there is also evidence that these variables add explanatory power.
Finally, when studying the presence or absence of claims in a certain location, the number of policies in that location is relevant.[34] Therefore, all models seeking to explain insurance-related variables are weighted by the number of rural insurance policies for soybean farming in each municipality and year. Similarly, when the explained variable is a crop production aspect unrelated to rural insurance (as with the average yield), the model is weighted by the soybean harvested area in each municipality and year.
Table 4 summarizes the results of the models for soybeans in Brazil and the five regions considering the three variables presented in this study: the number of claimed policies, the value of claim payments, and the average yield. Notably, the number of observations for the average yield model is greater, given that some municipalities grow soybeans without insurance policies. In addition, the number of variables this model selects is generally higher than the others, suggesting that climate variation better explains the occurrence of losses as more data on these losses are available. Although models usually select more variables in the Southern region, the predictability of the insurance models (measured by the mean squared error) is not necessarily better for this region, which may reflect the high climatic variability in this location.
Table 4. Summary of LASSO Model Results
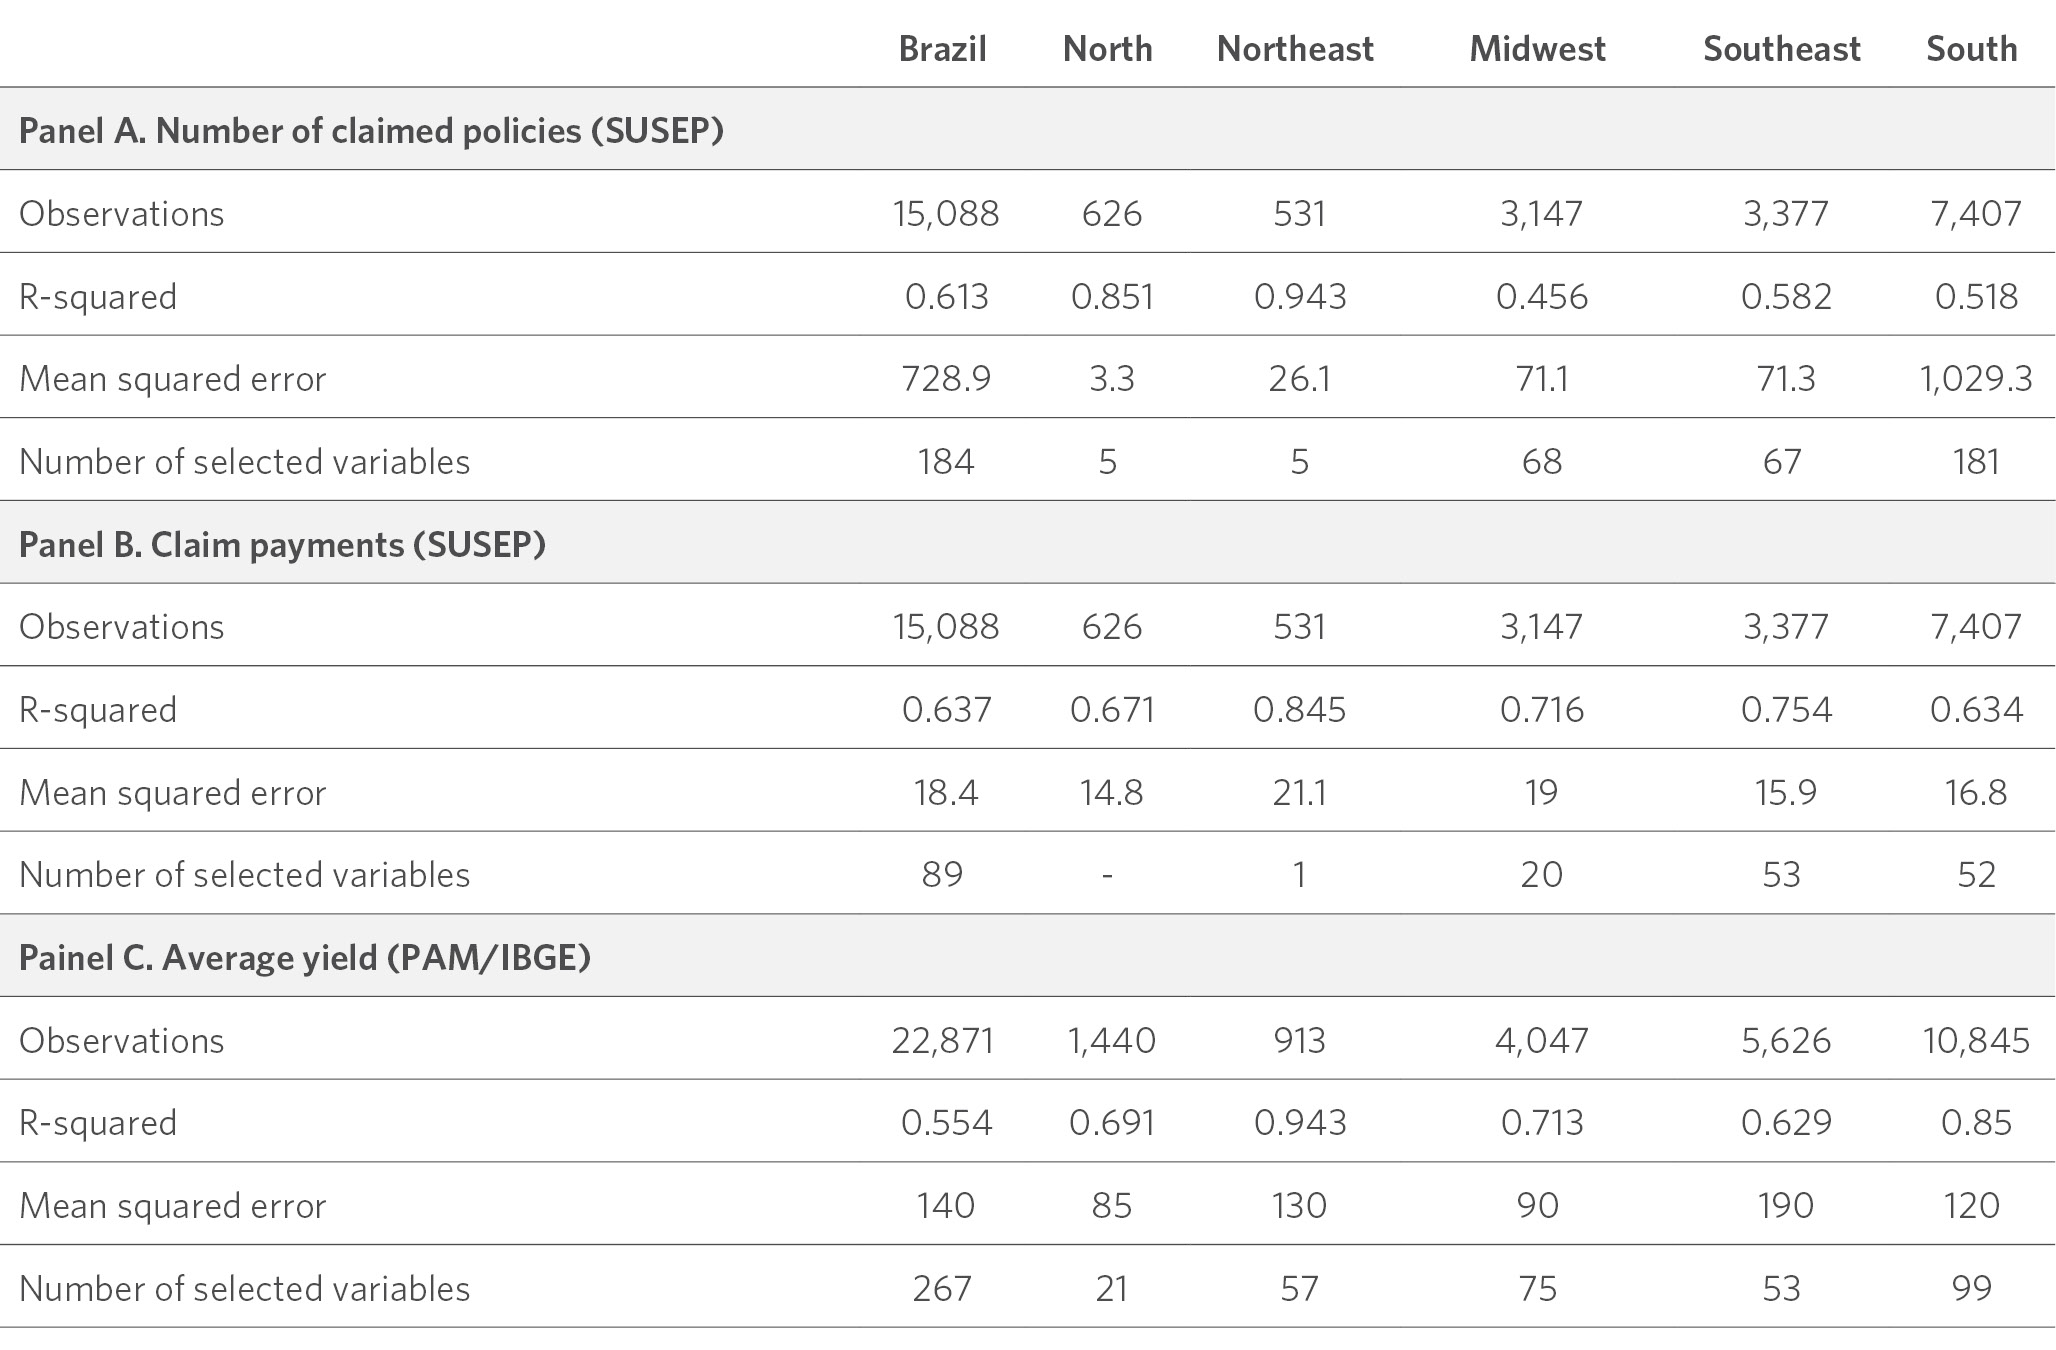
Source: CPI/PUC-Rio with data from SUSEP, PAM/IBGE, Era5, Era5-Land, CHIRPS, INPE, Embrapa, and S2iD, 2023
The authors would like to thank Leila Harfuch (Agroicone), Gustavo Lobo (Agroicone), Daniel Nascimento (Brasilseg/Fenseg), Joaquim Neto (Tokiomarine/Fenseg), Relze Fernandes (Tokiomarine), Sarah Dias (Tokiomarine), Bruno Speria (Tokiomarine), Artur Oliveira (Tokiomarine), Eduardo Monteiro (Embrapa), Ary Fortes (Embrapa), Daniel Victoria (Embrapa) and Santiago Cuadra (Embrapa) for their valuable discussions. The authors also thank Beatriz Baptista for research assistance, and to Juliano Assunção, Natalie Hoover El Rashidy, Giovanna de Miranda and Camila Calado for the editing and revision of the text. The authors would also like to thank Julia Berry and Meyrele Nascimento for formatting and graphic design.
[1] Constant US dollars at 2014-2016 prices. FAOSTAT. Production, crop and livestock products, value of agricultural production. Access date: February 24, 2023. bit.ly/3LdV4pq.
[2] A study by the Ministry of Agriculture and Livestock (Ministério da Agricultura e Pecuária – MAPA), published in 2022, analyzes the history of losses in Brazilian agriculture (2000-2021). Ministério da Agricultura e Pecuária (MAPA). Histórico de perdas na agricultura brasileira 2000-2021. 2022. bit.ly/3LghCpE.
[3] The study uses data from 2018 to allow for comparisons with rural insurance data from SUSEP, which are only available up to that year.
[4] CPI/PUC-Rio published a policy brief to analyze in greater detail two government risk management initiatives in agriculture: the Agricultural Activity Guarantee Program (Programa de Garantia da Atividade Agropecuária – PROAGRO) and the Rural Insurance Premium Subsidy Program (Programa de Subvenção ao Prêmio do Seguro Rural – PSR). Souza, Priscila, Leila Pereira, and Mariana Stussi. Revealing Incentives: Implications of Rural Insurance Policy Design in Brazil. Rio de Janeiro: Climate Policy Initiative, 2022. bit.ly/3LfkLG.
[5] Souza, Priscila and Juliano Assunção. Risk Management in Brazilian Agriculture: Instruments, Public Policies, and Perspectives. bit.ly/3J7sFyL.
[6] Reference years for the modeling results presented in the section “Climate Risk and Crop Losses”.
[7] The difference between the distribution of policies and premiums is also due to the difference in the average size of properties in each region, as shown in Table 1. Properties tend to be smaller in the South and Southeast regions and larger in the others.
[8] Values at December 2022 prices. Inflation adjusted by the Extended National Consumer Price Index (Índice de Preços ao Consumidor Amplo – IPCA).
[9] SUSEP. SES – Sistema de Estatísticas da SUSEP. Access date: February 08, 2023. bit.ly/3mJzeQE.
[10] These categories are eligible to receive a subsidy from part of the premium disbursed to insurance companies through the PSR, operated by MAPA.
[11] Souza, Priscila, Leila Pereira, and Mariana Stussi. Revealing Incentives: Implications of the Design of Public Rural Insurance Policies in Brazil. Rio de Janeiro: Climate Policy Initiative, 2022. bit.ly/420bs2N.
[12] Considering only insurance contracts covering crops, aquaculture, cattle, and forestry.
[13] Seneviratne, Sonia, et al. “Weather and Climate Extreme Events in a Changing Climate” In Climate Change 2021: The Physical Science Basis. Contribution of Working Group I to the Sixth Assessment Report of the Intergovernmental Panel on Climate Change. Cambridge, United Kingdom: Cambridge University Press, 2021. bit.ly/3yz9Wag.
[14] Masson-Delmotte, Valérie, et al. Global Warming of 1.5°C: Summary for Policymakers. Intergovernmental Panel on Climate Change Report. bit.ly/3ZHap6y.
[15] The query “Insurance: Premiums and Claims” was used, and the columns “Earned Premium” and “Claims Incurred” were selected, which are used to calculate claims rates. SUSEP SES. Sistema de Estatísticas da SUSEP. Access date: March 10, 2023. bit.ly/3mJzeQE.
[16] The “Reinsurance: Earned Premiums” query was used and the “Reinsurance Premiums” column was selected. SUSEP SES. Sistema de Estatísticas da SUSEP. Access date: March 10, 2023. bit.ly/3mJzeQE.
[17] LASSO is an operator that selects variables from a regularization (or penalization) problem, which is done by minimizing absolute values.
[18] As it is a monetary variable, we applied the inverse hyperbolic sine transformation (ihs) to reduce the dispersion of the variable while keeping the zeros in the database. This is a standard procedure for dealing with variables that have this behavior.
[19] The agricultural year is the period that ranges from July of a calendar year to June of the following year. For example: the 2015/16 agricultural year starts on July 01, 2015, and ends in June 30, 2016.
[20] Ministério da Agricultura e da Pecuária (MAPA). Histórico de Perdas na Agricultura Brasileira, 2000-2021. 2022. bit.ly/3LghCpE.
[21] Companhia Nacional de Abastecimento (CONAB). Calendário de Plantio e Colheita de Grãos no Brasil. 2019. bit.ly/3ZEmppk.
[22] For more information on variable preselection and the principal component analysis, please refer to the Methodology section in the Annex.
[23] Due to changes in municipality boundaries and areas over the period of study, they were aggregated into minimum comparable areas (Áreas Mínimas Comparáveis – AMCs) to enable consistent comparisons over time. The joint geographic area of the AMCs remains constant throughout the period of study, which covers the sub-period between the Demographic Censuses of 2000 and 2010. The areas corresponding to municipalities created after 2010 were included in the polygon of the original municipality’s AMC. For simplicity, AMCs are referred to as “municipalities” in the text.
[24] IBGE. Pesquisa de Produção Agrícola Municipal. Access date: March 10, 2022. bit.ly/2YysF6y.
[25] ECMWF, Climate Reanalysis. ERA5-Land Monthly Averaged. Access date: December 01, 2022. bit.ly/3JxaT9m.
[26] ECMWF/Copernicus Climate Change Service. ERA5 Monthly Aggregates – Latest Climate Reanalysis. Access date: October 20, 2022. bit.ly/3mGHjW8.
[27] Both in the case of ERA5-Land and ERA5, the original pixels are very large. Therefore, they were segmented into smaller pixels of 2,783 m, from which they were re-aggregated at the municipal level.
[28] UCSB. CHIRPS Daily: Climate Hazards Group InfraRed Precipitation With Station Data (Version 2.0 Final). Access date: October 20, 2022. bit.ly/3ZBS9ex.
[29] INPE. Risco de Fogo Meteorológico. Access date: December 05, 2022. bit.ly/3YLNtBS. More information about the method for calculating fire risk and the available data can be found at this website.
[30] Ministério da Integração e do Desenvolvimento Regional. Sistema Integrado de Informações sobre Desastres (S2iD). Access date: December 2, 2022. bit.ly/3FhkU8q. The S2iD portal had a break in series in 2016. Therefore, in order to construct the complete series, data from the S2iD originating from the federal government’s open data portal (dados.gov.br) were also included. However, at the time this document was prepared, the S2iD module on the open data portal was offline.
[31] The soil map of Brazil contains the geographic distribution of soils in Brazil according to the Brazilian Soil Classification System (SiBCS, 2006). For this work, vector data was used, considering only the first categorical level of soils. Geoinfo. Mapa de solos do Brasil. Access date: March 10, 2023. bit.ly/3ZBhJR9.
[32] There are several ways to estimate this penalty parameter. In this work, we chose to run the same model for a set of 1,000 possible values of this parameter and select the model that minimizes the Extended Bayesian Information Criterion (EBIC). More information can be found at the STATA ML Page: bit.ly/3FdX2lY. Access date: February 06, 2023.
[33] The procedure is performed by extracting orthogonal components of variation from each group of variables and subsequently correlating them with the original variables. For example, a group of three variables may have a component that explains 70% of the common variation among the three indicators, and one of these variables may have a correlation of 90% with this component. Therefore, this variable can be chosen to represent the group.
[34] For example, in a municipality with only one policy, and that policy had a claim, the claim rate is 100%. Another municipality with 100 policies and 30 claims will have a claim rate of 30%. It is important that the model gives more weight to the second municipality compared to the first one, due to the higher presence of insurance policies and therefore greater exposure to the probability of claim payments due to weather events.
