Through DETER’s Lens: The Relationship between Degradation and Deforestation in the Amazon
According to the National Institute for Space Research (Instituto Nacional de Pesquisas Espaciais – INPE), an average of more than 17,000 square kilometers of Brazilian Amazon Forest were degraded per year between 2017 and 2020. This amounts to almost twice the average annual deforestation in the same period.[1] Forest degradation is characterized by the partial loss of vegetation in a given area and is therefore different from clear-cut deforestation, which is defined as the complete – or almost complete – loss of vegetation. Although degradation might seem less destructive than deforestation, it is still very damaging to the environment. Degradation undermines forest resilience, making the latter more susceptible to future damage; it interferes with the provision of ecosystem services; it contributes to loss of biodiversity; and it reduces the forest’s capacity to capture and store carbon.[2],[3],[4]
Amazon degradation deserves policymakers’ attention, both because it can have so many negative effects and because it is so widespread.[5],[6] Moreover, if degradation is found to systematically predate deforestation, the former could work as a leading indicator to the latter. In such case, efforts aimed at combating degradation could limit environmental damage at an earlier stage, thus preventing future deforestation. Hence, a robust understanding about the relationship between degradation and deforestation in the Amazon can be key to defining priorities for conservation policy.
To further the understanding of this relationship, Climate Policy Initiative/Pontifical Catholic University of Rio de Janeiro (CPI/PUC-Rio) is conducting a series of studies about forest degradation in the Amazon.[7] In the first study, researchers explored the association between degradation and deforestation using data from the DEGRAD Project, a database produced by INPE that provides annual maps of degraded areas across the entire Brazilian Amazon between 2007 and 2016.[8] This document presents the main results of an analogous analysis that explores publicly available, more recent, and more detailed data about forest loss from the Real-Time Deforestation Detection System (Sistema de Detecção de Desmatamento em Tempo Real – DETER), also produced by INPE.
The evidence reveals that, although local conversion[9] from degradation to deforestation is low, there is a significant share of deforestation that happens close to previously degraded areas. The spatial association between these events depends, however, on land tenure categories[10] and it is more frequent in medium or large private properties, rural settlements, and undesignated areas. Moreover, degradation is much more concentrated in medium or large private properties than deforestation.
The results suggest that law enforcement strategies to curb deforestation should account for both the spatial association between degradation and deforestation and its heterogenous distribution across land tenure categories. Furthermore, these new findings reinforce the importance of enhancing knowledge about the role of degradation in the process of forest loss in the Amazon, especially regarding its potential economic drivers.
Degradation in DETER
DETER is a satellite-based monitoring system that identifies, in near-real time, different types of changes in forest cover in the Brazilian Amazon, such as deforestation or degradation. When it detects these changes, it generates a georeferenced alert that delimits the affected area. These alerts are then sent to Brazilian environmental authorities, who use this information to target command and control efforts.
Launched in May 2004, the original DETER operated until 2017 issuing alerts with a minimum area of 25 hectares. In this period, there was no distinction between degradation and deforestation alerts. A new version of the system became operational in August 2015. Since then, DETER emits alerts with a minimum area of approximately three hectares and categorizes them according to different patterns of forest loss.[11] In particular, forest degradation has three sub-categories: Forest Fire Burned Area,[12] Degradation, and Selective Extraction. The first one maps areas that were burned; the second is more generic and comprises areas in which there is partial loss of forest cover; and the third identifies places showing visible evidence of logging, either legal or illegal.
For this study, DETER has some advantages with respect to DEGRAD. First, because it has been publicly available since the second half of 2016, it covers a time frame for which DEGRAD data do not exist since the latter was discontinued in 2016. Second, DETER’s sub-categories of degradation allow for a more detailed analysis. Finally, since DETER alerts are issued daily, it is possible to analyze the dynamics of degradation in time periods shorter than a whole year.
It is important to emphasize, however, that DETER is meant to support environmental control efforts and is not designed to measure deforestation and degradation in the Amazon. Hence, discrepancies are expected when comparing the total area of DETER alerts with the total deforestation measured by systems specifically designed for this, such as the Brazilian Amazon Rainforest Monitoring Program by Satellite (Programa de Monitoramento da Floresta Amazônica Brasileira por Satélite – PRODES). Despite these caveats, data produced by DETER are useful to study the dynamics of degradation in the Amazon in recent years.
Size of Degradation
Annual average degradation in the Brazilian Amazon as measured by DETER alerts amount to approximately 17,000 square kilometers between PRODES-years[13] 2017 and 2020 – almost twice the annual deforested area measured by PRODES in the same period. Accounting for more than 70% of total degraded area, Forest Fire Burned Area alerts play a fundamental role in the degradation of the Amazon Forest. Meanwhile, Degradation and Selective Extraction categories account respectively for 16% and 12% of total degraded area.
Moreover, forest degradation is primarily concentrated in the states of Pará (33% of total) and Mato Grosso (40% of total). This spatial distribution is quite different from the one observed for clear-cut deforestation measured by PRODES, in which Pará and Mato Grosso account for 40% and 18% of total deforested area in the same period. Although this is an aggregated difference, it suggests that the potential relationship between degradation and deforestation can vary substantially across different regions. Looking at more spatially disaggregated data allows for a deeper dive into this matter.
Local Conversion of Degradation into Deforestation
To investigate whether degradation is a leading indicator for deforestation, one must assess whether deforestation happens in the same areas for which a degradation alert has previously been issued. Thus, for each degraded area identified by DETER between 2017 and 2020, the analysis verifies whether there was subsequent deforestation in the exact same place – months or years later. If this happens at scale, it can be interpreted as evidence of conversion of degradation into deforestation.
Figure 1 shows the results of this analysis split by degradation sub-categories. As an example, one thousand square kilometers of Forest Fire Burned Area degradation in 2018 were converted into deforestation either in 2018 – i.e., in less than 12 months –, 2019 or 2020.
Figure 1. Degradation Area (DETER) Converted into Deforestation (PRODES) in up to 3 years
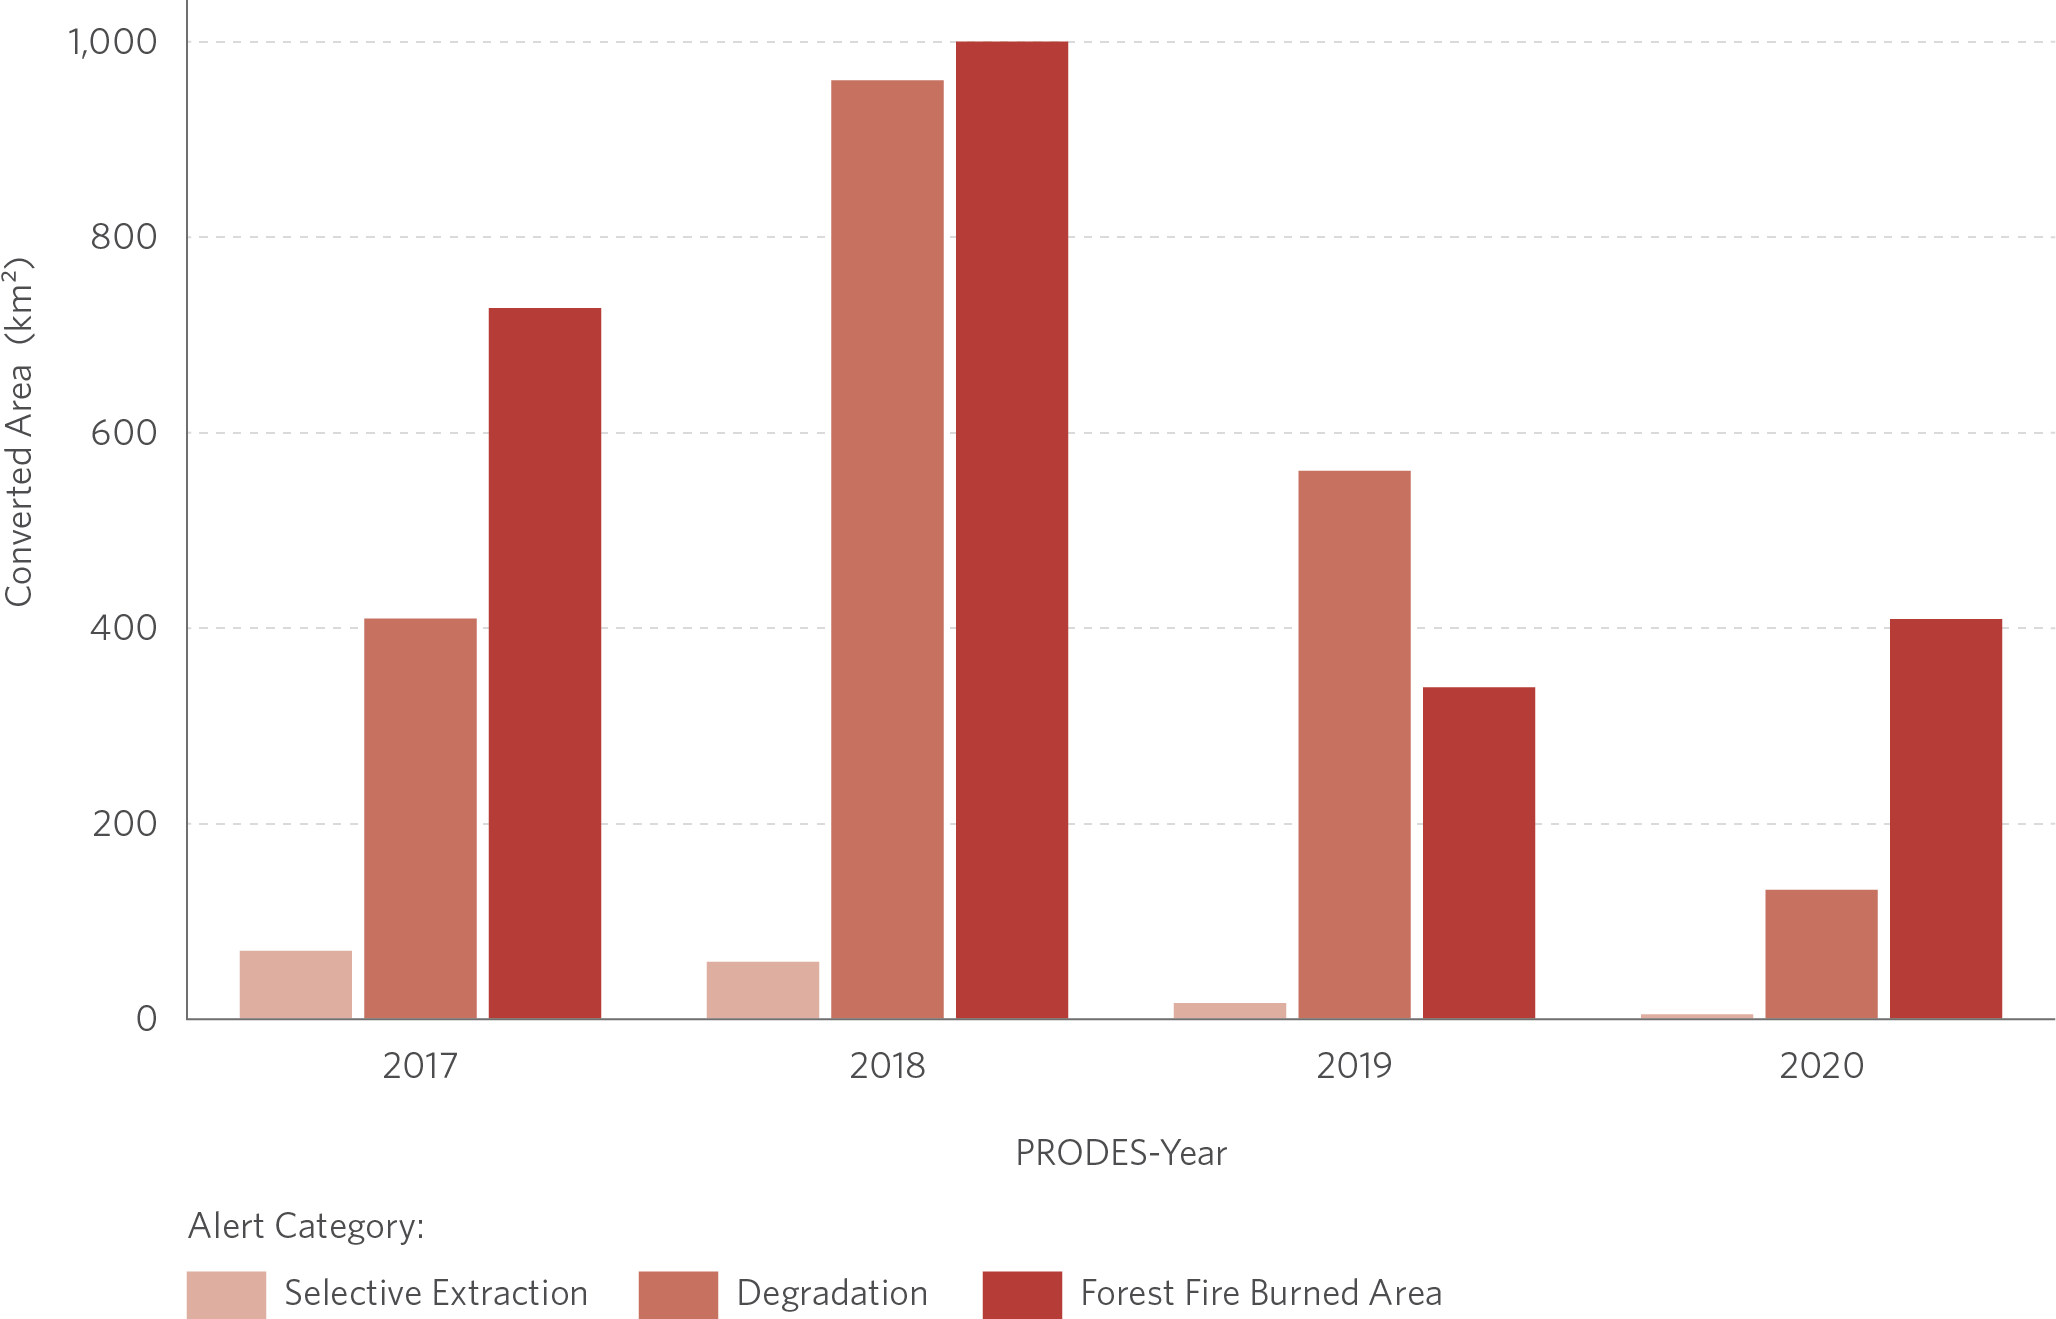
Note: PRODES-Year is the year of DETER alerts. Only considering DETER alerts happening before PRODES deforestation. Overlapping DETER alerts in year = t with PRODES deforestation in year ≥ t.
Source: CPI/PUC-Rio with data from PRODES and DETER (INPE), 2021
In absolute terms, analysis shows a substantial amount of degradation has converted to deforestation over the years. In relative terms, however, the total degraded area that eventually became deforested between 2017 and 2020 represents only 10% of total deforestation measured by PRODES in the same period. This suggests that the average conversion rate in the Amazon is low. Nonetheless, this aggregated result might be hiding interesting regional dynamics and relevant heterogeneities. Uncovering them requires an analysis of other forms of spatial association between degradation and deforestation, as well as of the specific characteristics of the areas where they occur.
Regional Association between Degradation and Deforestation
Indeed, even if degradation is not a leading indicator for deforestation in a given area, it is still possible that these phenomena happen within close proximity to one another. That is, even though deforestation does not seem to happen in places that were previously degraded, it might happen in their surrounding areas. To test whether this is true, CPI/PUC-Rio analysts investigate how much deforestation documented by PRODES occurs in areas for which DETER previously issued degradation alerts or in their immediate vicinity. Box 1 illustrates how this is calculated, and Figure 2 presents the results of this analysis.
Box 1. Deforestation in Alert Areas and Vicinities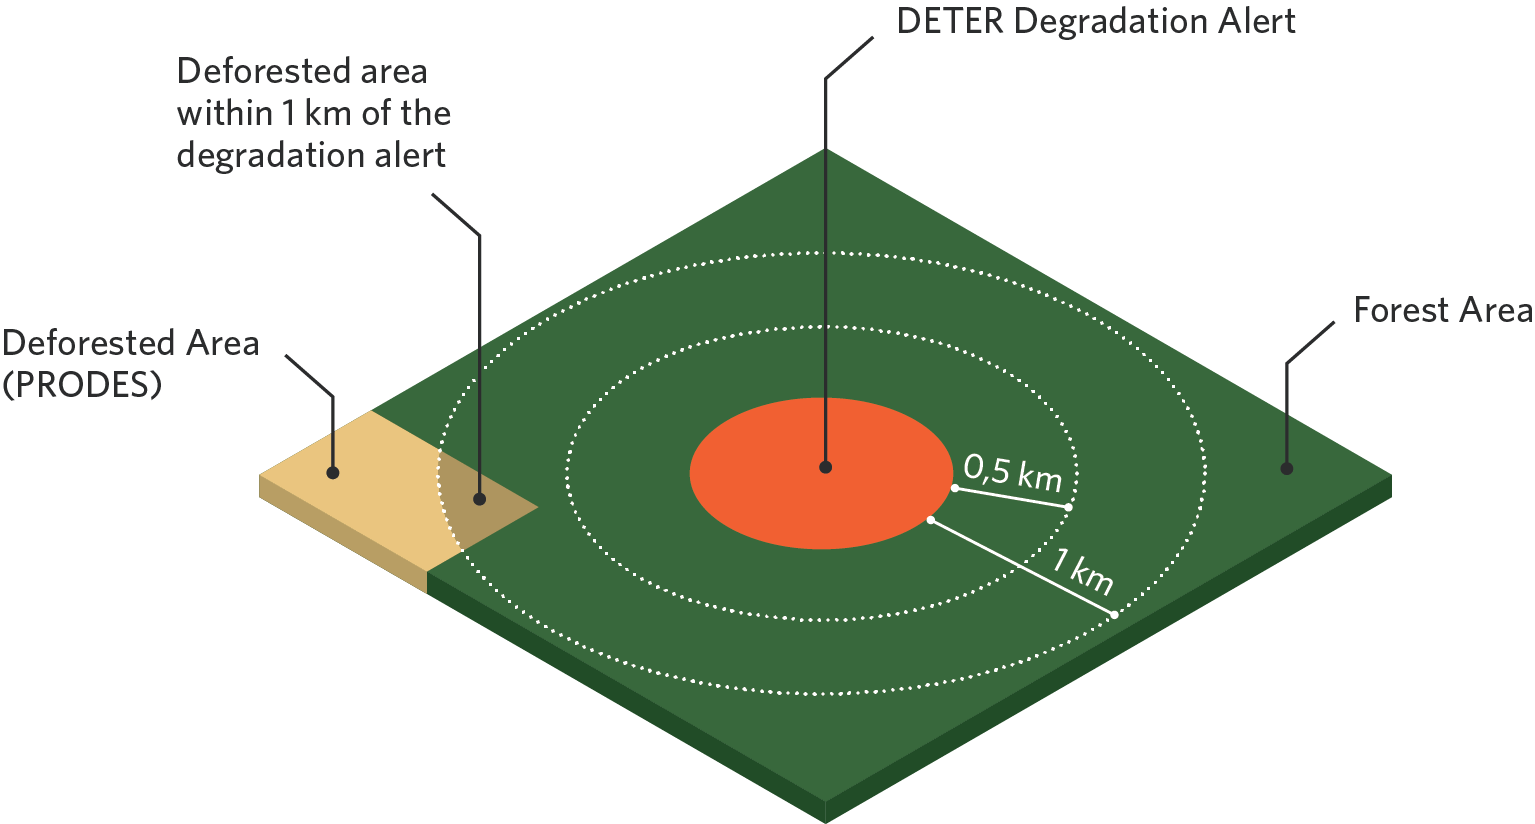
For each DETER degradation alert, this analysis calculates the deforested area located (i) inside the same area of the alert, (ii) within 0.5 kilometer of the alert area, or (iii) within 1 kilometer of the alert area.
It is therefore possible to measure the share of total deforestation that happened in the vicinity of degradation alerts.
Figure 2. Deforestation in Degradation Areas or in their Vicinity in PRODES-years 2017 to 2020
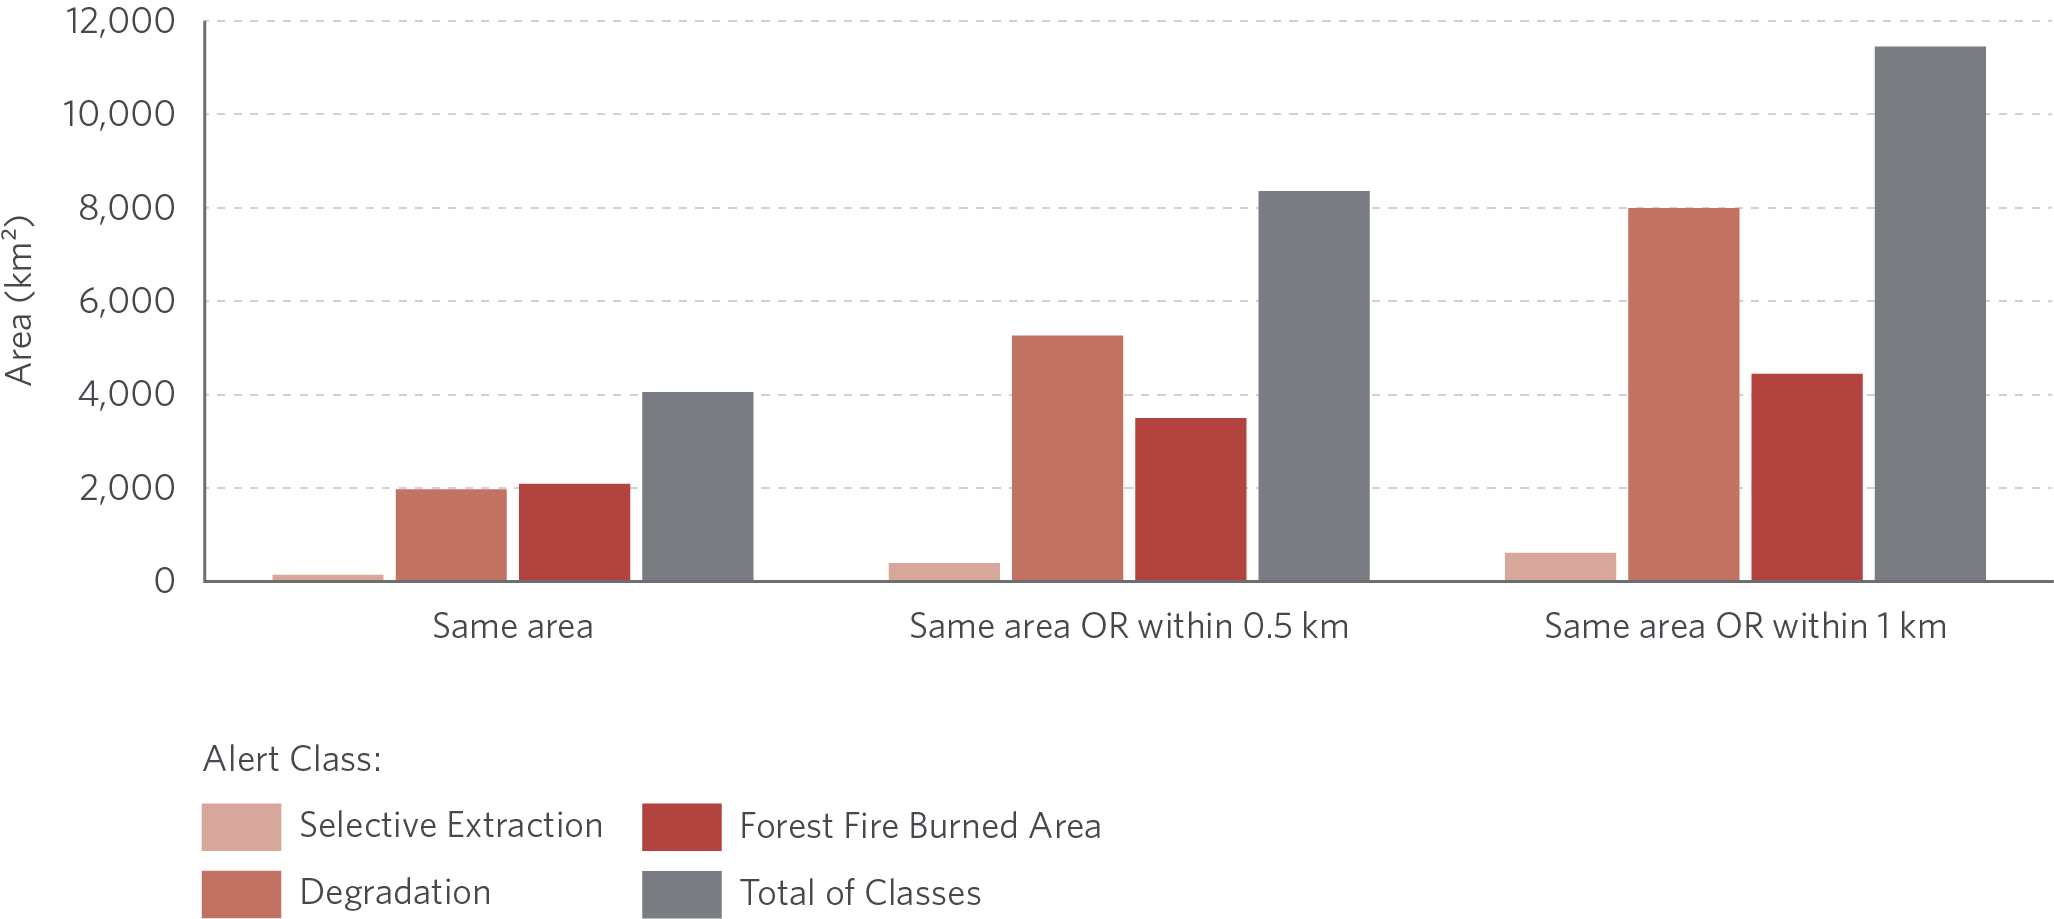
Note: Only considering DETER alerts happening before PRODES deforestation. Areas within 0.5 km and 1 km also include area of alerts. Sum of all classes of alert do not add up to “Total of Classes” because they may overlap with each other.
Source: CPI/PUC-Rio with data from PRODES and DETER (INPE), 2021
Approximately 4,000 square kilometers were affected by degradation and later deforested between 2017 and 2020. This amounts to roughly 10% of total deforestation in the same period, as mentioned before. However, when the vicinities of the alerts are taken into account, a little over 8,000 square kilometers of deforestation occurred either in the same area of previous degradation or within 0.5 kilometers. This represents 20% of total deforestation between 2017 and 2020. Similarly, 30% of total deforestation during this period happened either inside previously degraded areas or within one kilometer of them.
Finding that such a large share of deforestation happens in previously degraded areas or close to them suggests that forest degradation could serve as a leading indicator for regional damage to forests and biodiversity. Hence, it could be cost-effective to target law enforcement efforts not only where DETER is issuing degradation alerts, but also in their surroundings.
Nevertheless, it might still be quite challenging for authorities to act within 0.5 or 1 kilometer of degradation alerts. These might seem like small distances for a vast territory such as the Amazon, but many of these areas could be in remote and hard-to-access locations. It could therefore be helpful to know which areas in the vicinity of DETER degradation alerts are at greater risk of future deforestation. This study begins to investigate this by looking at how the association between degradation and deforestation varies across different land tenure categories.
Association between Degradation and Deforestation across Land Tenure Categories
Deforestation in the Amazon tends to concentrate in some land tenure categories, as portrayed in Panel A of Figure 3. From 2017 to 2020, most of the deforested area occurs inside (i) medium or large private properties; (ii) rural settlements; and (iii) undesignated areas. DETER’s degradation alerts are also highly concentrated, but the spatial pattern is quite different from the one observed for deforestation. Panel B of Figure 3 shows that medium or large private properties account for a larger fraction of degradation compared with that of deforestation. Moreover, degradation is more concentrated in protected territories than deforestation, especially in PRODES-years 2017 and 2018. Rural settlements and undesignated areas, however, show higher levels of deforestation than degradation.
Figure 3. Distribution of Annual Deforestation and Degradation by Land Tenure Categories in PRODES-years 2017 to 2020
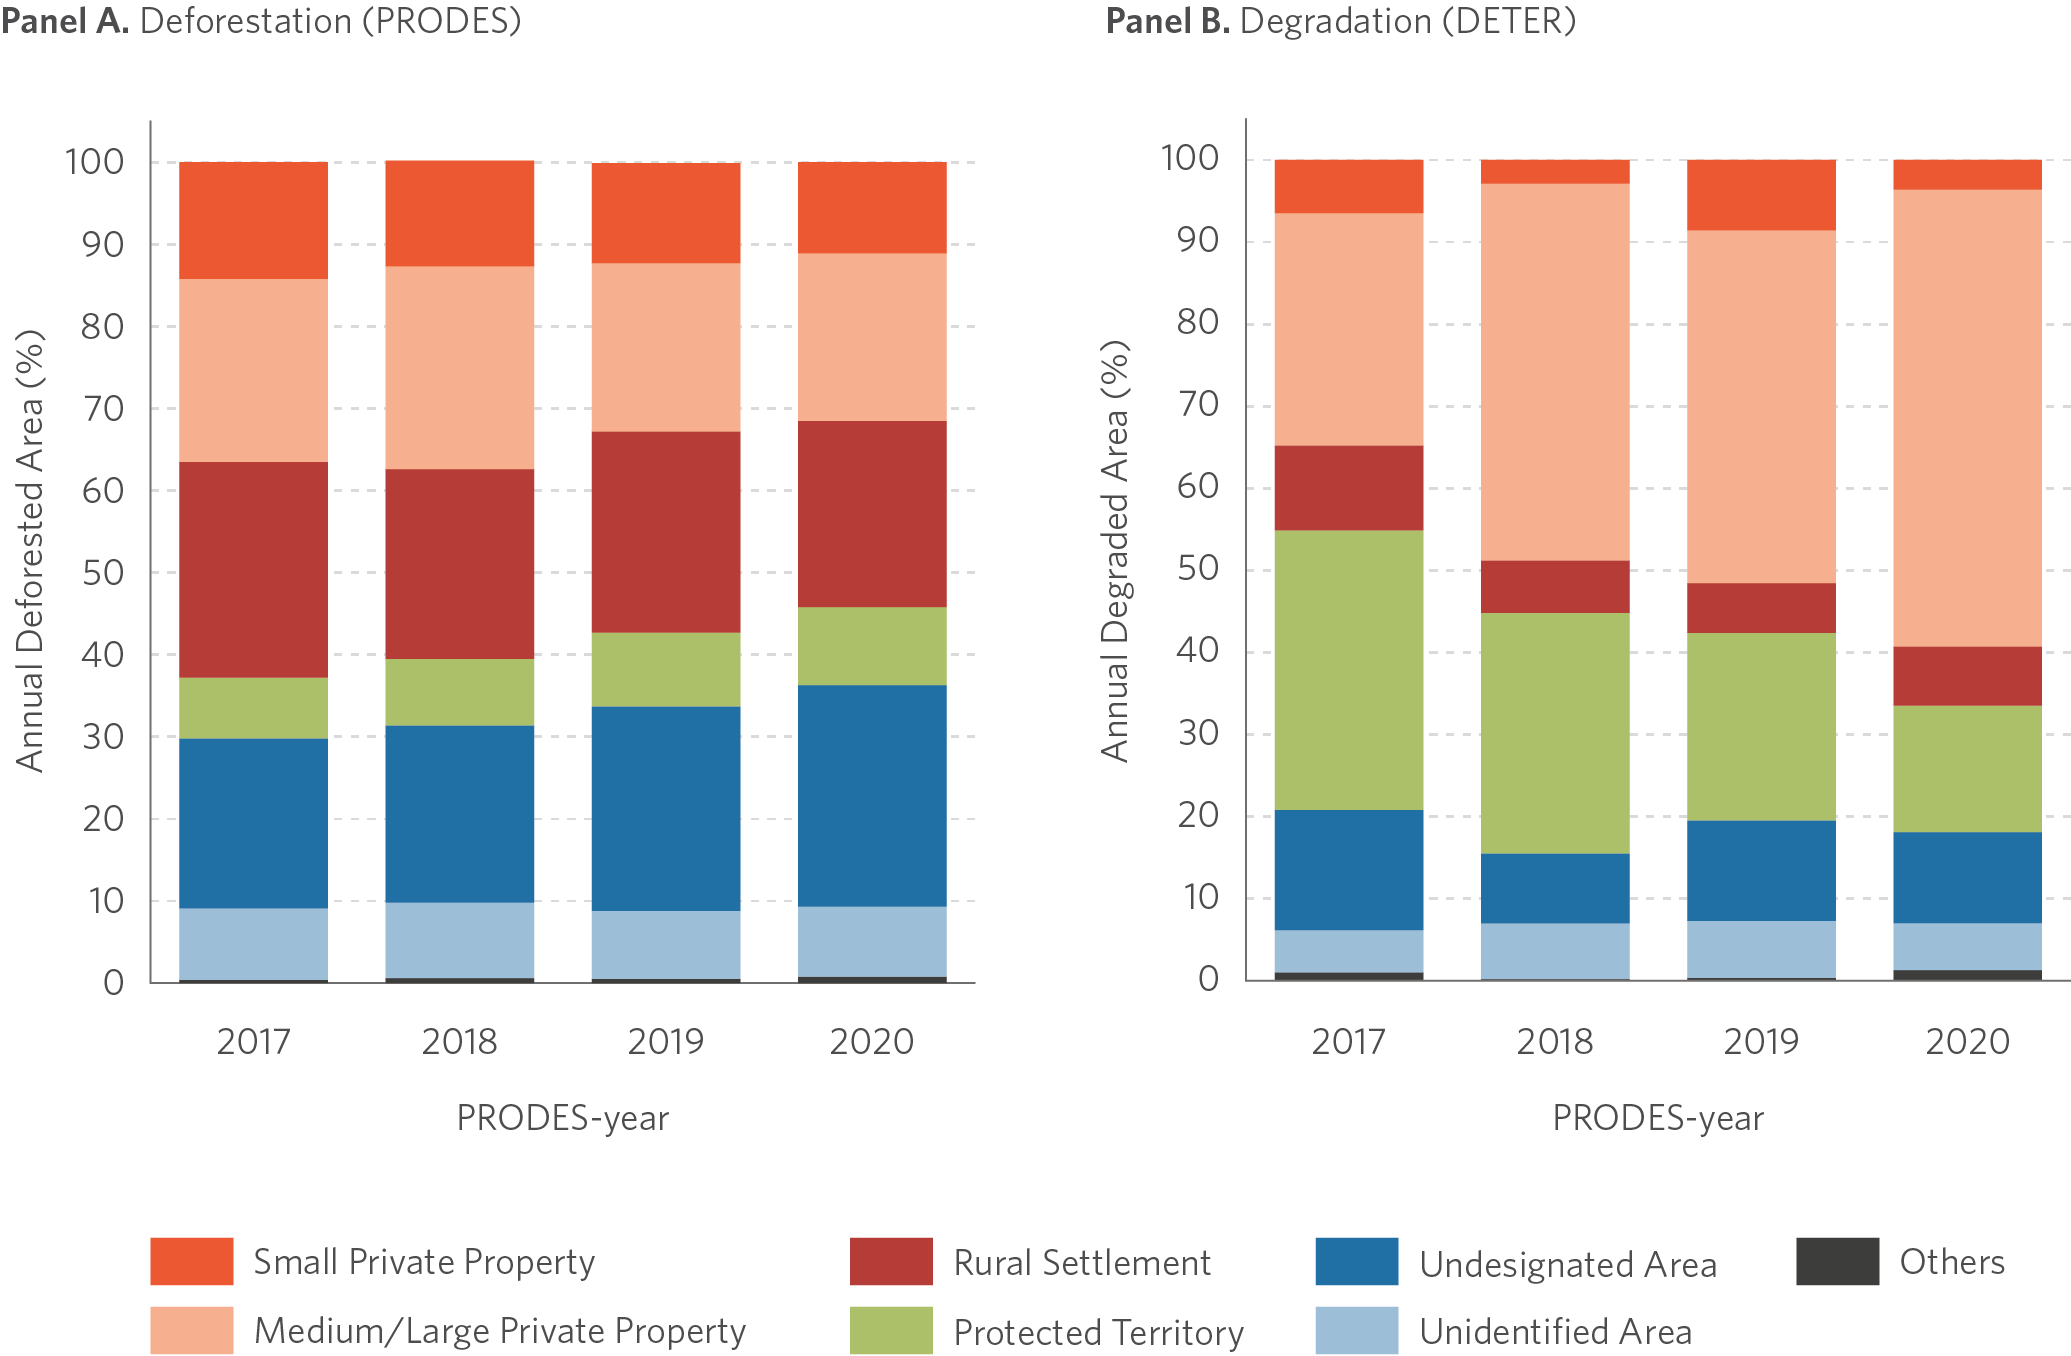
Note: Percentage is calculated using total deforestation or degradation area in each PRODES-year as denominators.
Source: CPI/PUC-Rio with data from PRODES and DETER (INPE), Atlas Agropecuário (Imaflora), and Floresta Pública Tipo-B (SFB), 2021
The non-homogeneous distribution of degradation and deforestation across land tenure categories in the Amazon suggests that different land governance models can affect forest conversion practices and land uses. Could it also be the case that different land governance models also affect the association between degradation and deforestation? If there is a clear pattern, then authorities could use this information to target environmental control efforts in areas that are both close to degradation and inside specific land tenure categories.
To explore this possibility, Figure 4 presents the association between degradation and future deforestation in its vicinities considering the land tenure category where the latter happens. In absolute terms, deforestation close to degradation is concentrated in medium or large private properties, rural settlements, and undesignated areas.[14] For example, almost 2,500 square kilometers of deforestation between 2017 and 2020 happened both in previously degraded areas or within 0.5 kilometers of them and inside medium or large private properties.
Figure 4. Association between Degradation and Deforestation across Land Tenure Categories in PRODES-years 2017 to 2020
Note: Only considering DETER alerts happening before PRODES deforestation. Areas within 0.5 km and 1 km also include area of alerts.
Source: CPI/PUC-Rio with data from PRODES and DETER (INPE), Atlas Agropecuário (Imaflora), and Floresta Pública Tipo-B (SFB), 2021
This result is in part due to the larger occurrence of deforestation in these same categories. In any case, it points to a potential criterion for targeting environmental control efforts around degradation alerts.
Policy Implications
Targeting degradation can be important strategy for boosting the impact of forest protection policies in some instances. Results of this analysis suggest that degradation serves as a sign that a region is under imminent risk of deforestation. It should therefore be used as a relevant input for strategizing efforts to combat deforestation. Moreover, spatial concentration in some land tenure categories, as well as relevant heterogeneity in the association between degradation and deforestation across these categories, offer potential prioritization criteria for authorities.
At the same time, however, this analysis also provides evidence that the local conversion of degradation into deforestation does not occur at scale in the Amazon. This fact is itself relevant for policy design. It suggests that the drivers of degradation – which alone affects a huge area in the Amazon – may differ from those that fuel deforestation. Indeed, if degradation is not an early stage of deforestation, it is important to deepen the understanding about this phenomenon and its underlying causes, and to incorporate this into the design of more effective conservation strategies. It is of special interest that degradation is so concentrated inside medium or large private properties. This suggests that fighting degradation requires greater effectiveness from policy instruments that address forest protection in private lands, such as the Forest Code.
Data
This analysis explores a rich vector dataset that was created based on several publicly available sources. The main variables and their sources are as follows: degradation alerts from DETER/INPE; annual deforestation increments from PRODES/INPE; land tenure categories from both the Atlas Agropecuário/Imaflora and the Cadastro Nacional de Florestas Públicas/Serviço Florestal Brasileiro.
Methodological Note
This study analyzes forest degradation and its relationship with deforestation from 2017 to 2020 (PRODES-years). The data refer to degraded and deforested areas of at least 6.25 hectares in the Brazilian Legal Amazon region – which in turn is an administrative sub-division defined by Brazilian law and characterized by the influence of the Amazon biome. The analysis considers degradation and deforestation events that happened either in the same area or close to one another, and it focuses only on cases of degradation that occurred before deforestation, stratifying the results by land tenure categories.
The authors would like to thank the teams at CENIMA/IBAMA and INPE for their comments and suggestions. They also thank Juliano Assunção, Natalie Hoover El Rashidy and Giovanna de Miranda for editing and revision, as well as Nina Oswald Vieira and Julia Berry for formatting and design.
[1] Degradation data come from the Real-Time Deforestation Detection System (Sistema de Detecção de Desmatamento em Tempo Real – DETER), whereas annual deforestation is measured by the Brazilian Amazon Rainforest Monitoring Program by Satellite (Programa de Monitoramento da Floresta Amazônica Brasileira por Satélite – PRODES). Although DETER is intended to help the environmental control policy instead of quantifying the level of degradation in the Amazon, it is the only available measure during the period of interest for this study.
[2] Barlow, Jos et al. “Anthropogenic disturbance in tropical forests can double biodiversity loss from deforestation”. Nature 535 (2016): 144-147. bit.ly/3Bm71Ce.
[3] IPCC. Climate Change and Land: an IPCC special report on climate change, desertification, land degradation, sustainable land management, food security, and greenhouse gas fluxes in terrestrial ecosystems. 2019. bit.ly/2UZbTMP.
[4] Longo, Marcos, et al. “Aboveground biomass variability across intact and degraded forests in the Brazilian Amazon”. Global Biogeochemical Cycles 30 (2016): 1639-1660. bit.ly/3wUmA0x.
[5] Matricardi, Eraldo A. T. et al. “Long-term forest degradation surpasses deforestation in the Brazilian Amazon”. Science 369, nº 6509 (2020): 1378-1382. bit.ly/3kCLv6l.
[6] Rappaport, Danielle I., Douglas C. Morton, Marcos Longo, Michael Keller, Raplh Dubayah, and Maiza N. dos-Santos. “Quantifying long-term changes in carbon stocks and forest structure from Amazon Forest degradation”. Environmental Research Letters 13, nº 6 (2018): 065013. bit.ly/3rpypus.
[7] Menezes, Diego, Rafael Pucci, João Mourão, and Clarissa Gandour. The Relationship between Forest Fires and Deforestation in the Amazon Phenomena are More Closely Related in Rural Settlements and in Occupied Public Lands. Rio de Janeiro: Climate Policy Initiative, 2021. bit.ly/FireandDeforestation.
[8] Gandour, Clarissa, Diego Menezes, João Pedro Vieira, and Juliano Assunção. Forest Degradation in the Brazilian Amazon: Public Policy Must Target Phenomenon Related to Deforestation. Rio de Janeiro: Climate Policy Initiative, 2021. bit.ly/3rkHzKM.
[9] Local conversion happens when the exact same area affected by degradation is later deforested. In other words, it is the case when degradation works as a first stage to deforestation.
[10] “Land Tenure Categories” denotes the type of land governance. Each category has specific characteristics depending on ownership (public or private), management (group or individual), and on whether the land is linked or not to a governmental agency. Moreover, each category is governed by specific legislation. In this study, land tenure categories are as follows: Small/Medium/Large Private Property, Protected Territory, Rural Settlement, Undesignated Area, Unidentified Area, and Others.
[11] According to the official source, the database made publicly available by INPE contains only alerts with minimum area of 6.25 hectares to ensure comparability with data from PRODES, which maps and measures annual deforestation.
[12] It’s important to differentiate two concepts related to forest fires: “Forest Fire Burned Area” and “Active Fire”. “Forest Fire Burned Area” denotes the visual footprint left by forest fires and it is detected by optical sensors in satellites. Conversely, “Active Fire” is registered in the moment when forest fires are happening and it is detected by thermal sensors in satellites. Typically, “Forest Fire Burned Areas” are caused by “Active Fires”, but not all “Active Fires” leave visual traces such a “Forest Fire Burned Area”.
[13] The notion of PRODES-year is used in this study to ensure comparability with the annual deforestation increments measured by PRODES. PRODES data do not refer to a calendar year, but to the period comprised between August of a given year and July of the following year. For example, PRODES-year 2017 starts in August 2016 and ends in July 2017.
[14] In relative terms, the share of deforestation happening in previously degraded areas or in its vicinity does not vary substantially across land tenure categories. On average, around 20-30% of deforestation is located within 0.5 kilometers of degradation alerts across all land tenure categories. For areas within 1 kilometer, such share varies between 30% and 40%.
