The Climate Finance Gap for Small-Scale Agrifood Systems
Small-scale farmers and related supply chain actors contribute a significant share of global food production, particularly in East Asia and the Pacific, South Asia, and sub-Saharan Africa.
Small-scale producers and the agri-MSMEs serving them are expected to face the most severe impacts of climate change and have limited capacity to manage them. Despite their critical position in food production, emissions, and climate vulnerability, small-scale farmers and agri-MSMEs receive a meager share of climate finance.
This report complements our recent Landscape of Climate Finance for Agrifood Systems publication by examining the climate finance going specifically to small-scale agrifood systems, with the aim of identifying gaps and opportunities for action in this crucial but under-researched sector.
Key findings
- Climate finance to small-scale agrifood systems was strikingly low in 2019/20, at just USD 5.53 billion, far below the needs of producers and supply chain actors. This represents just 0.8% of total climate finance tracked across all sectors (USD 660.2 billion), and 19% of climate flows to agrifood systems as a whole (USD 28.5 billion).
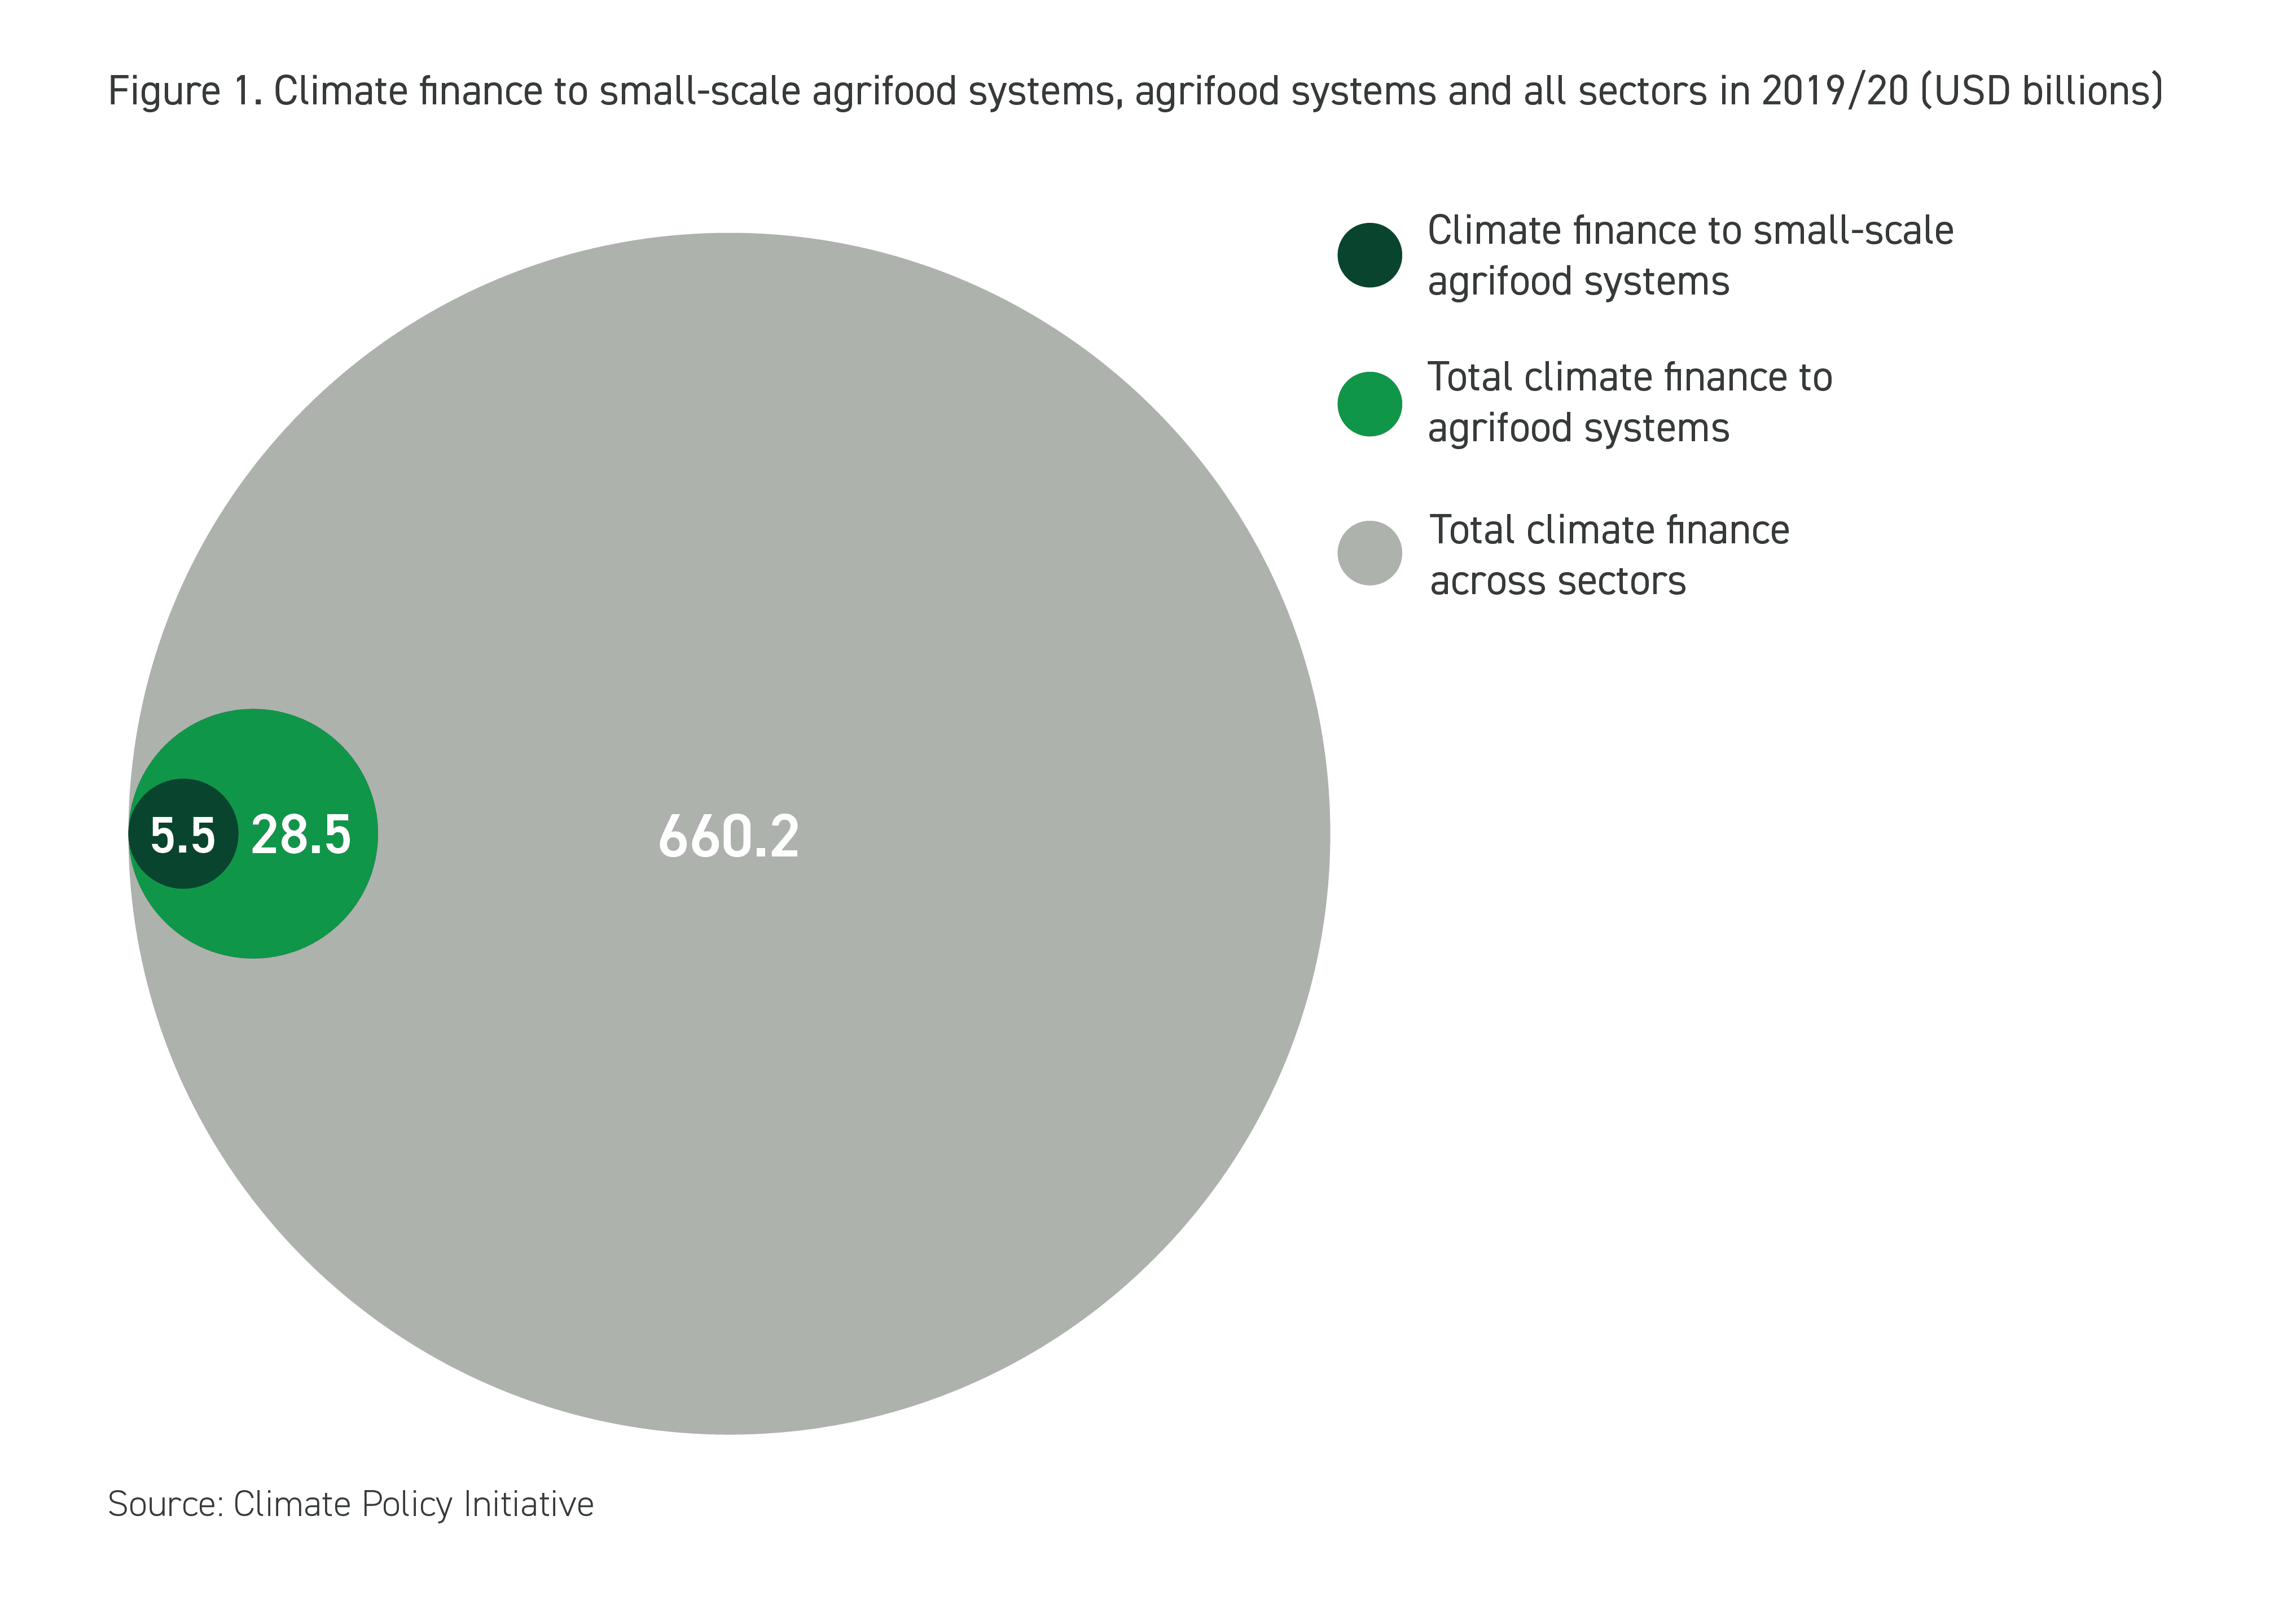
- At USD 28.5 billion, the total climate finance for agrifood systems as a whole is at least seven times lower than the most conservative estimated needs (CPI, 2023). Similarly, the unmet general financing needs of smallholder farmers are estimated at USD 170 billion annually, and USD 106 billion for agri-SMEs (ISF Advisors, 2022).
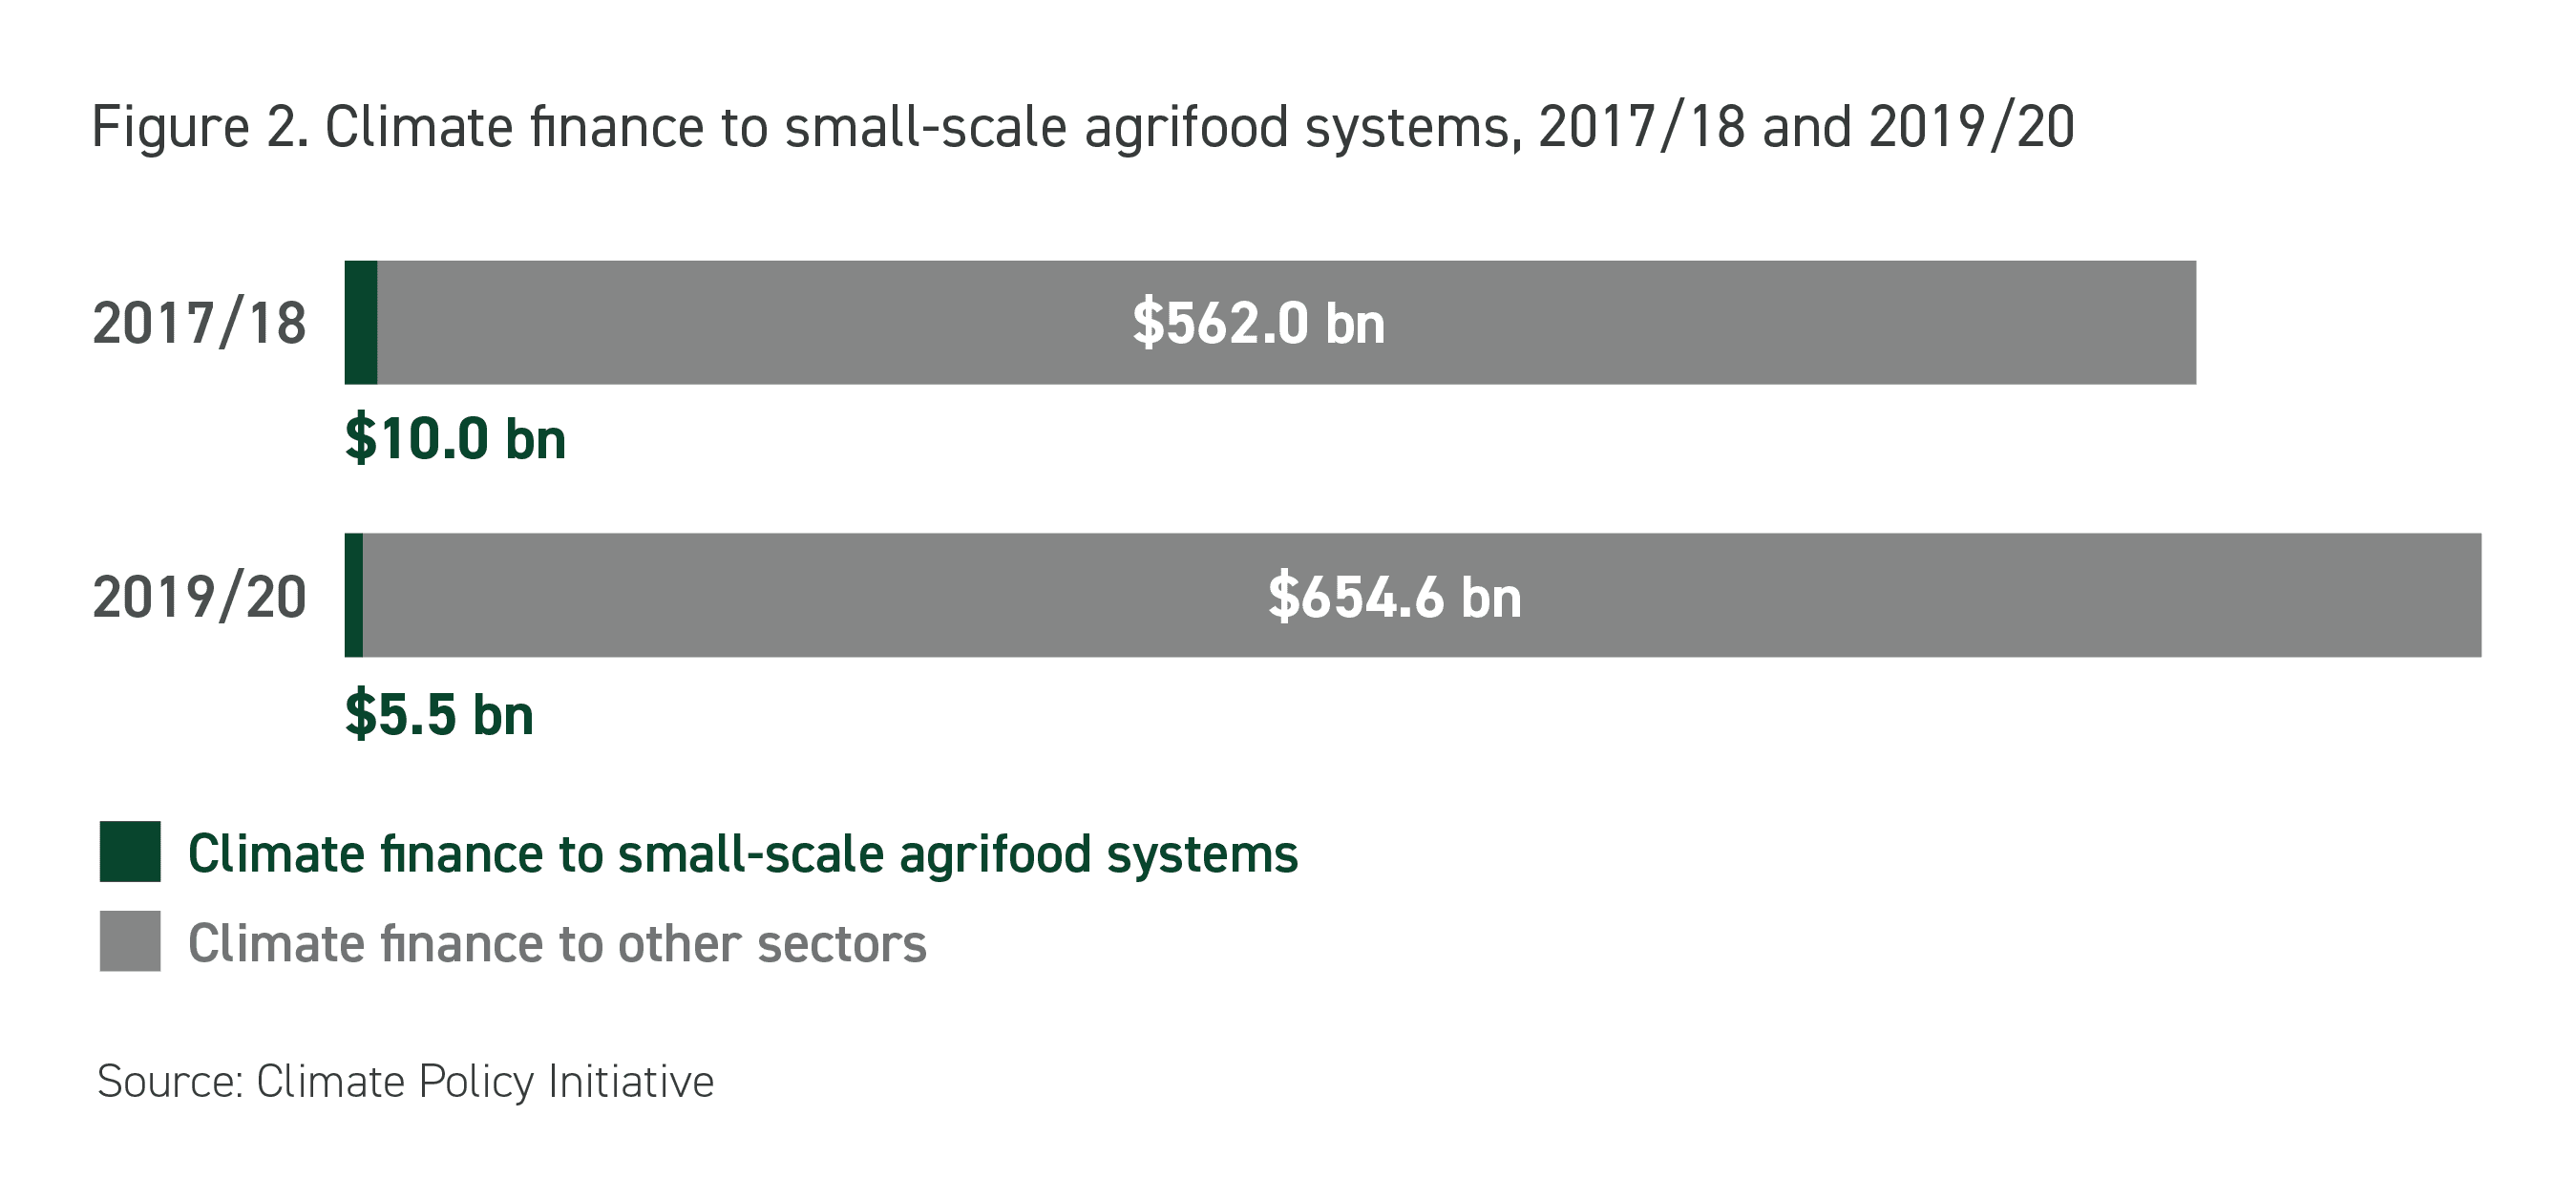
- Climate finance for small-scale agrifood systems experienced a 44% drop in 2019/20, compared with the previous tracking period (2017/18). This reflects the 20% decline in climate finance to agriculture, forestry, other land uses and fisheries (AFOLU) in the same period yet contrasts with a significant increase in overall climate finance across sectors.
Even as global climate finance is on an upward trajectory overall, the funding tracked for small-scale agrifood systems falls short no matter the metric these flows are considered against – be it share of farmland managed, contribution to food supply and domestic economies, vulnerability to climate change or contribution to GHG emissions.
Exploring the data
Despite an overall drop in flows in 2019/20, the finance sources, financial instruments used, climate objectives, geographic distribution and sub-sectoral distribution of flows all remained broadly similar to the 2017/18 period.
Financial instruments and sources
Public entities remain the main source of climate finance for small-scale agrifood systems in 2019/20, providing approximately USD 5.3 billion (96%). International finance represented approximately 81% (USD 4.3 billion) of the total public finance tracked for small-scale agrifood systems.
Small-scale agrifood systems received nearly half of climate finance in the form of grants, totaling USD 2.7 billion, and 39% (USD 2.2 billion) as concessional debt. This is similar to the 2017/18 period when grants made up 47% and concessional debt 31% of flows. Equity made up just USD 0.03 billion (0.6%) of total climate flows to these systems yet represented 3% of flows to agrifood systems as a whole (CPI, 2023). Given their potential for risk sharing and fostering long-term commitments, there is an opportunity for increased equity finance in small-scale agrifood systems.
Climate objectives
In 2019/20, the distribution of finance between climate objectives remained similar to 2017/18; 50% of finance went to adaptation, 33% to dual climate objectives, and 17% to mitigation. Significantly, 98% of tracked adaptation finance went to projects in non-OECD countries, in line with the climate vulnerabilities faced by small-scale producers in low- and lower-middle-income countries.
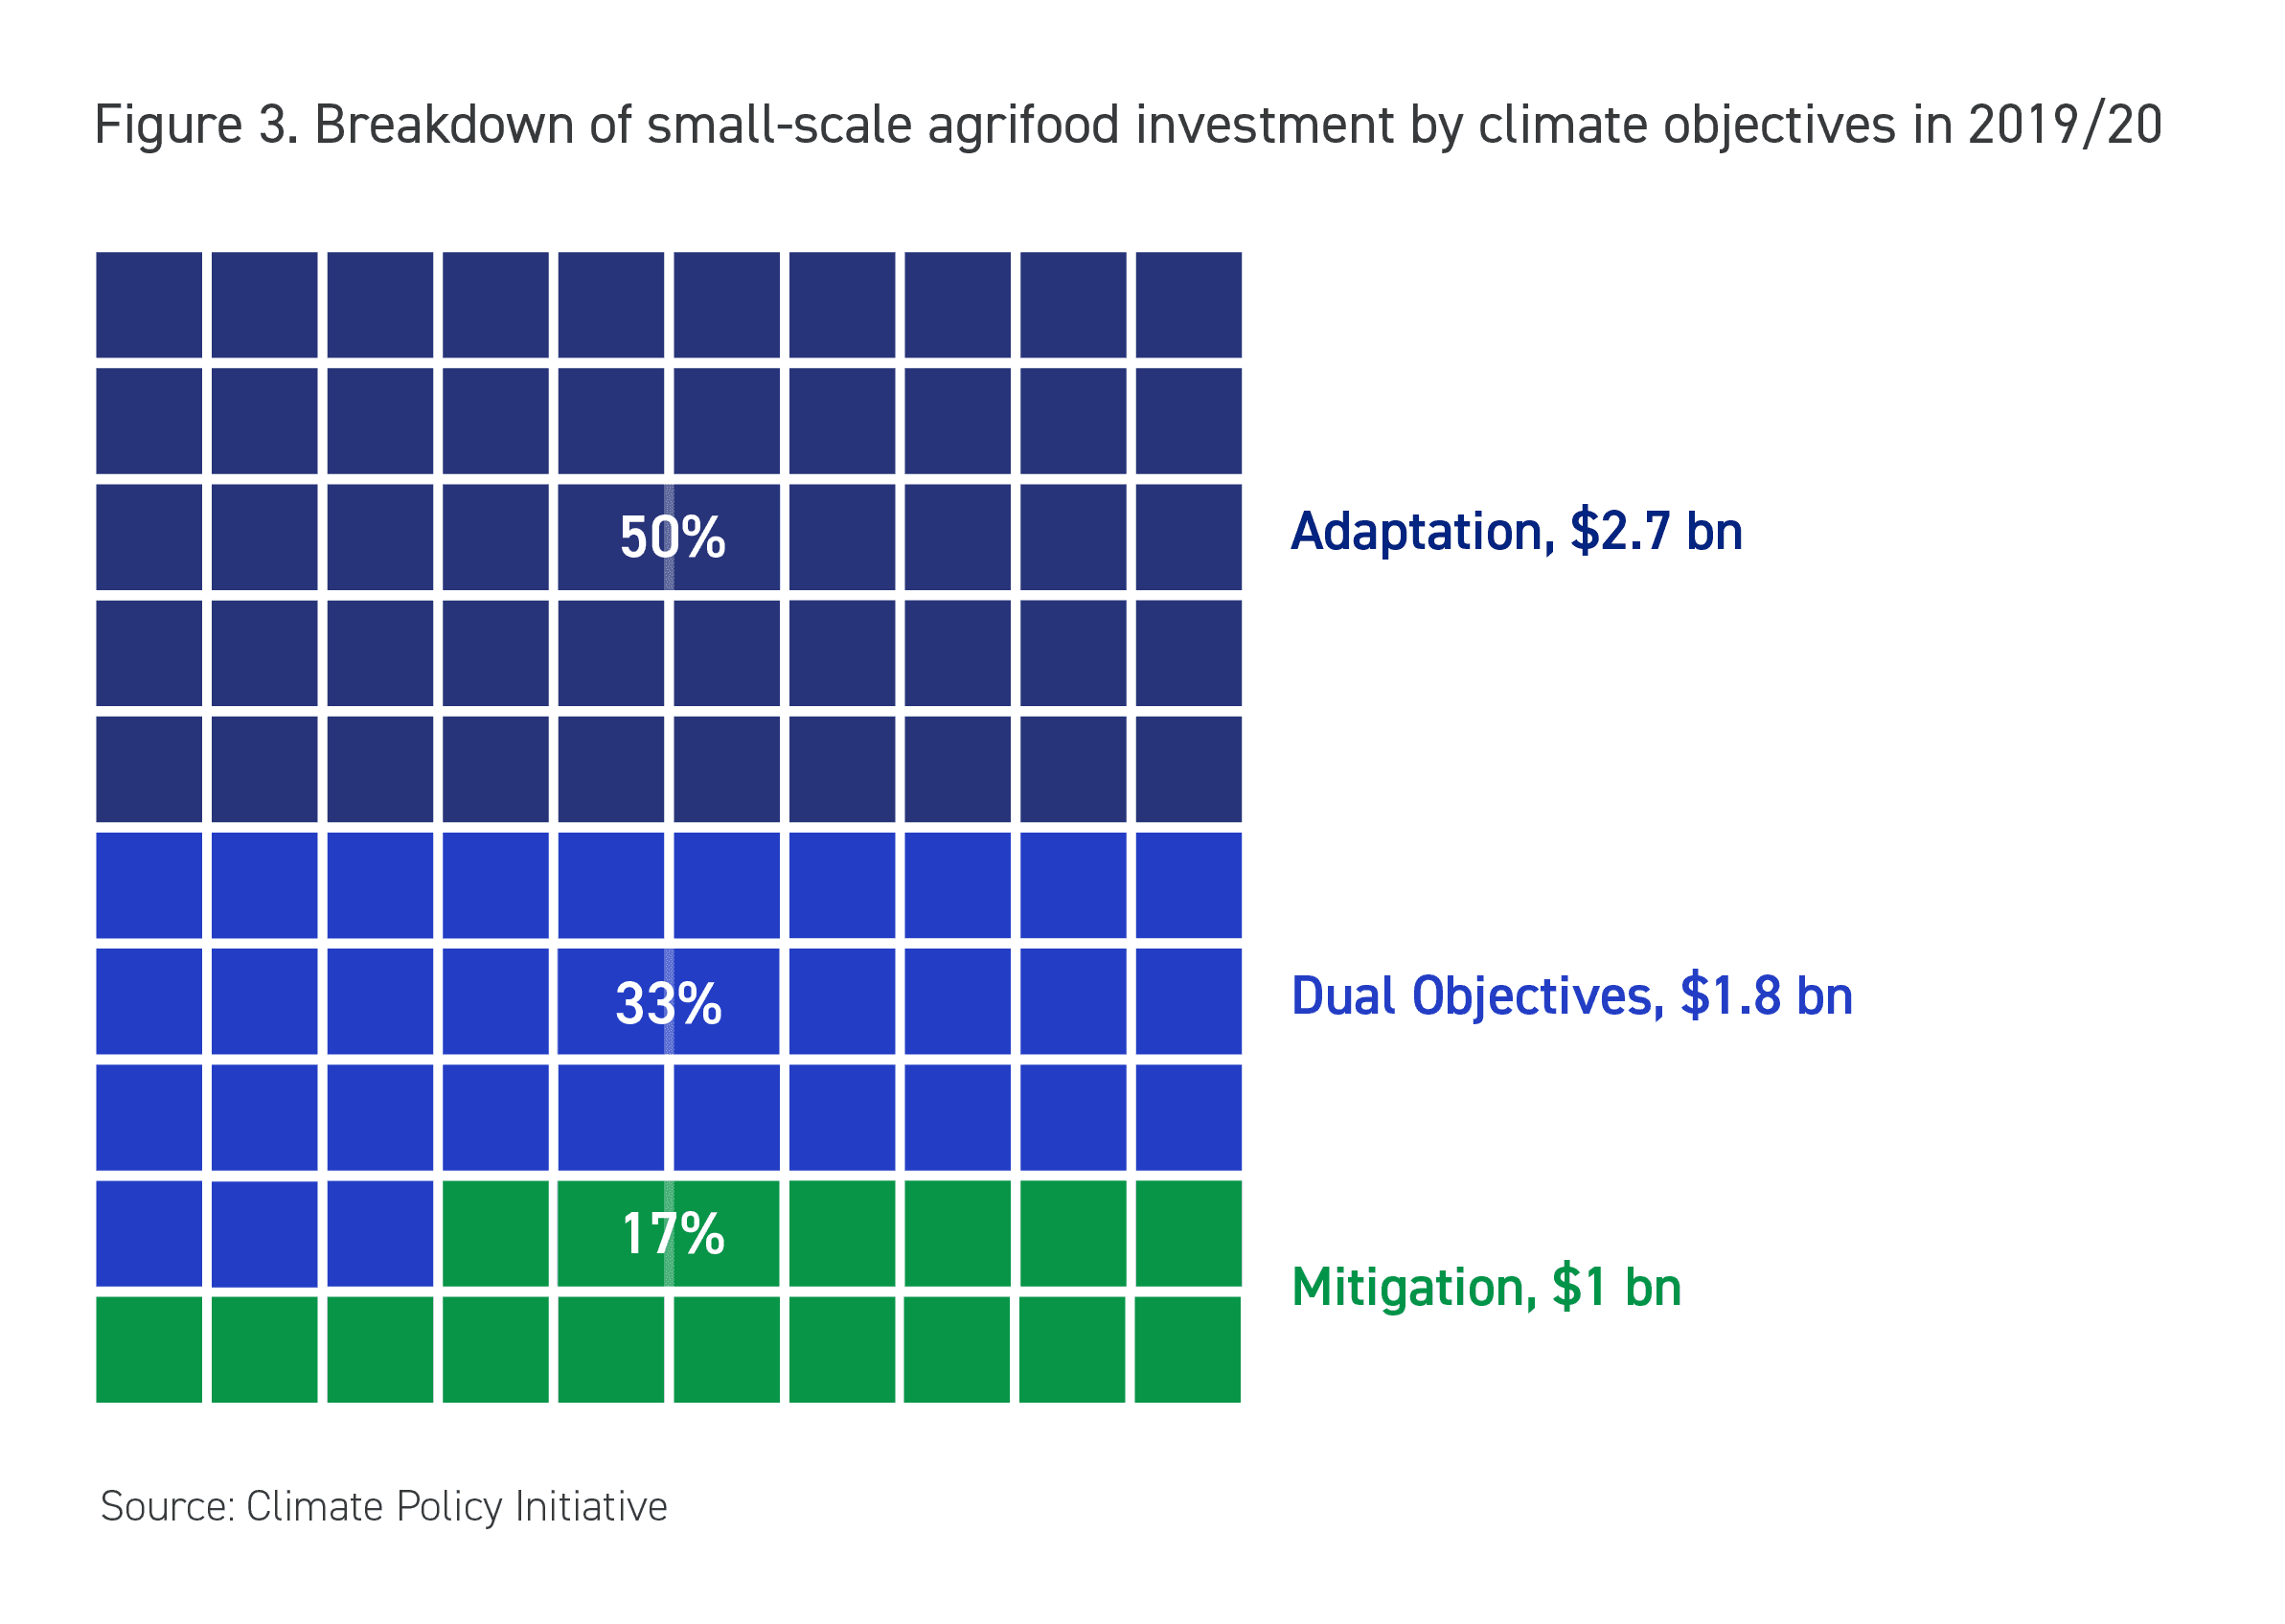
Dual objective climate finance for small-scale agrifood systems amounted to USD 1.8 billion or a third of the total. The vast majority of this (96%) came from the public sector, notably governments, which provided USD 1.3 billion, mainly through grant funding. However, excluding the flows of China’s Conversion of Cropland to Forest Program (CCFP) (USD 1 billion), dual objective funding would amount to USD 0.8 billion or 18% of the total, making it the least financed climate objective.
Mitigation finance for small-scale agrifood systems reached USD 1 billion, or 17% of the total, equivalent to 0.2% of global climate mitigation finance across all sectors. Such statistics underline the magnitude of the finance gap and indicate opportunities to enhance mitigation and dual climate benefits efforts, given that small-scale agriculture and land-use change from developing countries are roughly estimated to contribute approximately 5% of global GHG emissions.
Geographic distribution
Sub-Saharan Africa, East Asia and the Pacific, and South Asia – together home to approximately 95% of the world’s small-scale farms – received 73% of total climate finance for small-scale agrifood systems in 2019/20. Sub-Saharan Africa received the largest share (34%, or USD 1.86 billion), which aligns with the fact that a substantial proportion of the region’s farms are small in scale.
East Asia and the Pacific received the second-largest share (approximately 28%). However, discounting funds from CCFP would make the region the fourth-largest recipient, despite having the greatest share of land under small-scale management and recording the highest regional agrifood GHG emissions.
South Asia also appears considerably underserved, receiving only 11% of total small-scale agrifood climate funds, despite having the second-most climate-vulnerable food and agriculture systems globally. The Middle East and North Africa received only 1.5% of climate finance for small-scale agrifood systems, despite having a significant concentration of small-scale producers, and notable climate vulnerability.
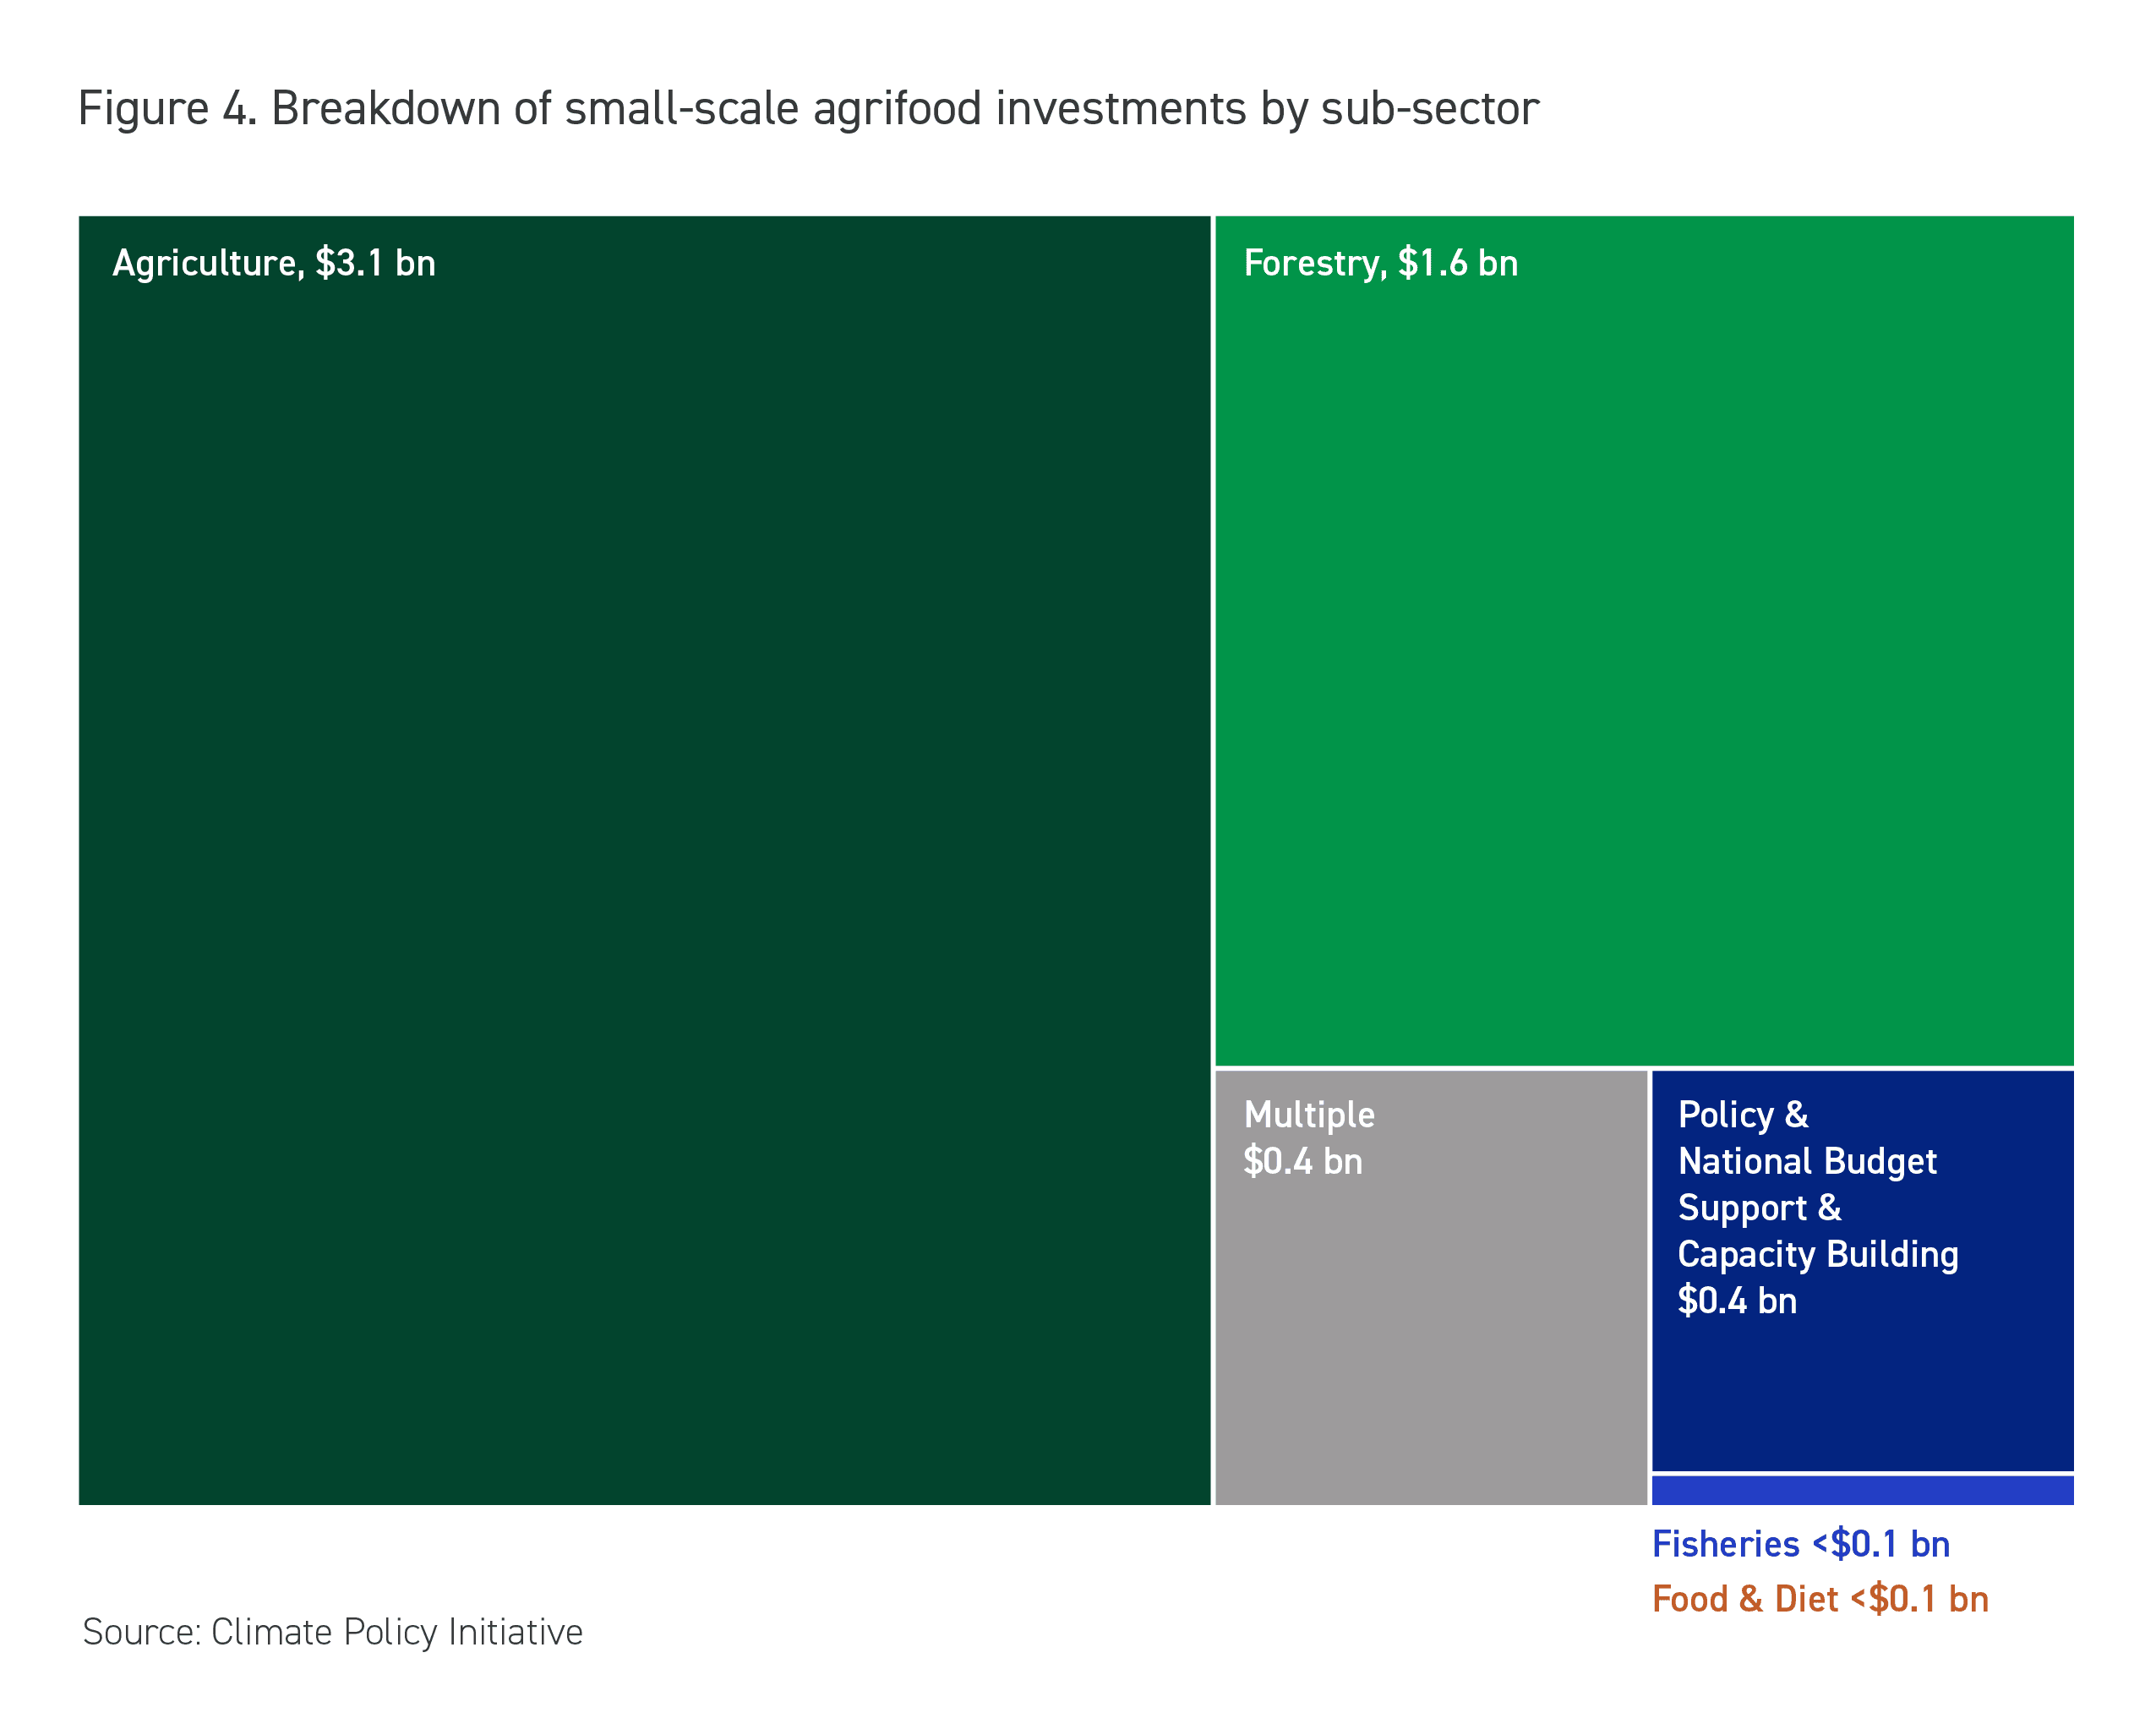
Sub-sectoral distribution
In 2019/20, climate finance for small-scale agrifood systems was largely directed to the agriculture sector, which received 57% of the total. This was followed by forestry, representing 29%. The fisheries sector was notably underserved, receiving only
0.5%, as was food loss and waste with less than 0.1%.