Rural Investment: BNDES Credit Contributes to Agricultural Intensification
Machinery and equipment are key investments in Brazilian agriculture. In the 2020/21 agricultural year, rural credit operations to finance the purchase of machinery, equipment, and vehicles totaled R$ 42 billion, corresponding to more than half (53%) of total credit for rural investment.[1] Machinery and equipment play a significant role in increasing agricultural productivity, contributing to the adoption of new technologies and modernization of the sector.
The Brazilian National Development Bank (Banco Nacional de Desenvolvimento Econômico e Social – BNDES) provided R$ 18 billion in credit for rural investment in Brazil in the 2020/21 agricultural year, playing a leading role in this segment. Of this amount, 71% was allocated to machinery, equipment, and vehicles. Understanding the impact of credit for the acquisition of machinery and equipment on agricultural activity and land use is essential to assessing BNDES’s performance in the rural sector.
This insight is the result of a partnership between researchers from the Climate Policy Initiative/Pontifical Catholic University of Rio de Janeiro (CPI/PUC-Rio) and BNDES. The study evaluates the effects of BNDES rural credit for investment in machinery and equipment on agricultural activity and land use in Brazil. This research contributes to a better understanding of the economic, social, and environmental impacts of BNDES credit. It also expands on previous CPI/PUC-Rio research about the effects of rural credit and broadens the understanding of credit for investment purposes.[2] This document is part of a larger research agenda on BNDES rural credit, which includes a previous publication by CPI/PUC-Rio[3] and the BNDES´s Effectiveness Evaluation Report.[4]
The findings show significant impacts of BNDES credit. An increase in the availability of rural credit for equipment leads to higher agricultural productivity, and to the replacement of pasture areas with cropland at the municipal level, without increasing deforestation. These results are in line with previous studies by CPI/PUC-Rio.
In addition, this work also explores some heterogeneities in the impact of credit. Most of the equipment used in agriculture is labor-saving. For example, agricultural tractors and harvesters reduce workers’ effort in planting and harvesting. In other words, the use of these machines has a greater impact on labor productivity than on land productivity. Thus, the assessment of credit for equipment was broken down into two dimensions: 1) the profile of the municipality, distinguishing between more labor-intensive and less labor-intensive municipalities, and 2) the type of equipment financed, focusing on equipment identified as labor-saving.
This analysis shows that increased productivity patterns, especially in crops, are mostly found in more labor-intensive municipalities (59% of the municipalities in the Southeast, South, and Northeast regions are classified as labor-intensive), and in loans for equipment classified as labor-saving.
The rest of the brief is organized as follows. Section 1 describes credit for farming machinery and equipment granted by BNDES and explains the data used in the impact analysis. Section 2 presents estimates of the effects of credit on economic and land use variables. Section 3 geographically characterizes the municipalities according to labor intensity in agriculture. Section 4 presents the impact analysis segmented between municipalities that differ in labor intensity. Section 5 focuses on the analysis of credit used to purchase labor-saving equipment. Section 6 presents conclusions.
SUSTAINABILITY AND BNDES RURAL CREDIT
The abundance of deforested land in Brazil provides an opportunity to expand agricultural production without removing additional native vegetation. According to estimates, Brazil can more than double its production in areas that are already available, without deforestation.[5] To do so, producers must invest in the modernization of their operations, intensifying production.
In addition, growing global concerns about forests and climate change have had an impact on trade agreement negotiations, with consequences for our exports. International markets increasingly call for sustainable products based on zero deforestation. Consumers and large buyers demand traceability of production chains to identify those responsible for deforestation and other environmental crimes. Thus, environmental protection is an increasingly determining driver of Brazil’s economic success.
The modernization and intensification of agriculture requires considerable resources. Investment credit allows producers to expand their production capacity and adopt innovations and sustainable technologies. The estimates presented in this study show that BNDES credit for agricultural equipment increases land productivity without expanding the agricultural area and without increasing deforestation. Pasture areas are replaced by crop areas, which are generally more productive. The more labor-intensive municipalities present higher productivity increases in agriculture.
Strengthening BNDES’s credit policy towards greater production intensification, adoption of good practices, and sustainability is expected to contribute to the country’s progress in economic, social, and environmental issues. From an economic standpoint, the conservation of rural properties’ native vegetation are public goods that fail to reach socially-desired levels when provided by private agents. This is because private costs and benefits differ from public ones. Government support for rural credit aligned with environmental and deforestation reduction goals encourages the provision of these public goods.
In fact, important efforts have recently been made to make the Brazilian rural credit policy greener and agricultural production more sustainable. For the 2020/21 Agricultural Plan, the National Monetary Council (Conselho Monetário Nacional – CMN) determined that producers with a valid registration in the Rural Environmental Registry (Cadastro Ambiental Rural – CAR) can benefit from an increase of up to 10% in the working capital credit limit used to purchase certain assets. It also allowed financing for the acquisition of Environmental Reserve Quotas (Cotas de Reserva Ambiental – CRA). Furthermore, the Central Bank of Brazil launched the Sustainability dimension of its Agenda BC# in September 2020. Two initiatives stand out: 1) the announcement of the Green Credit Bureau (Bureau Verde), which will be associated with the rural credit system and will contain information on sustainable practices by borrowers; and 2) the goal to generate incentives to make rural credit greener. The Central Bank of Brazil has already indicated that it may continue to increase credit limits by up to 20% for producers who meet sustainability criteria. To this end, the alignment of BNDES’s credit policy with sustainable practices would be consistent with the measures mentioned above, thus spreading this trend to the rest of the financial sector.
1. BNDES CREDIT FOR EQUIPMENT
The analysis of the economic and land use impacts of BNDES rural credit uses the bank’s credit operations specifically intended for the purchase of farming machinery and equipment between 2005 and 2019 – the period for which data is available. The largest share of the volume of credit for machinery and equipment is used to purchase harvesters and tractors, which account for 56% of these funds between 2005 and 2019.
Additionally, only indirect credit operations associated with the FINAME product, which aims to finance the production and acquisition of domestic machinery and equipment, are considered. In the indirect modality, borrowers (rural producers and cooperatives) access funds through banks and other financial institutions, which are responsible for the risk attached to the operation. In this arrangement, BNDES transfers the loan funds to the financial agent according to the rates and terms established by the bank for each type of credit. In 2020, 57% of the volume of BNDES loans to the agricultural sector were granted through BNDES FINAME.[6] In these operations, it is possible to identify the type and amount of financed equipment.
A few descriptive statistics of rural credit for equipment are presented below. A broader analysis of BNDES’s performance and evolution in rural credit, as well as the characteristics of credit for equipment, can be found in a previous publication by CPI/PUC-Rio.[7]
Figure 1 shows the evolution of the volume of BNDES FINAME credit for the purchase of farming machinery and equipment, henceforth called “rural credit for equipment”. Between 2005 and 2019, albeit with strong fluctuations, rural credit for equipment had a real increase of 97%, from R$ 4.9 billion in 2005 to R$ 9.7 billion in 2019 (in real values of December 2019).[8] In the period under analysis, the maximum amount of credit reached R$ 19.7 billion in 2013, and was associated with government initiatives after the 2008 international crisis.
Figure 1. Evolution of the Volume of Rural Credit for Equipment, 2005 – 2019
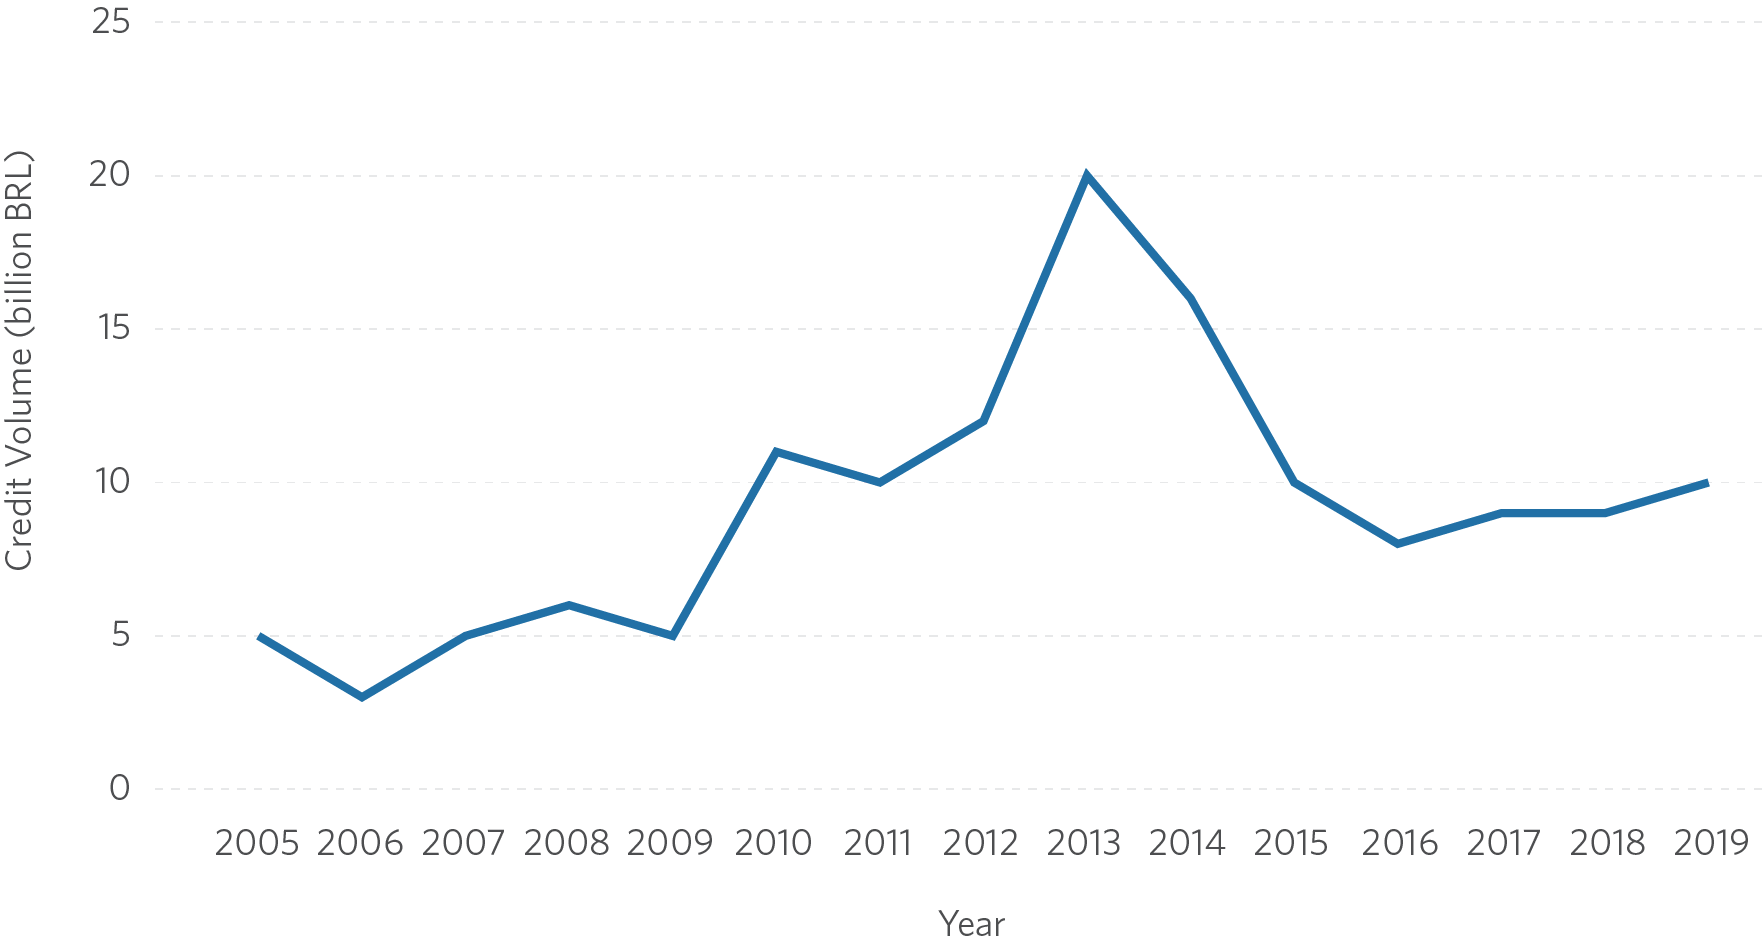
Note: Values deflated by the IPCA, based on December 2019.
Source: CPI/PUC-Rio with data from BNDES, 2022
Figure 2 shows the three main financial institutions responsible for transferring BNDES rural credit for equipment in each Brazilian municipality in 2019. The main institutions are defined as those that lend the largest volumes of credit in each municipality. The importance of financial institutions varies across regions. In the North, Northeast, and Midwest regions, Bradesco predominates (the largest transferor, respectively, in 38%, 31%, and 31% of the municipalities in these regions).[9] The institution DLL is the main transferor in most municipalities in the Southeast region (largest transferor in 32% of the municipalities). In the South, the largest share is that of the SICREDI cooperative (the largest transferor in 20% of the municipalities). In the Midwest, it also stands out as the largest transferor in 15% of the municipalities in the region.
The maps also reveal that many municipalities in the North and Northeast regions do not have access to BNDES rural credit for equipment (municipalities shown in white). Additionally, the markets of these two regions seem to be more concentrated than those of the other regions. The maps referring to the second, or third main financial institution also show more municipalities in white in the North and Northeast, indicating that, in the absence of the main (or second main) financial institution, farmers often have no alternative to obtain loans. In the Northeast, 65% of the municipalities had only one credit transferor in 2019. In the North, this percentage was 38%.
Figure 2. Main Providers of Rural Credit for Equipment by Municipality, 2019
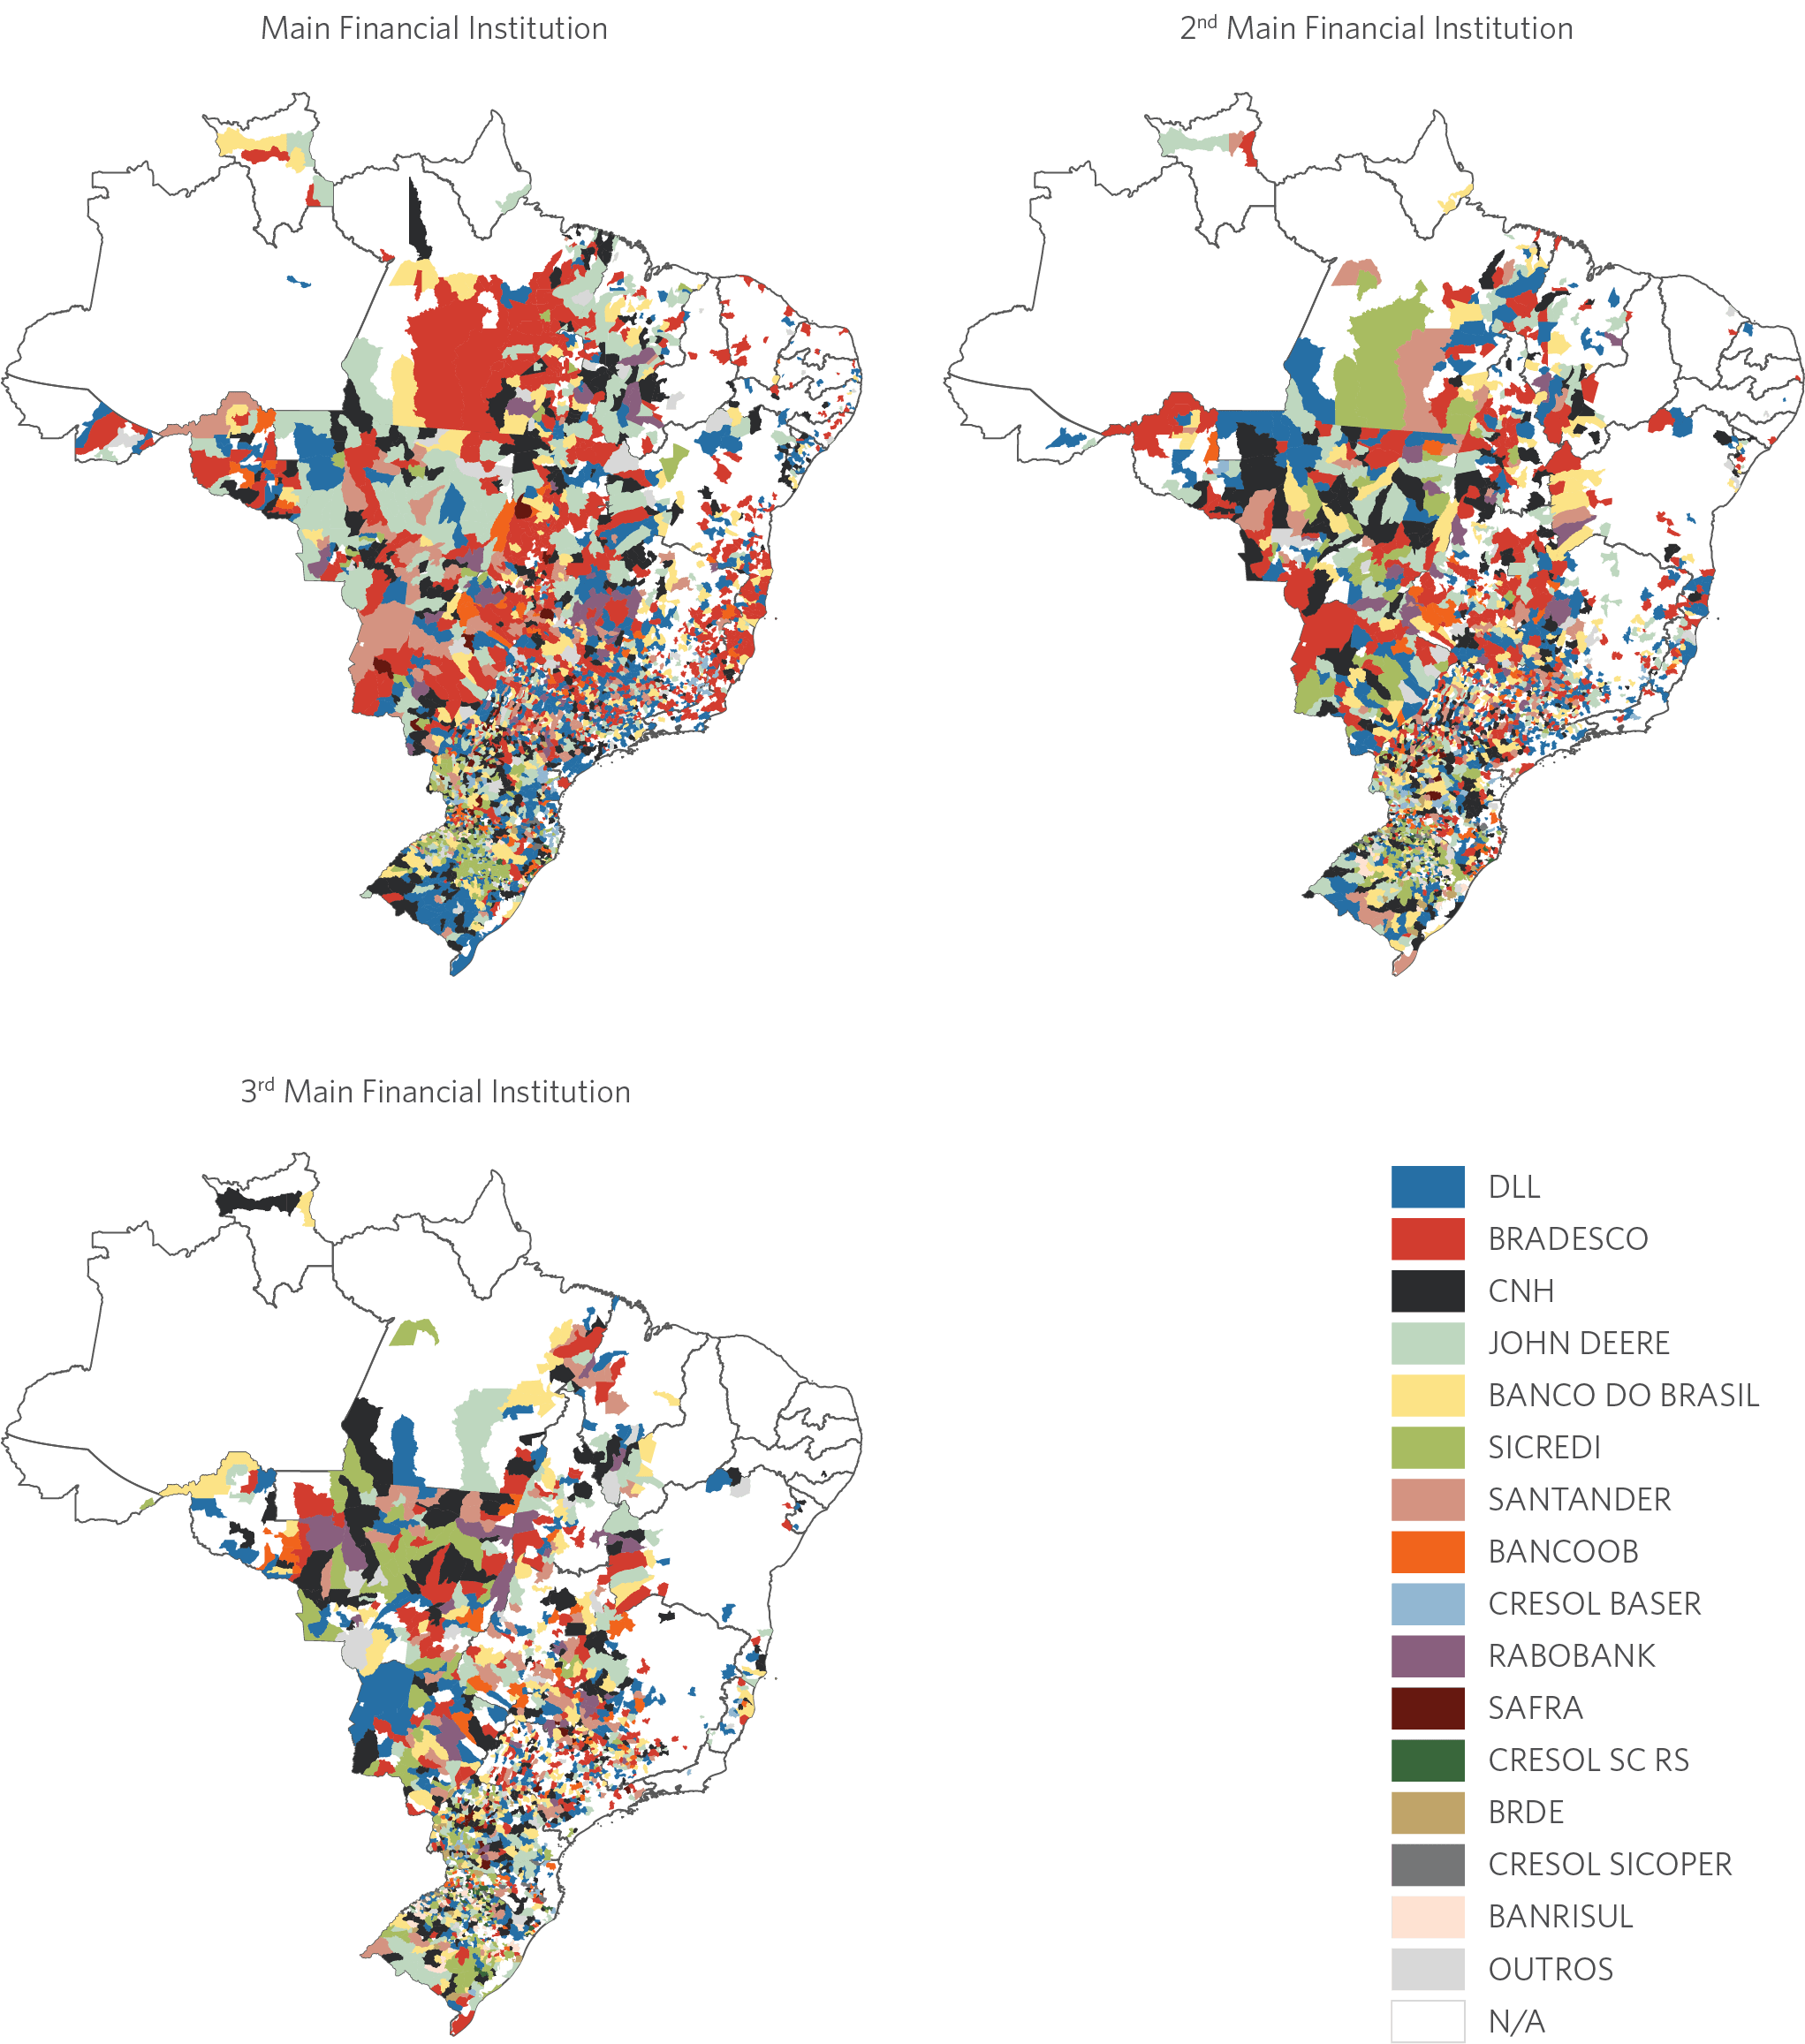
Note: The main financial institutions are defined as those that lend the largest volume of credit in each municipality.
Source: CPI/PUC-Rio with data from BNDES, 2022
Figure 3 shows the evolution of the participation of the main financial agents in the total volume of rural credit for equipment at the national level. There is substantial variation in the participation of agents between years.
Figure 3. Evolution of the Participation of Financial Agents Transferring Rural Credit for Equipment, 2005 – 2019
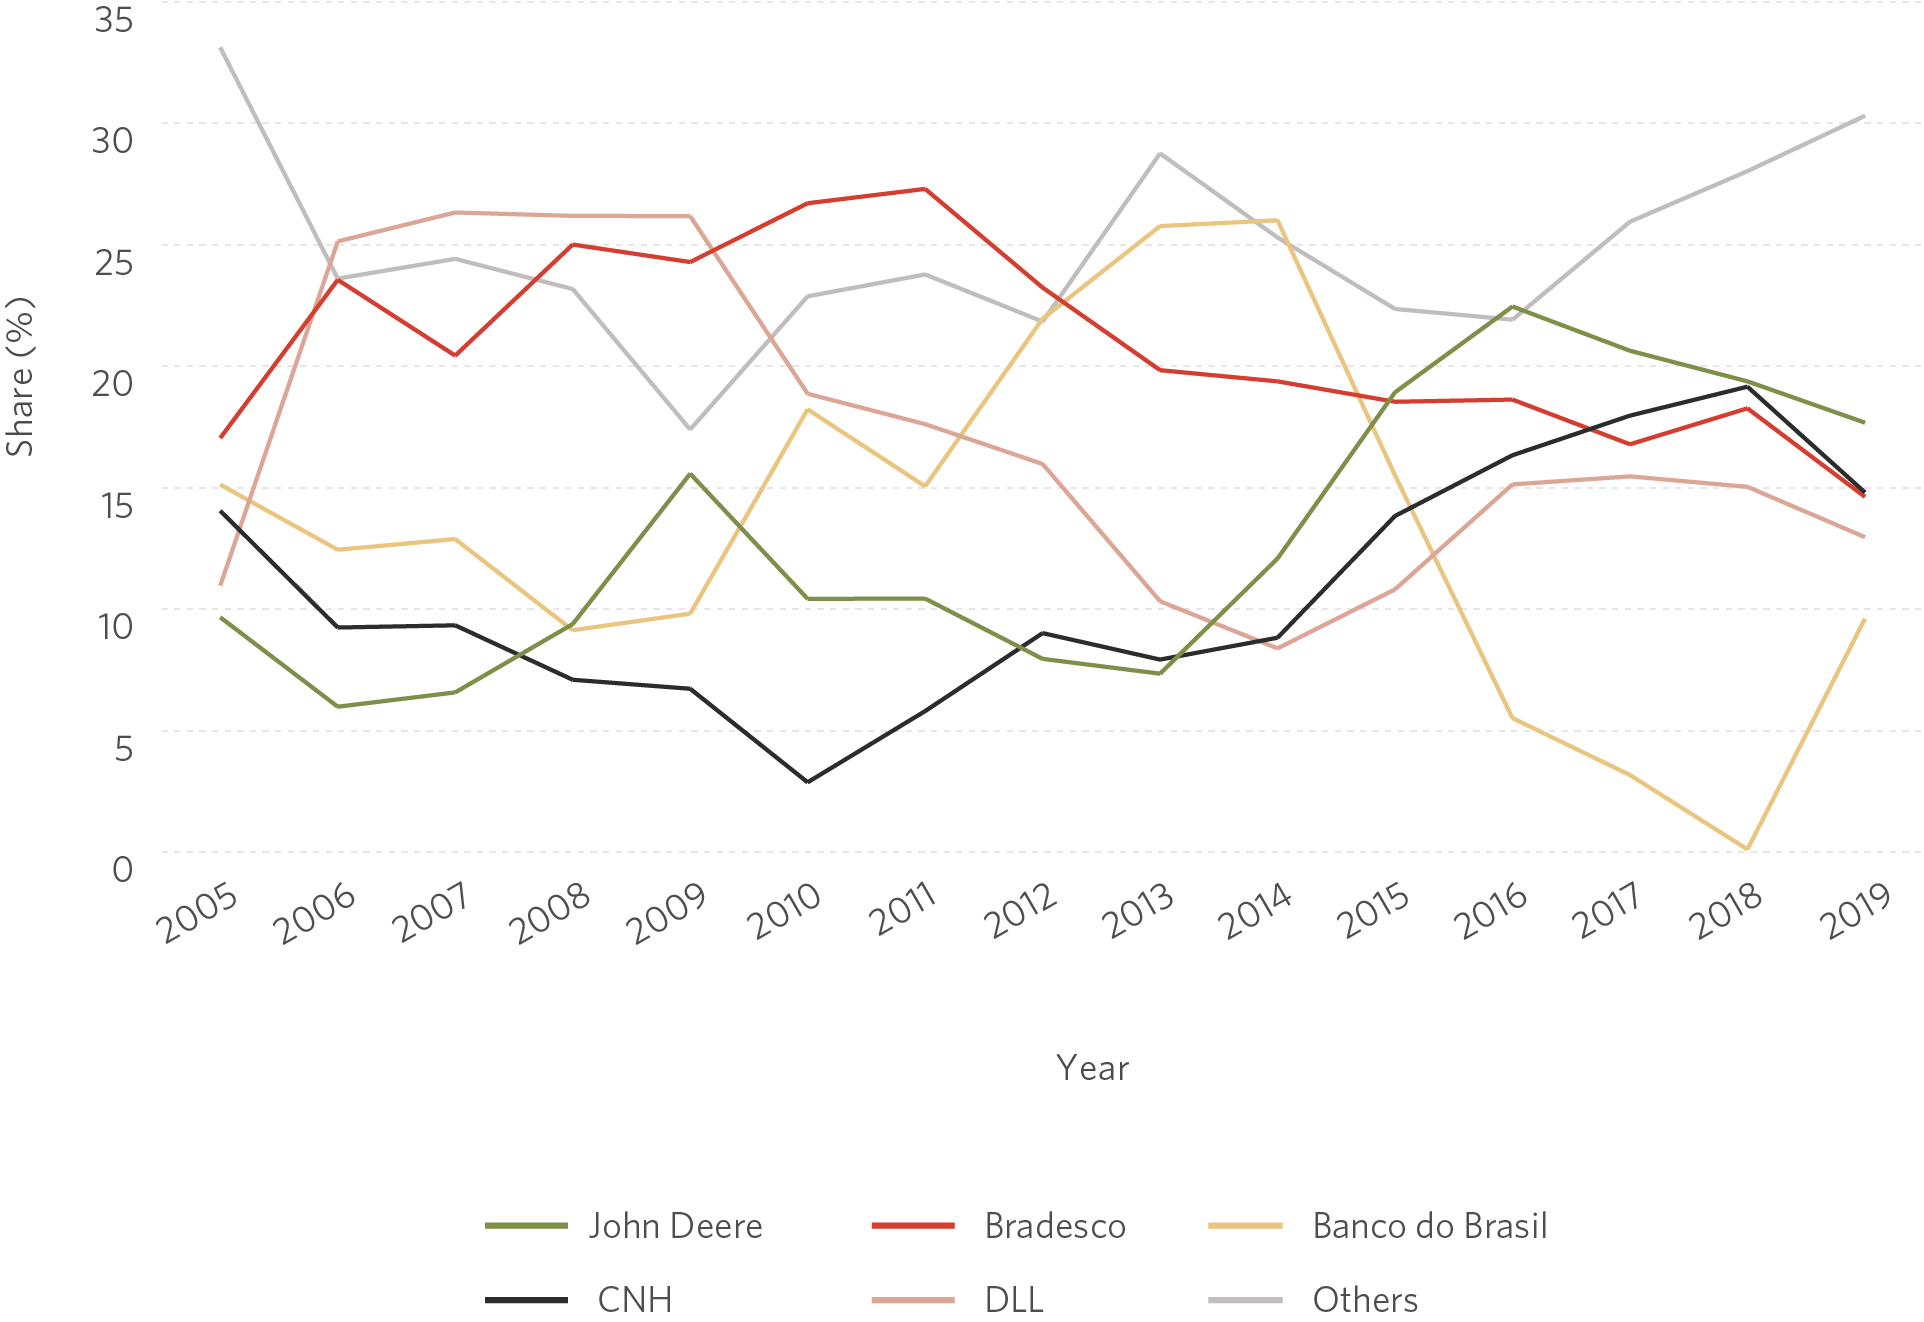
Source: CPI/PUC-Rio with data from BNDES, 2022
The strategy for identifying the impacts of credit in this study uses the variations of credit of financial institutions between years, shown in Figure 3. The interaction between the different distributions of bank branches in the municipalities and each bank’s aggregate credit variation at the national level makes it possible to isolate how much credit variation in the municipality is due to supply factors. For example, if Bradesco has more BNDES resources in a given year, the method considers that municipalities with a greater Bradesco presence are more likely to have more credit available. These components allow for the estimation of the impact of increases in the supply of rural credit for equipment on variables of interest, namely: agricultural production, productivity, and land use.
2. IMPACTS OF EQUIPMENT CREDIT
Estimates of the impact of rural credit for equipment are presented below. The bar graphs represent the estimated impacts of a 1% increase in the supply of municipal credit for equipment on the variables of interest. In technical terms, the estimates are interpreted as elasticities.
The results indicate that rural credit for equipment stimulates agricultural production. Figure 4 shows that a 1% increase in the availability of this type of credit is associated with an increase of 0.02 percentage points (p.p.) in the share of agricultural GDP in total municipal GDP. There is a 0.13% growth in the value of crop production, but the estimated effect on cattle production, represented by the number of head of cattle, is not statistically significant.
Figure 4. Impact of BNDES Rural Credit for Equipment on Agricultural Production, 2005 – 2019
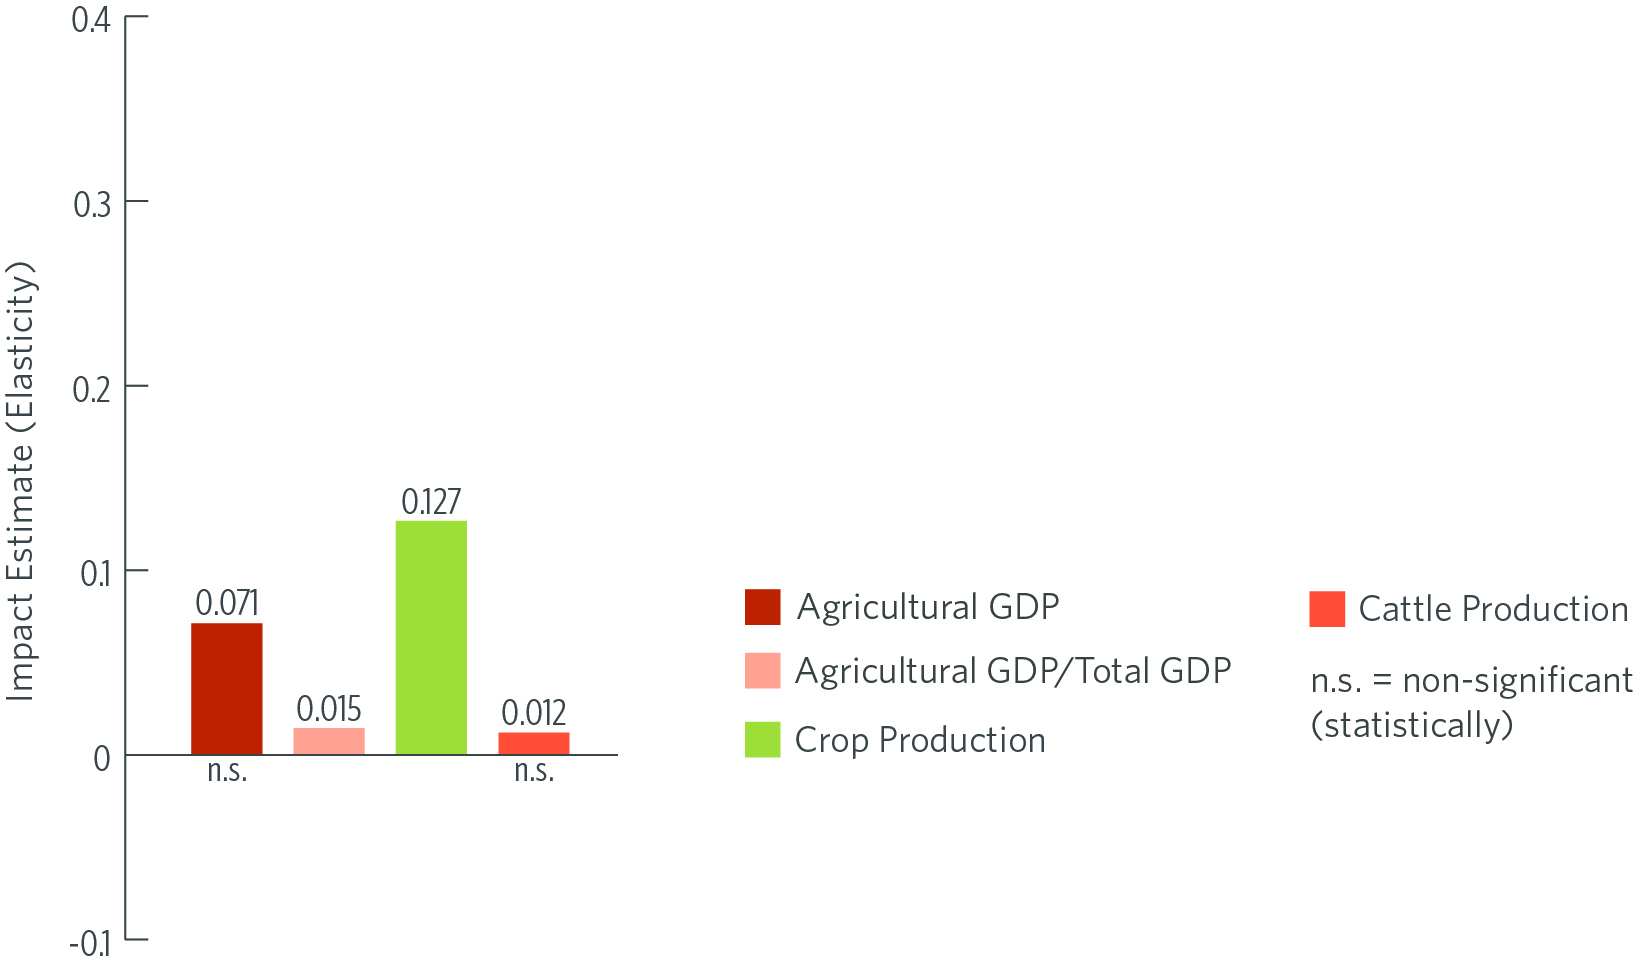
Source: CPI/PUC-Rio with data from BNDES and IBGE, 2022
Figure 5 shows the effects of credit on land use. An increase in the supply of credit does not cause significant changes in the total area devoted to agriculture. However, there is a discrete effect on land allocation between rural activities: a 1% increase in rural credit for equipment leads to a 0.01% increase in the area allocated to crops and a non-significant reduction in the area of pastures. The impact regarding the forest area (including planted forests and natural forests) is positive but not significant. Thus, the results suggest that rural producers do not increase deforestation when more credit is available.
Figure 5. Impact of BNDES Rural Credit for Equipment on Land Use, 2005 – 2019

Source: CPI/PUC-Rio with data from BNDES and MAPBIOMAS Coleção 6.0, 2022
Figure 6 shows that credit acts as an instrument to intensify rural activity. A 1% increase in municipal credit for equipment results in a significant increase of 0.18% in cropland productivity and 0.08% in land productivity for cattle.[10]
Figure 6. Impact of Rural Credit for Equipment on Agricultural Productivity, 2005 – 2019
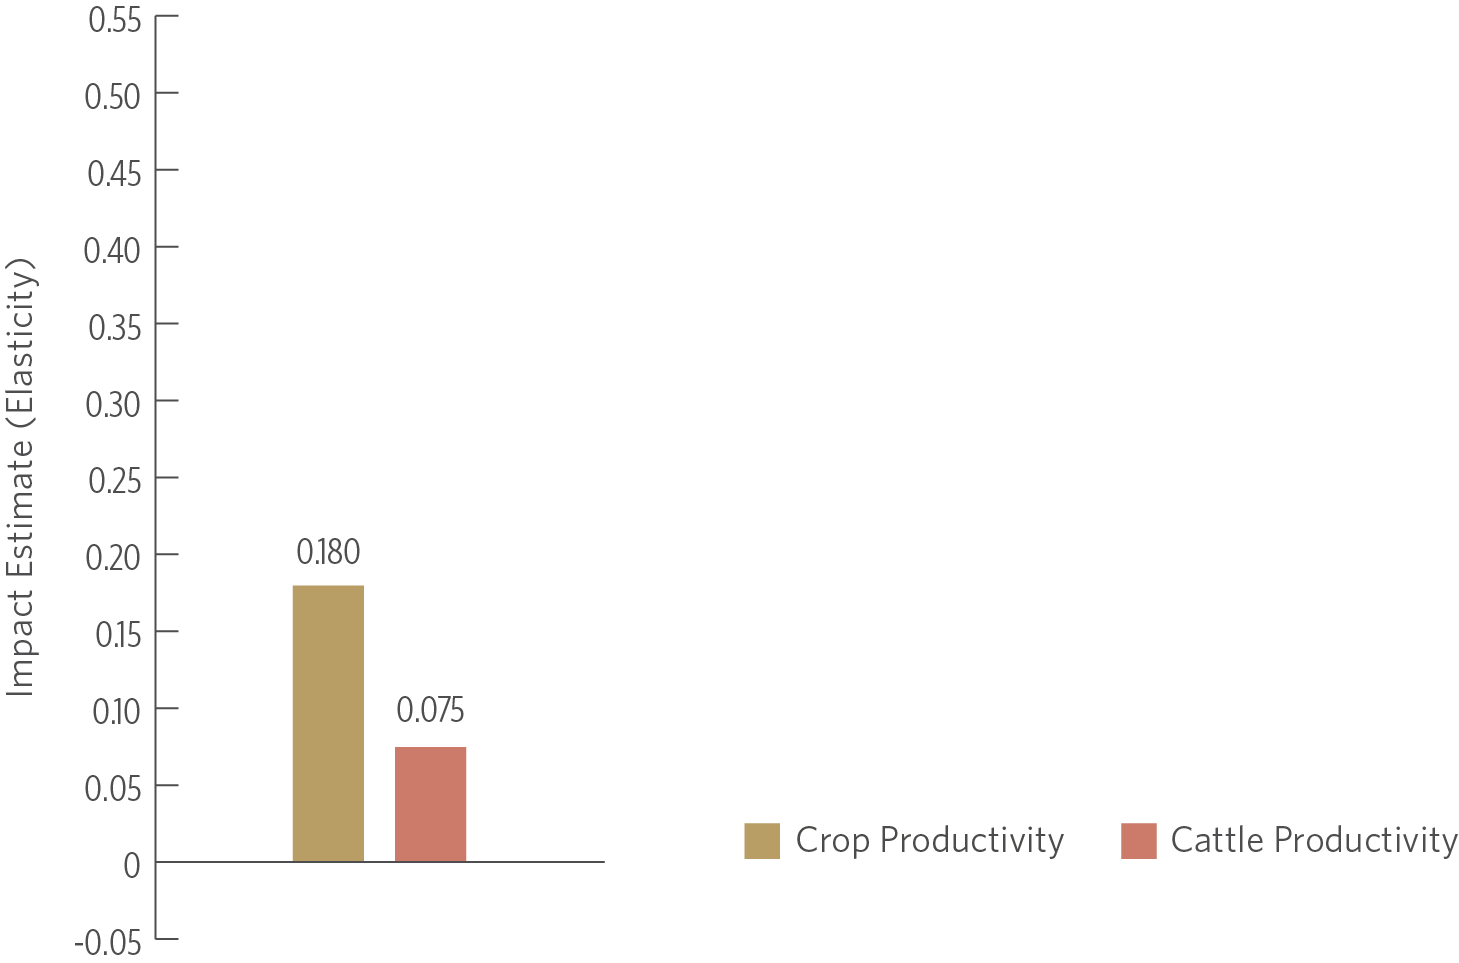
Source: CPI/PUC-Rio with data from BNDES, IBGE and MAPBIOMAS Coleção 6.0, 2022
Therefore, the results indicate that increases in resource availability lead to growth in crop production, but not to significant results in cattle production. Even though cropland takes space from pasture areas, there is no increase in the total area allocated to agriculture and no evidence of increasing deforestation. Consequently, land productivity increases for agriculture. All the analyzed effects are greater for cropland, which is in line with BNDES rural credit for equipment playing a more relevant role in crops.
3. PROFILE OF MUNICIPALITIES ACCORDING TO LABOR INTENSITY
ECONOMIC LITERATURE ON MECHANIZATION OF AGRICULTURE
There is extensive debate in the economic literature about the impacts of mechanization on rural activity. Hayami and Ruttan’s (1970) seminal work on induced innovation explores how the pattern of technological development in crop depends on the local context of each country.[11] From this perspective, the adoption of mechanical inputs, classified as labor-saving, is more intense in countries or regions with a greater shortage of labor.[12] Therefore, the mechanization process would be associated with a reduction in the cost of labor used in crop and, in general, would not significantly impact land productivity.[13]
However, the most recent empirical research reveals that the effects of farming mechanization can be more complex and diverse[14], including positive impacts on land productivity. In the Côte d’Ivoire[15] and Zambia[16], for example, more intensive use of tractors is associated with greater use of complementary inputs, such as fertilizers and other non-mechanical components, as well as increased land productivity. In Myanmar, the rapid mechanization process was driven by several factors besides labor-saving, such as management of climate risks and reduction of production losses.[17] Other studies point out that the results of mechanization also depend on the local institutional context and the design of public policies.[18]
To explore potential differences in the impact of credit for equipment in Brazil, this section deepens the previous analysis by dividing Brazilian municipalities into two types: more labor-intensive and less labor-intensive. More labor-intensive municipalities have a ratio of the number of rural workers per area allocated to agriculture above the median.[19] Municipalities below the median, in turn, are deemed less labor-intensive.
Labor intensity is analyzed geographically in Figure 7 for 2006.[20] Less labor-intensive municipalities are shown in shades of red. In dark red are the 25% municipalities with the lowest intensity; in light red are the municipalities between the 25th and 50th percentile. More labor-intensive municipalities are shown in shades of blue. In light blue are the municipalities between the 50th and 75th percentile. In dark blue are the municipalities above the 75th percentile. The figure reveals that less labor-intensive municipalities are located mainly in the North and Midwest regions. The Northeast, Southeast, and South regions have high availability of rural workers in relation to the area allocated to agriculture.
Figure 7. Distribution of Rural Workers over Agriculture Area, 2006
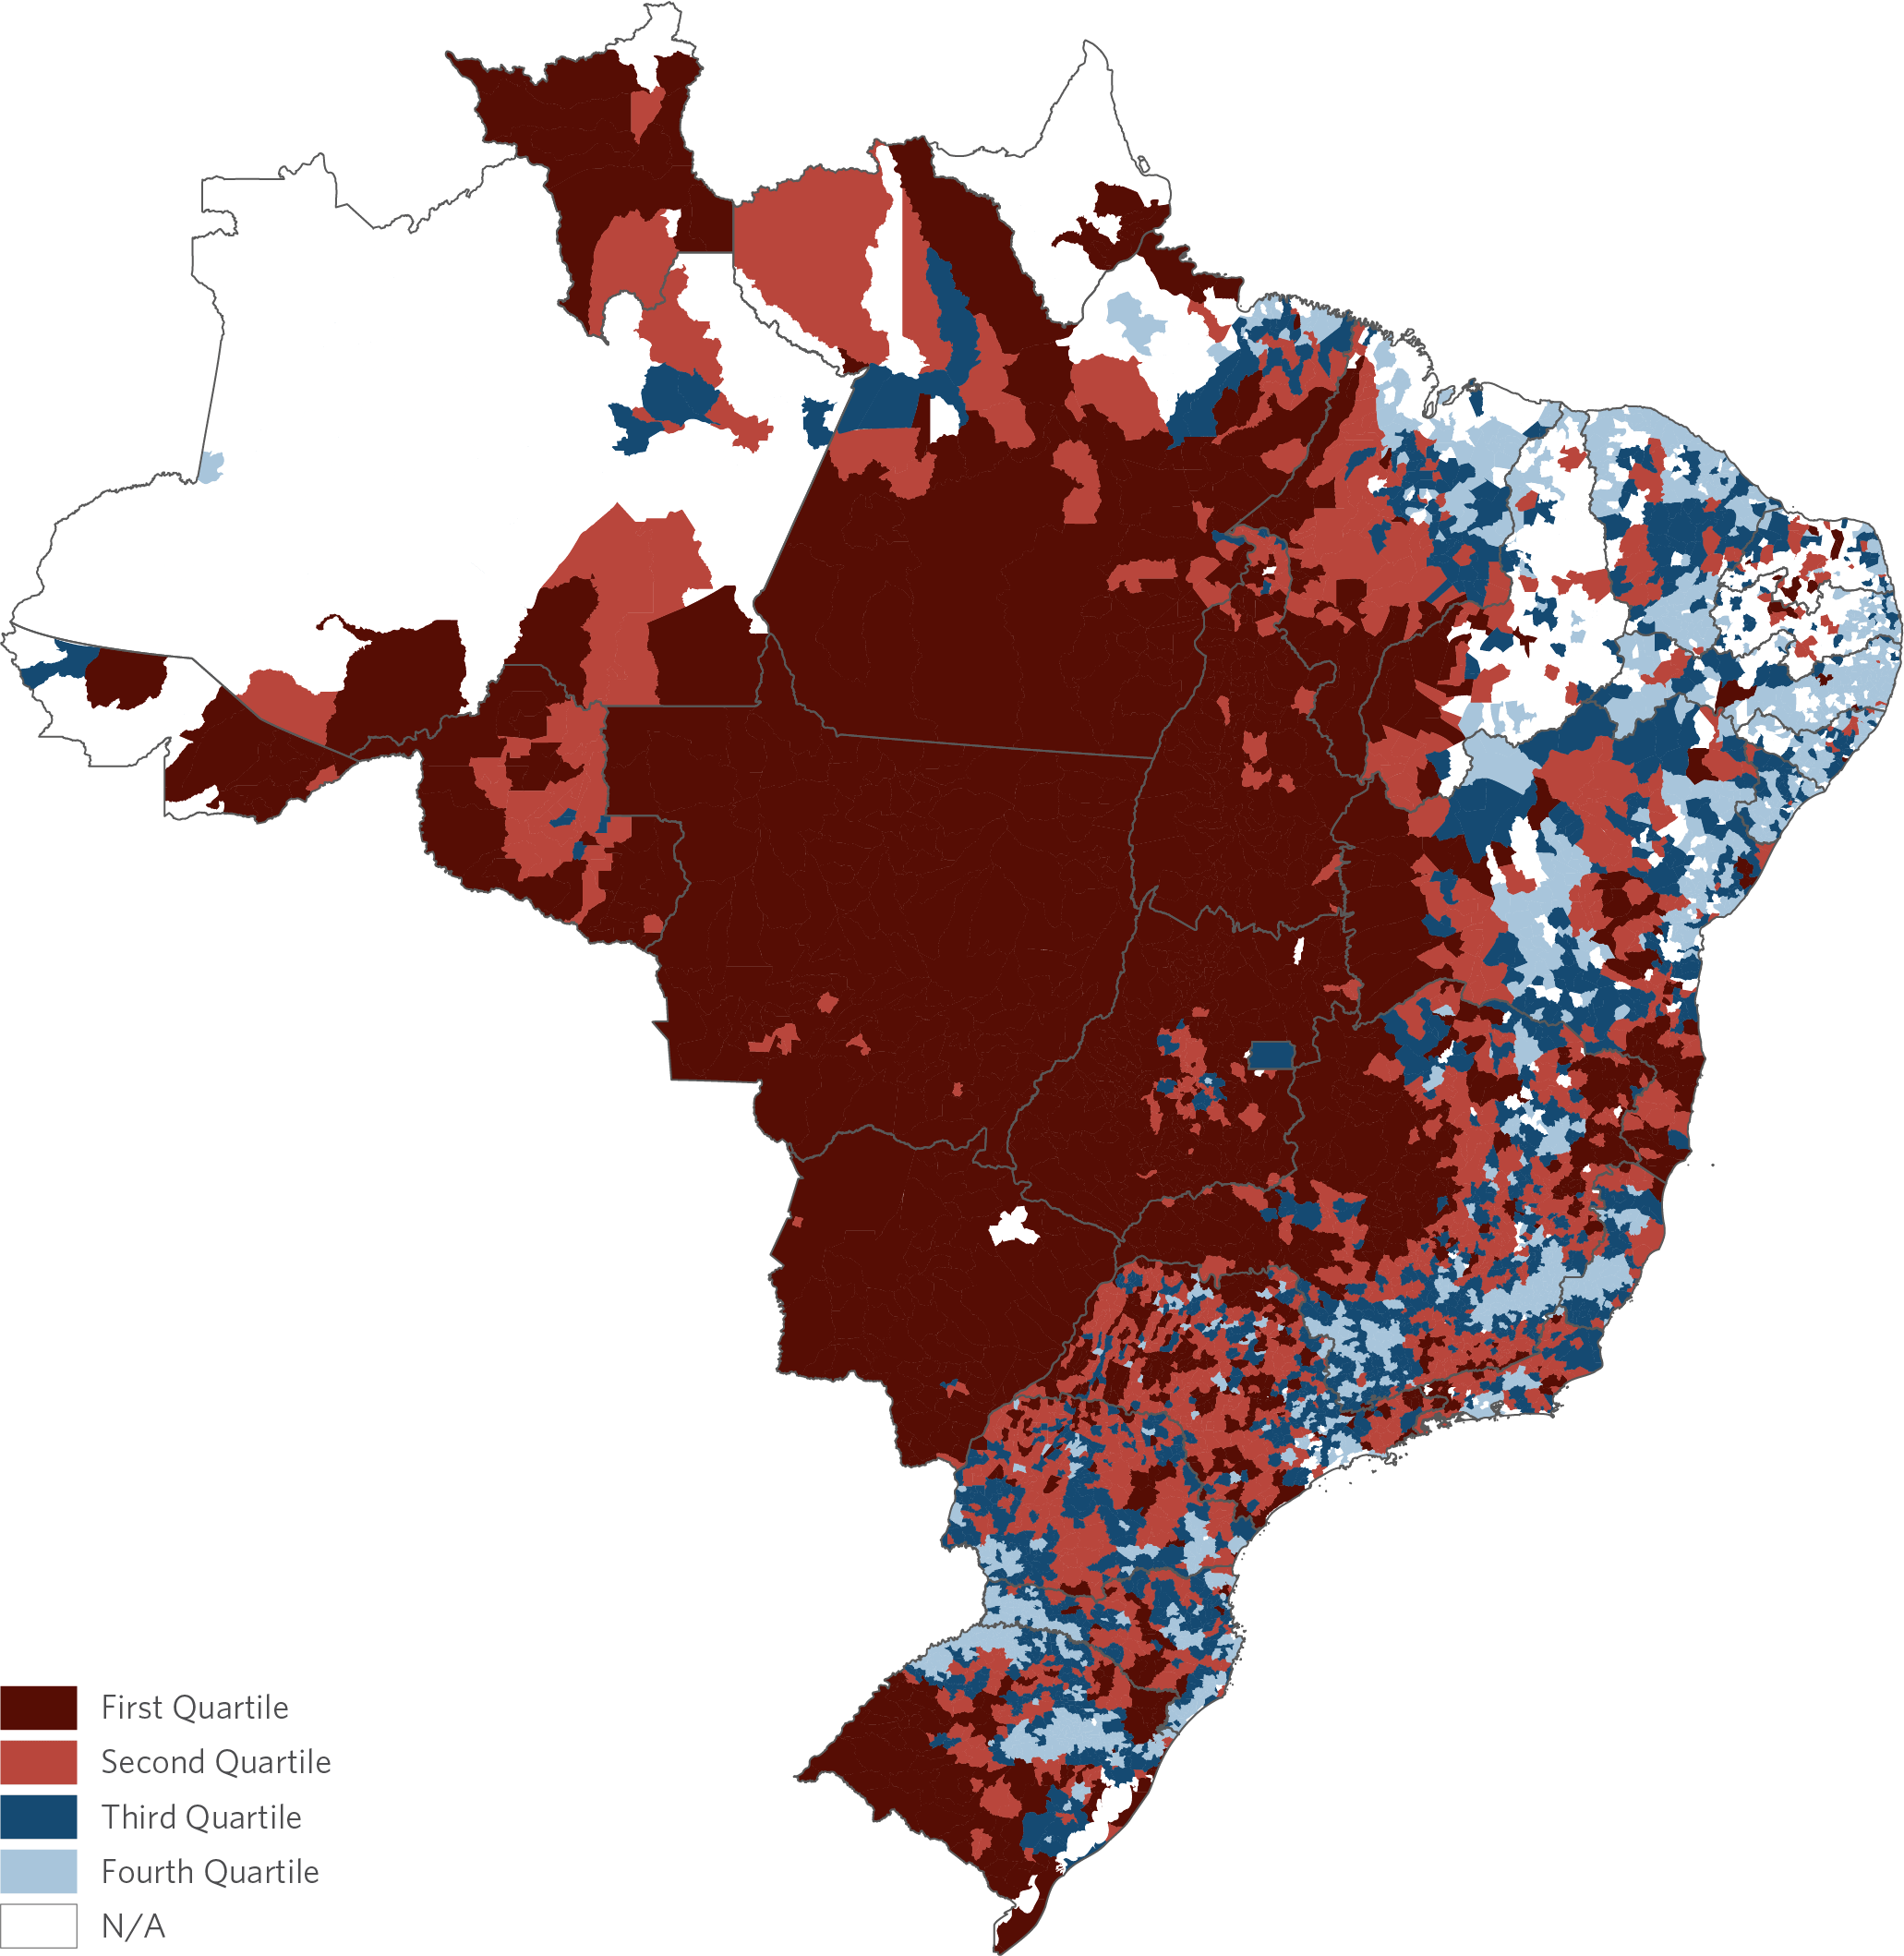
Source: CPI/PUC-Rio with data from the IBGE Agricultural Census (2006), 2022
4. IMPACTS OF EQUIPMENT CREDIT BY MUNICIPALITY PROFILE
In this section, the impact analysis estimates based on the median separate the municipalities into above and below the 50th percentile. As for the estimates considering the quartiles, only the municipalities above the 75th percentile and below the 25th percentile are included. The aim, in this case, is to capture the most distinguishing effects of these two types of municipalities.
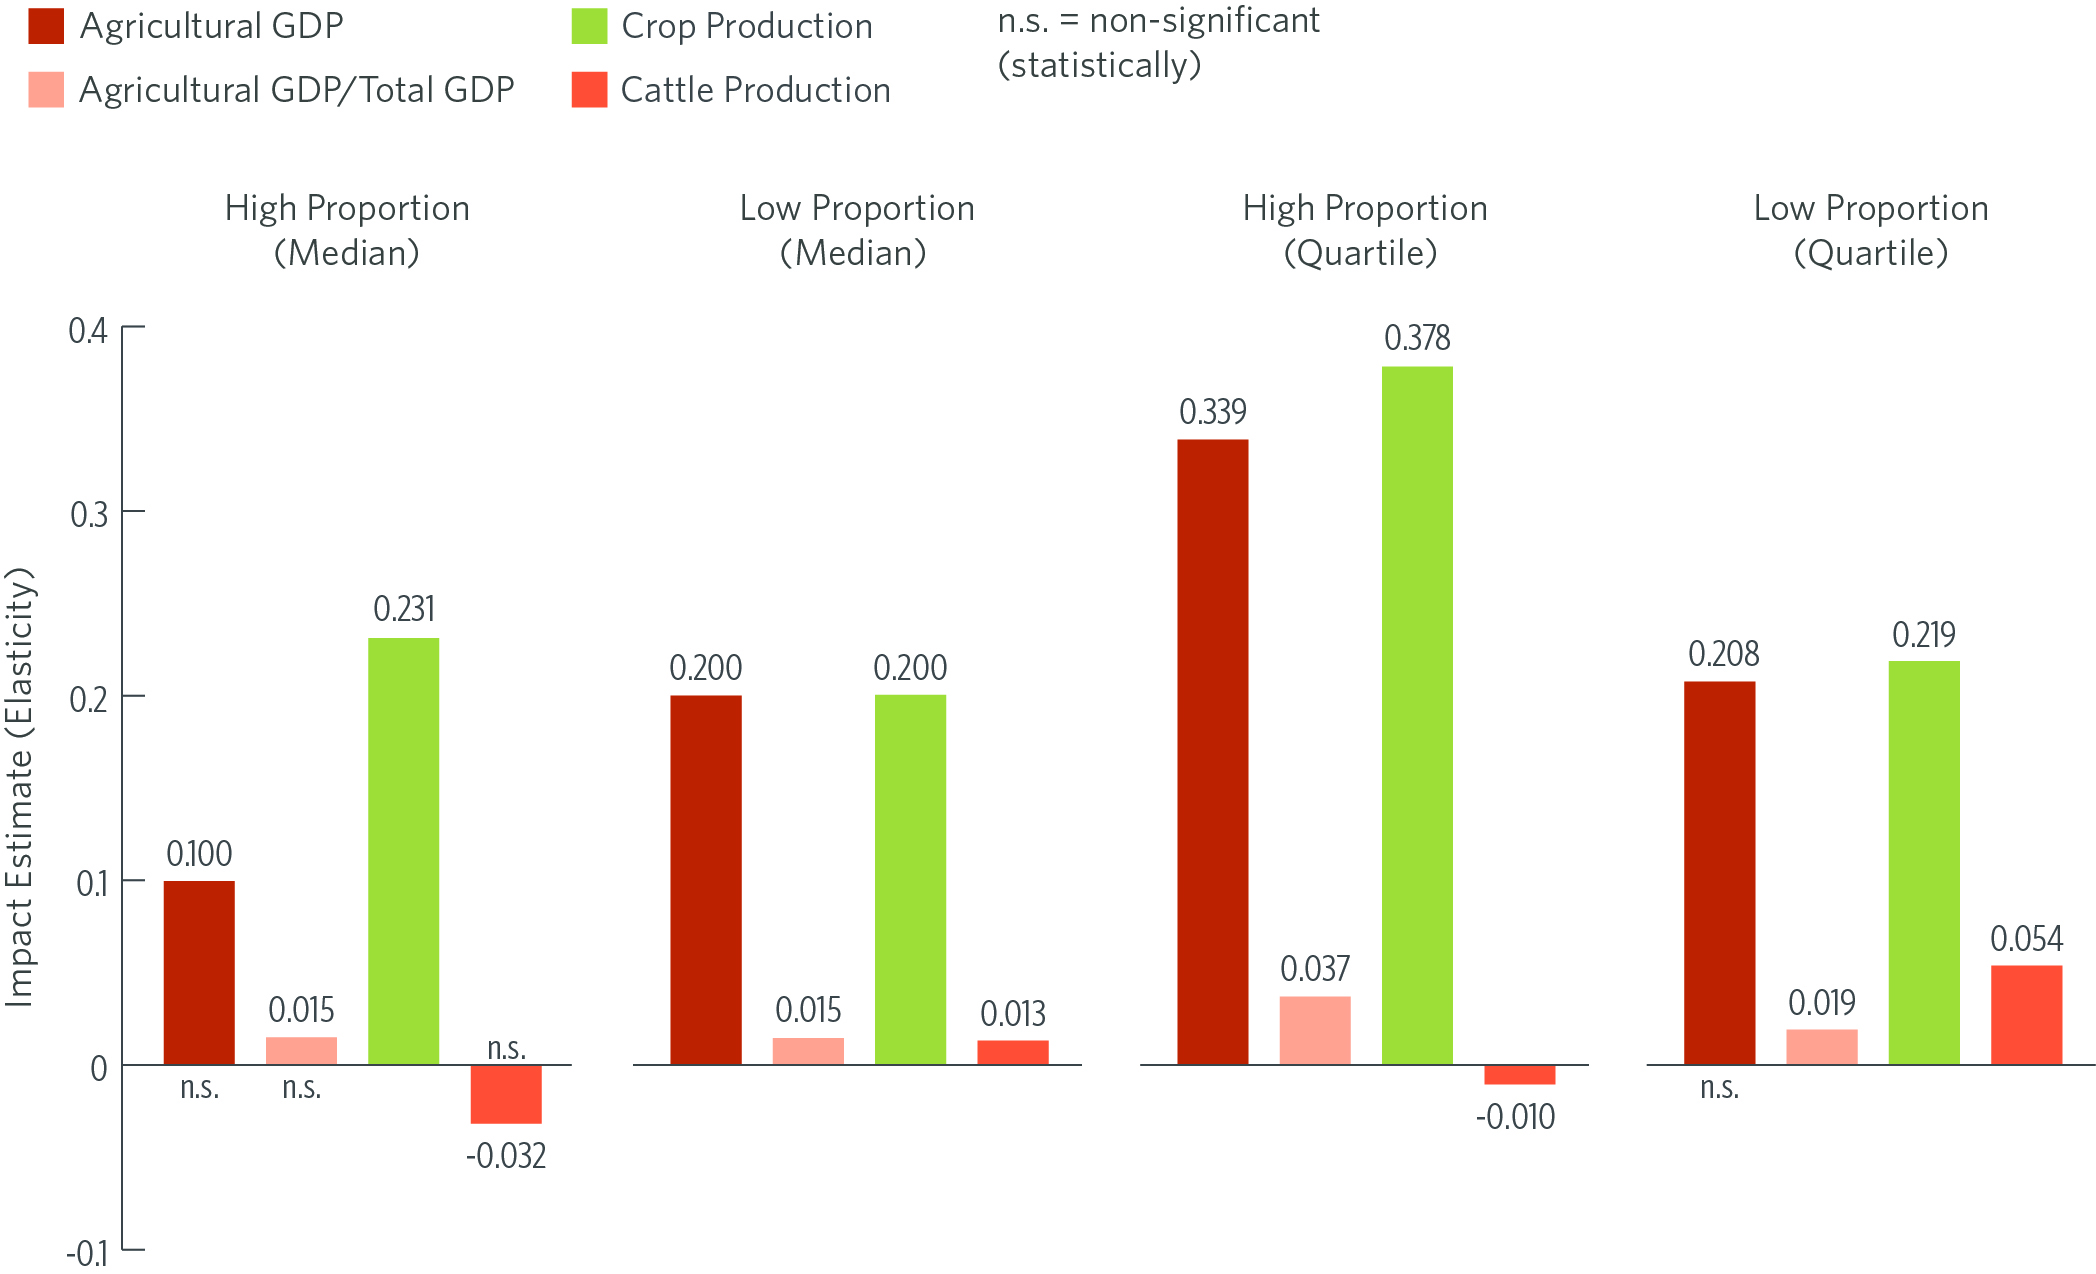
Figure 8 shows the estimated impacts of rural credit for equipment on agricultural production among municipalities with different labor intensities. The figure shows estimates for the specification based on the median and for the specification based on the upper and lower quartiles. In regressions based on the median, an increase in the availability of rural credit in municipalities with a high proportion of workers per area leads to growth in all production variables: for a 1% increase in credit, there is a 0.19% increase in agricultural GDP, a 0.02 p.p. increase in the share of agricultural GDP over total GDP, a 0.09% increase in crop production, and a 0.06% increase in cattle production. In less labor-intensive municipalities, a 1% increase in credit leads to a 0.11% growth in cattle production. There are no significant impacts on agricultural GDP, the share of agricultural GDP over total GDP, and crop production. In analysis that employ the upper and lower quartiles, the effects follow the same trend and, in general, are greater compared to estimates based on the median.
Figure 8. Impact of BNDES Rural Credit for Equipment on Agricultural Production – by Municipality Profile, 2005 – 2019
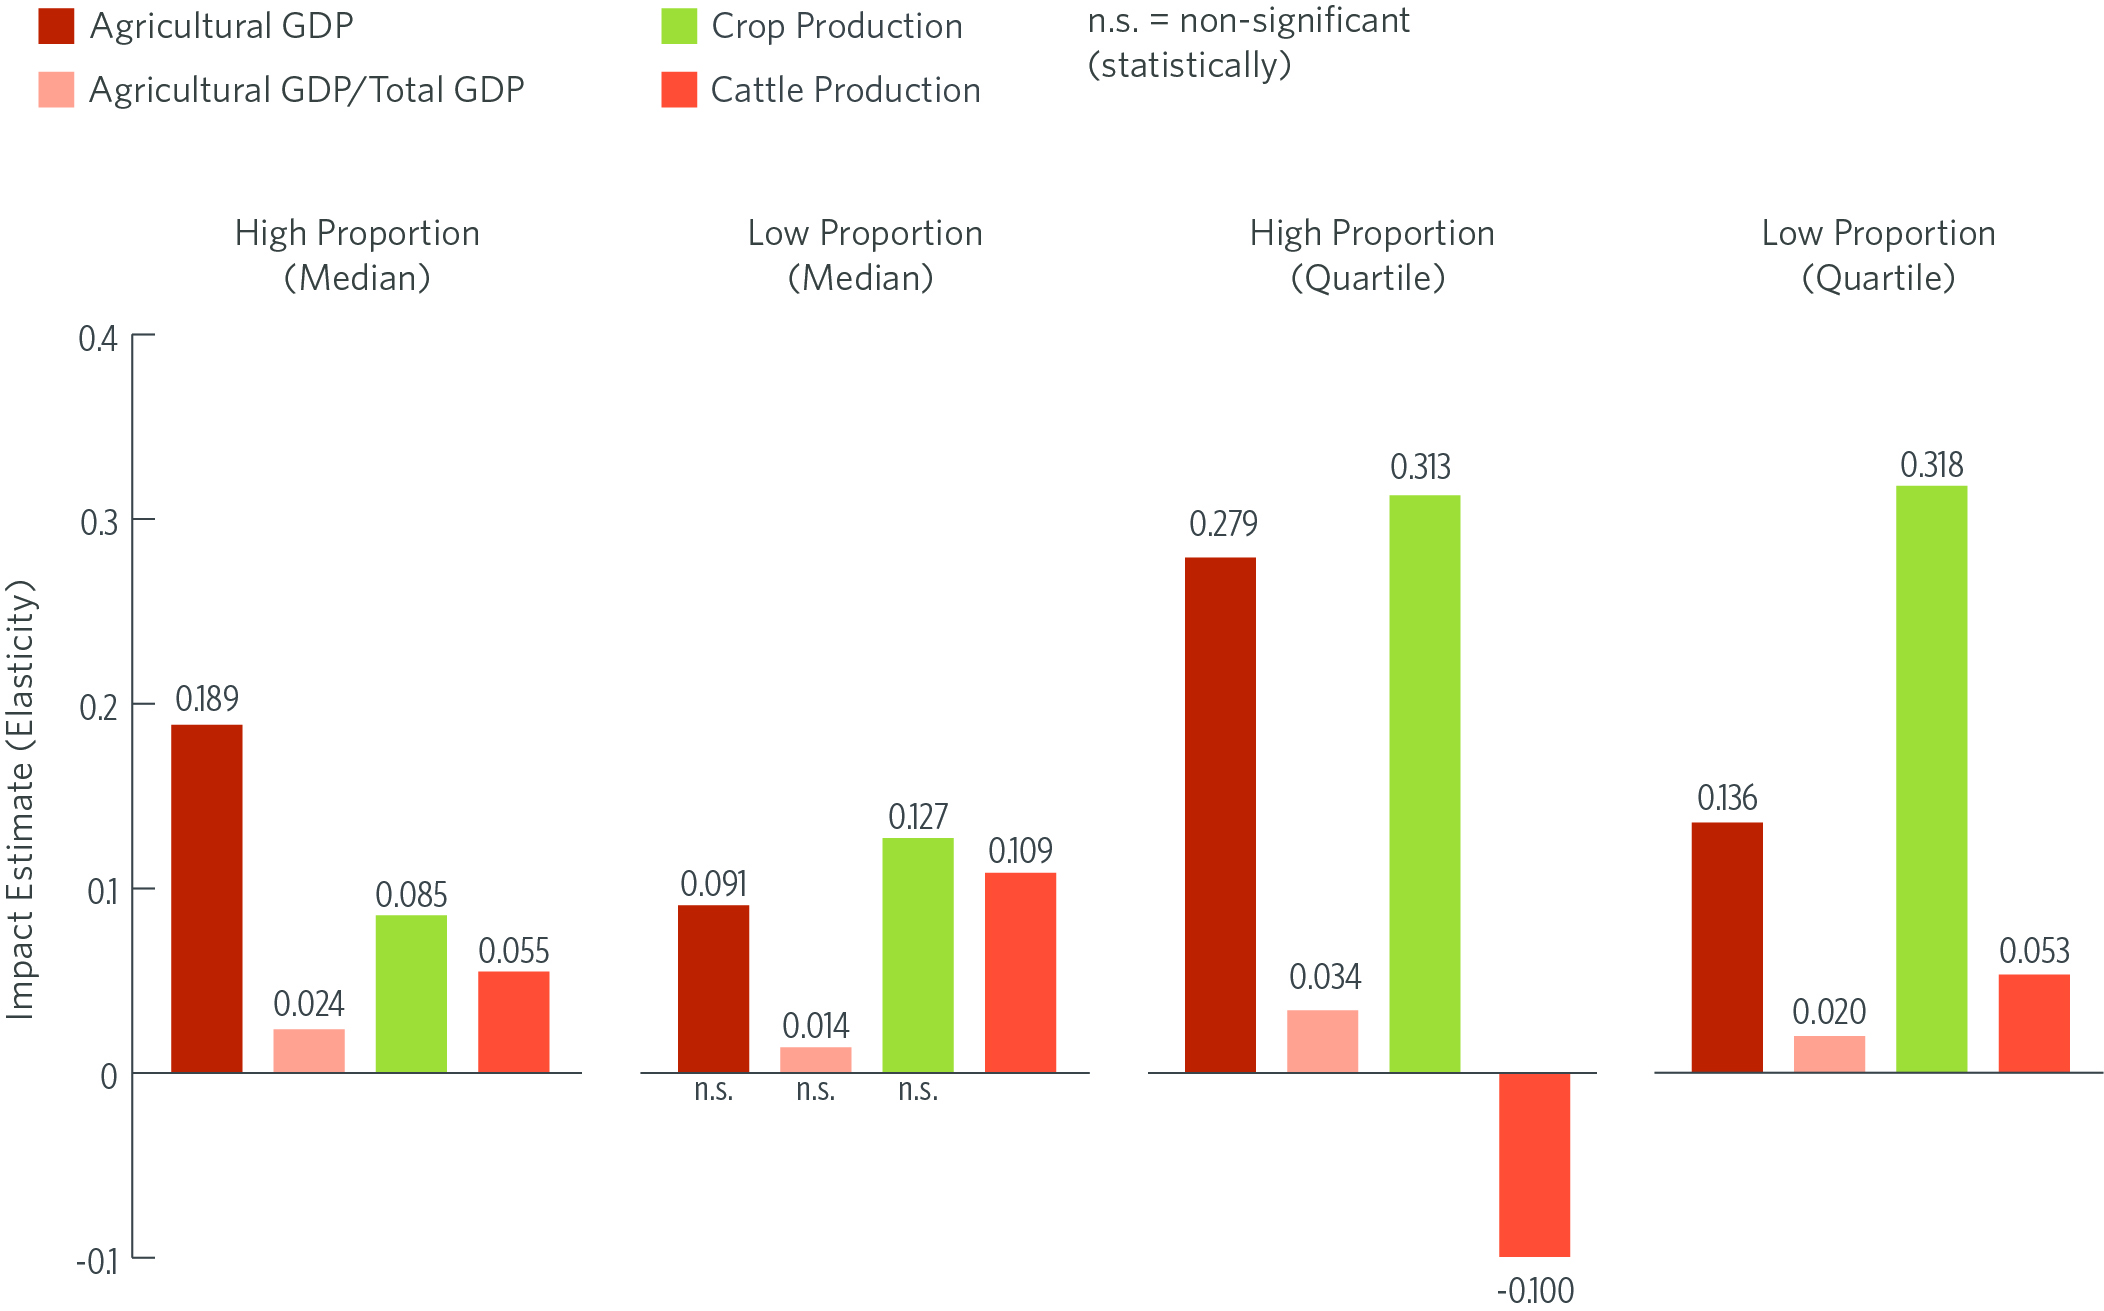
Note: Municipalities are classified as having a high proportion of workers per area or a low proportion of workers per area.
Source: CPI/PUC-Rio with data from BNDES and IBGE, 2022
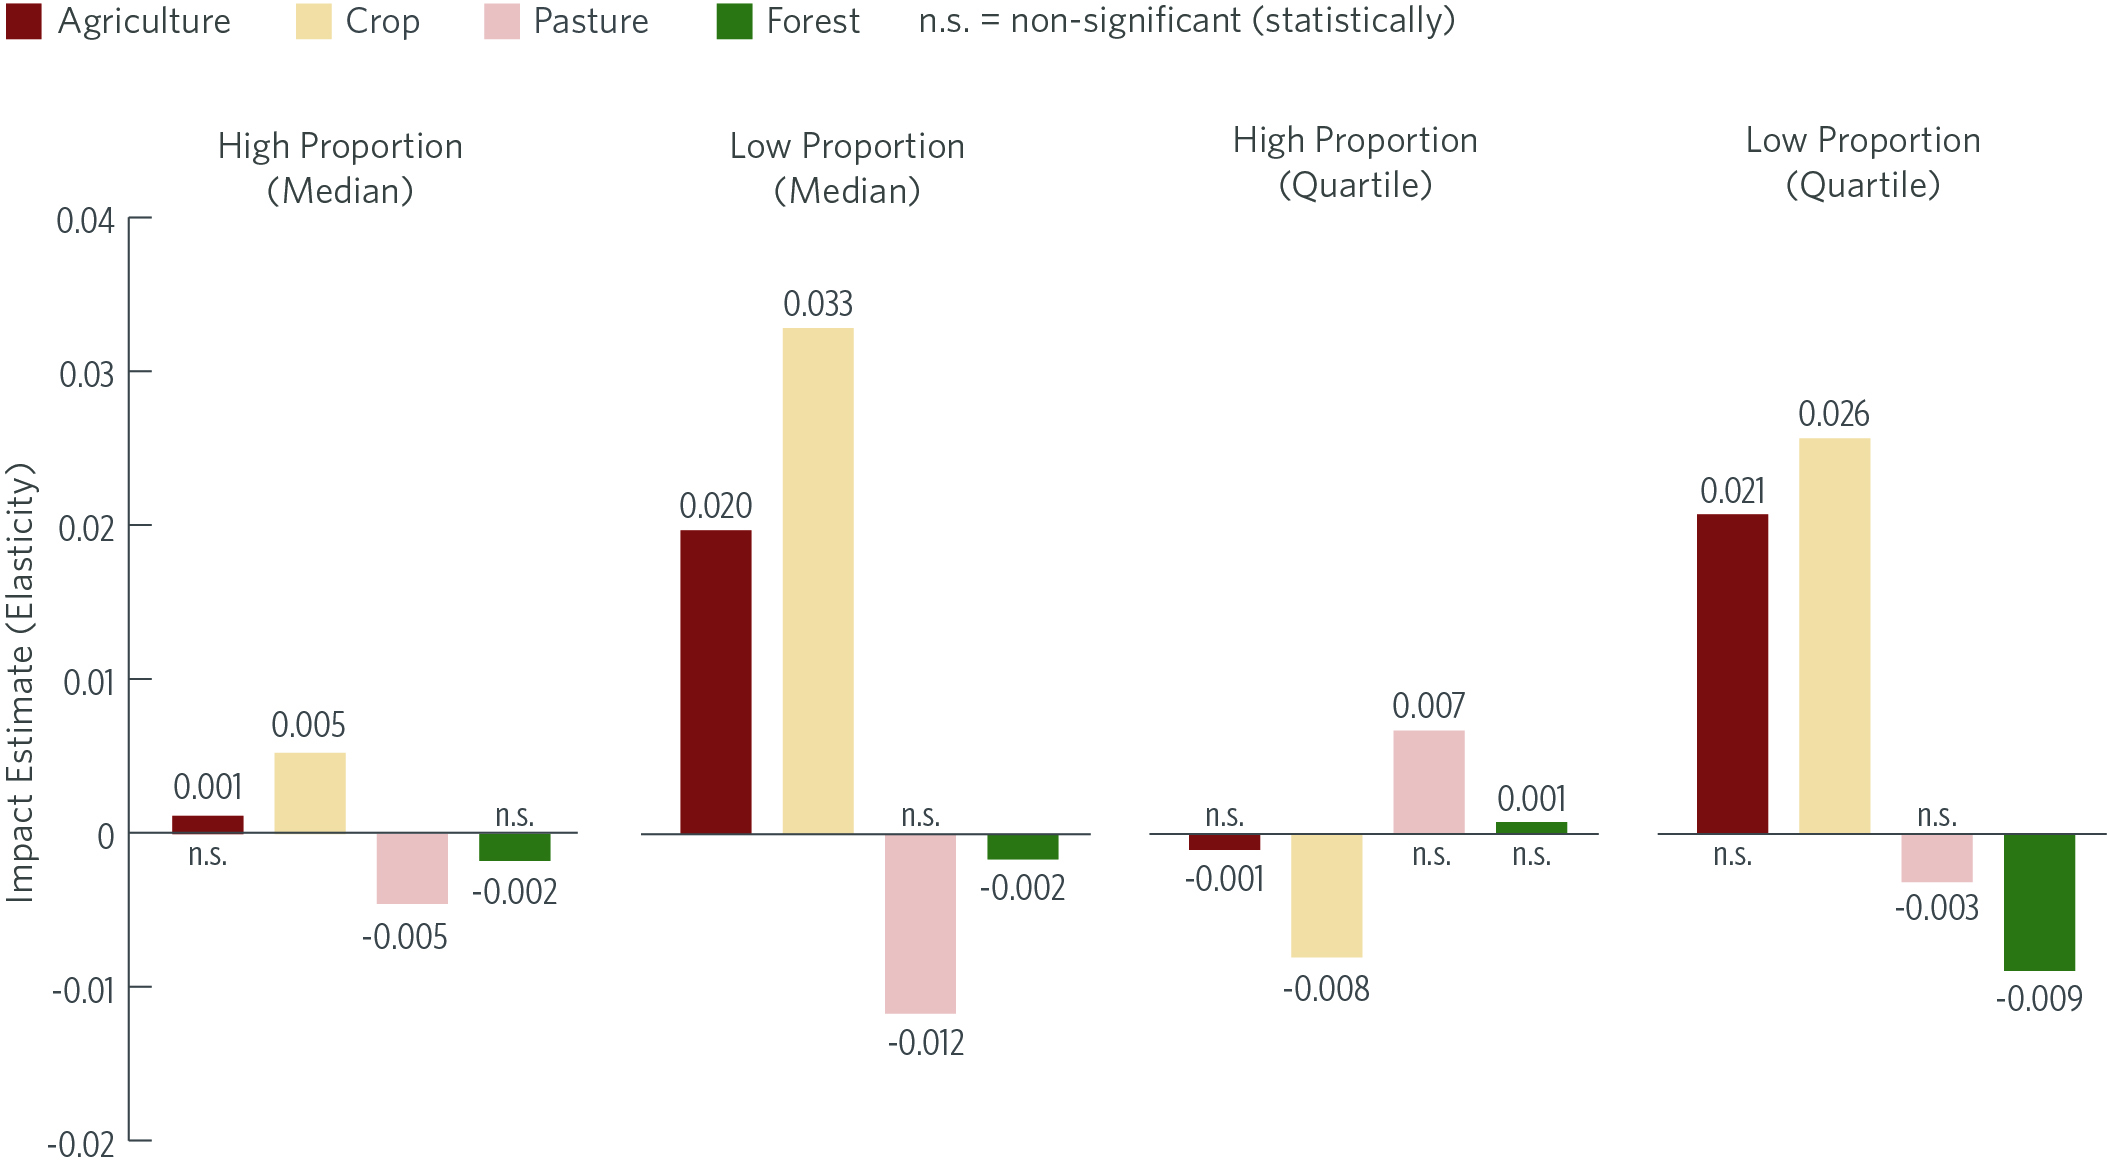
Figure 9 shows estimates of the impact on land use. In the median-based specification, there are no significant effects on land use in municipalities with a high proportion of workers per area. In municipalities with a low proportion of workers per area, an increase of 1% in credit is associated with an increase in areas allocated to crops (0.01%), as well as a slight – but significant – increase in the total area of agriculture (0.002%). In the analysis by quartile, the municipalities with a high proportion of workers per area show a decrease in the areas of agriculture (-0.01%) and crops (-0.01%), and an increase in forest area (0.004%). In less labor-intense municipalities, there is an increase in crop area (0.02%) and a reduction in the area allocated to livestock (-0.02%) and forest area (-0.003%). Therefore, there is evidence of a small increase in deforestation when credit is expanded only to the subgroup of municipalities with the lowest proportions of workers per area.
Figure 9. Impact of BNDES Rural Credit for Equipment on Land Use by Municipality Profile, 2005 – 2019
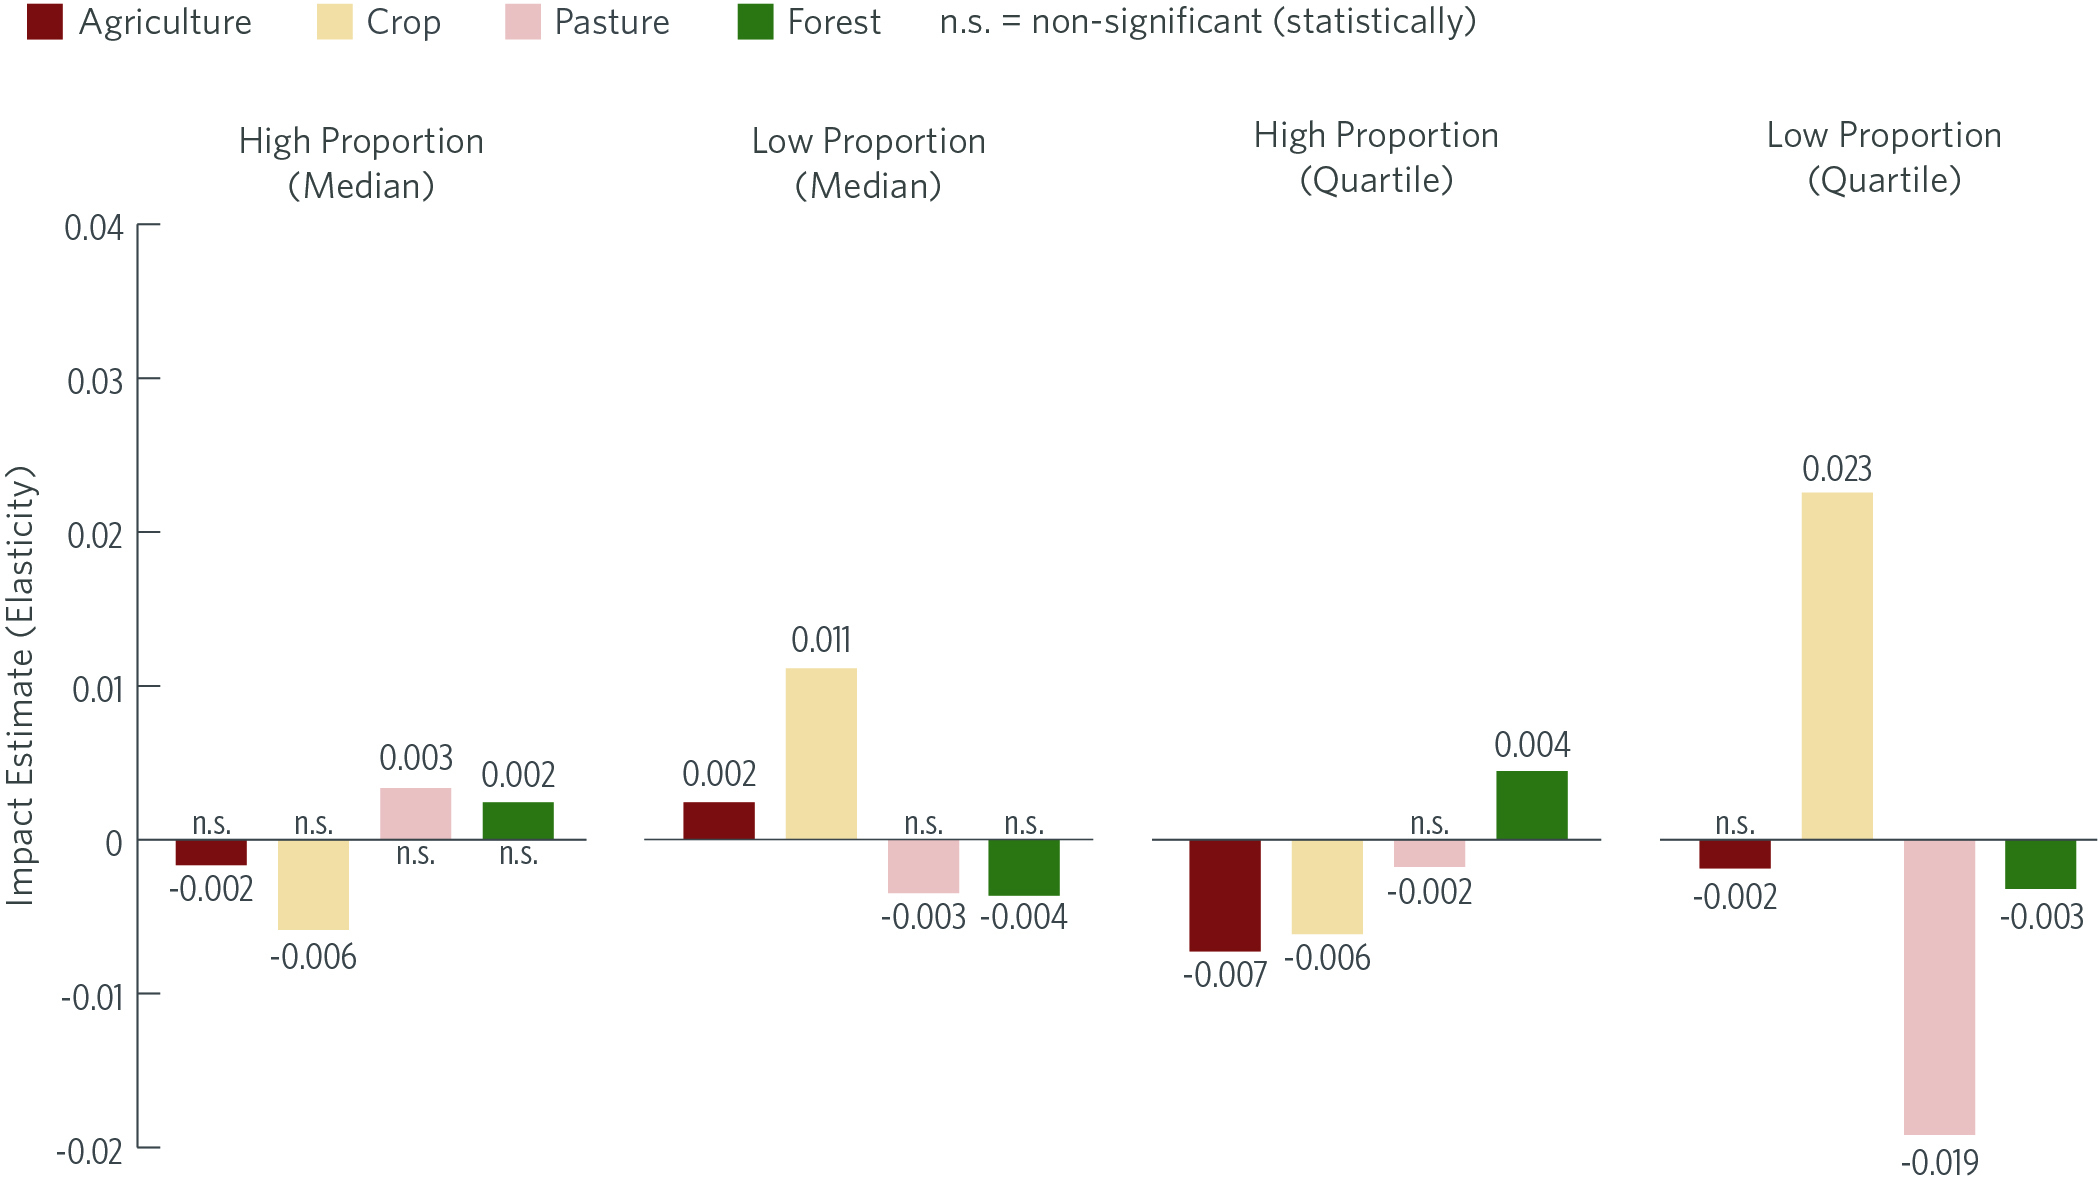
Note: Municipalities are classified as having a high proportion of workers per area or a low proportion of workers per area.
Source: CPI/PUC-Rio with data from BNDES and MAPBIOMAS Coleção 6.0, 2022
Figure 10 shows the impacts of credit on productivity variables. For more labor-intense municipalities, according to the median-based specification, there is a significant growth of 0.22% in crop productivity. Considering less labor-intensive municipalities, an increase of 1% does not significantly impact on crop productivity but leads to a rise of 0.14% in cattle productivity. In the quartile analysis, there is a 0.38% increase in crop productivity and stability in cattle productivity for municipalities with a high proportion of workers per area. At the same time, there is a 0.30% increase in crop productivity and a 0.12% increase in cattle productivity in municipalities with a low proportion of workers per area. Thus, crop productivity increases relatively more than cattle productivity in more labor-intense municipalities. For less labor-intense municipalities, productivity increases only for cattle.
Figure 10. Impact of BNDES Rural Credit for Equipment on Agricultural Productivity by Municipality Profile, 2005 – 2019
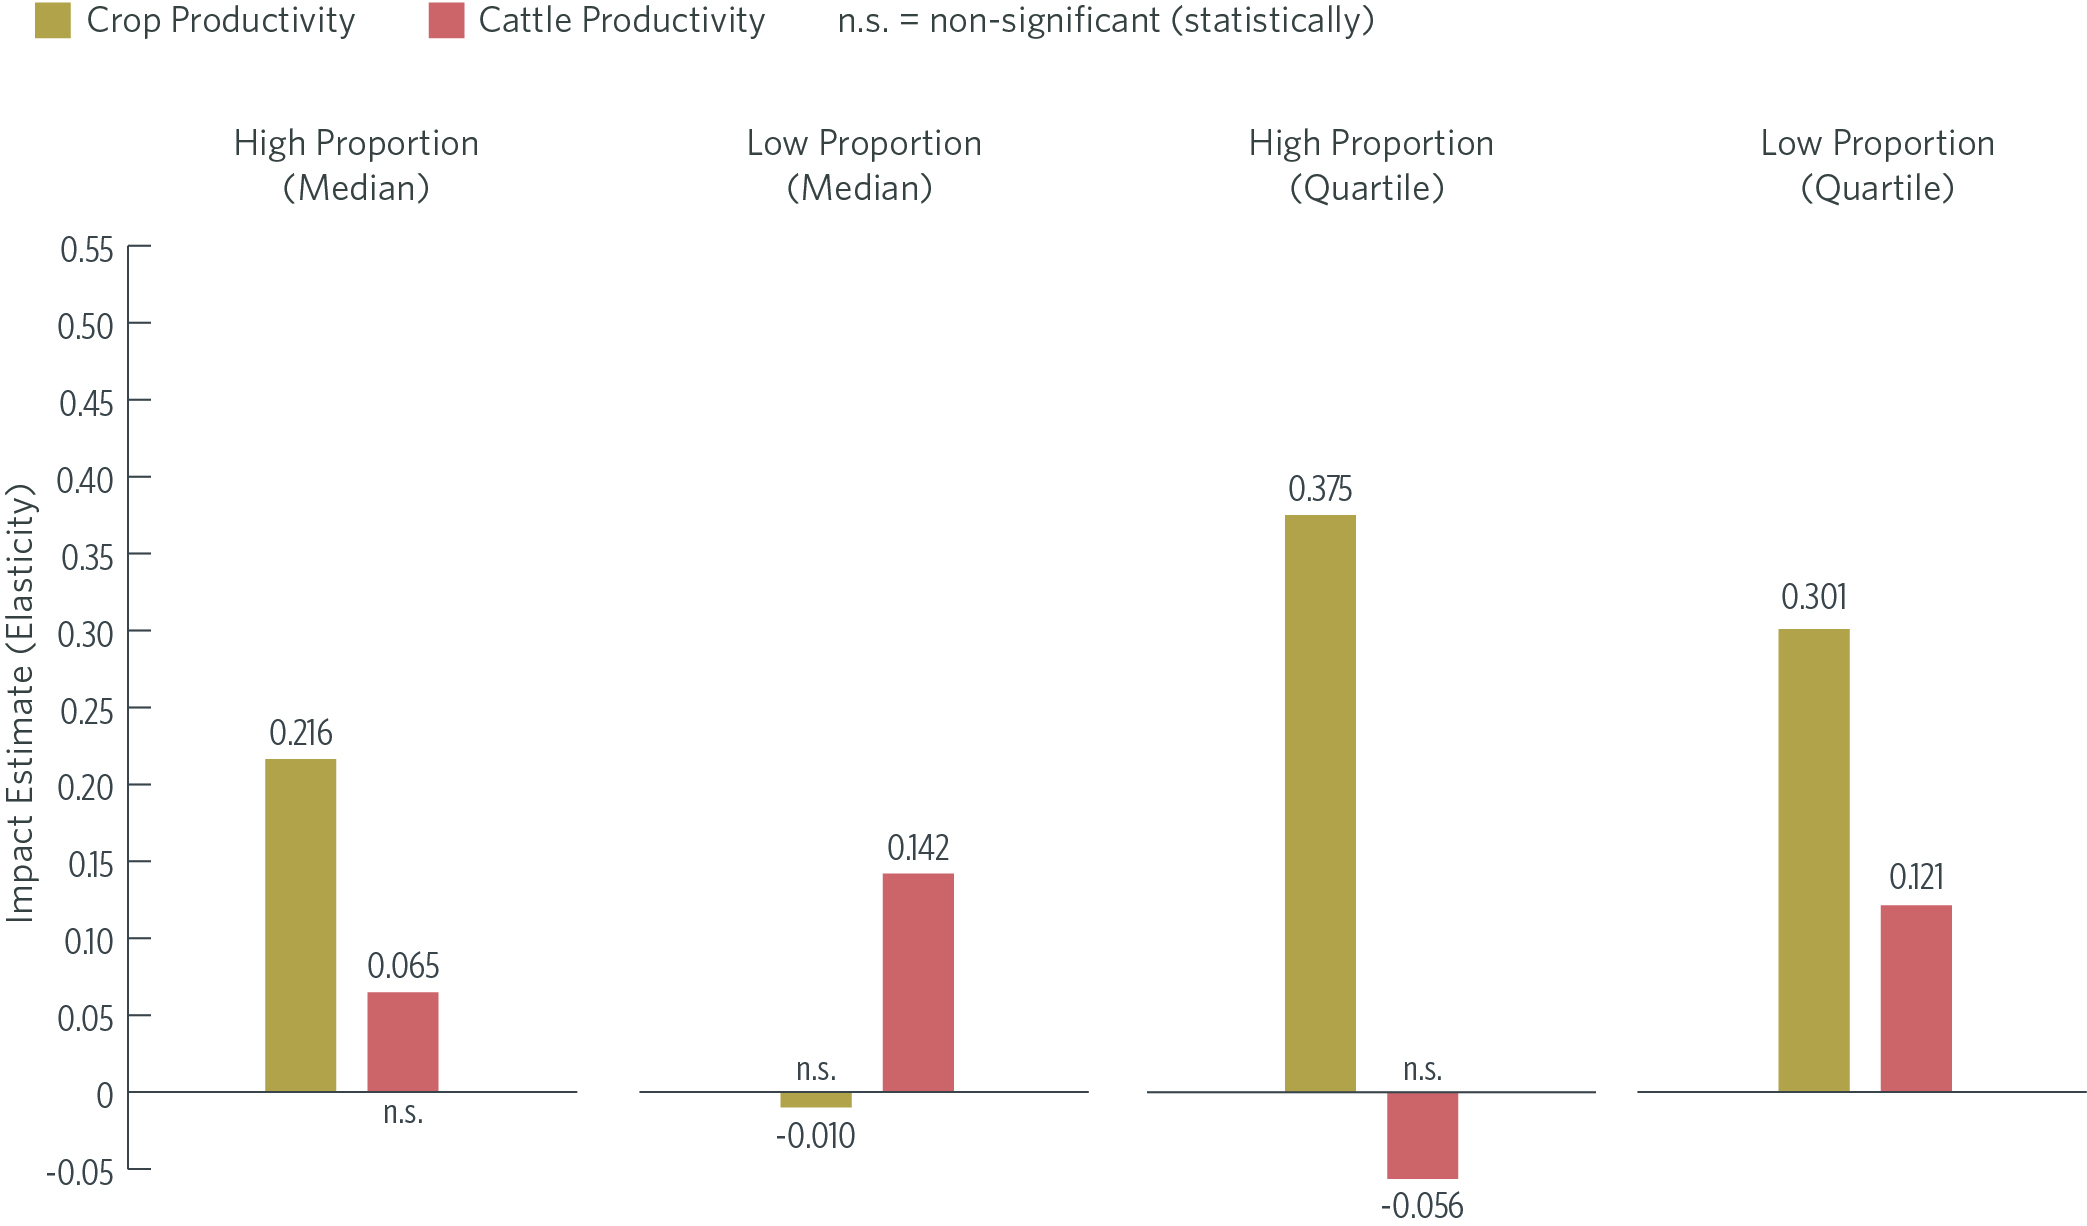
Note: Municipalities are classified as having a high proportion of workers per area or a low proportion of workers per area.
Source: CPI/PUC-Rio with data from BNDES, IBGE and MAPBIOMAS Coleção 6.0, 2022
Therefore, the disaggregated analysis reveals that credit for equipment has different impacts on different profiles of municipalities. For example, more labor-intense municipalities have more significant responses in production compared to land-use variables, which can be explained by the fact that land is a scarcer production factor due to more consolidated occupation in these locations. In addition, in these municipalities, crop productivity shows more significant increases than cattle productivity.
5. IMPACTS OF CREDIT FOR LABORSAVING EQUIPMENT BY MUNICIPALITY PROFILE
In addition to considering the differences between municipalities, this section restricts the analysis to credit for the acquisition of labor-saving equipment. This category constitutes most of the credit for equipment and includes tractors, harvesters, and soil preparation equipment. Between 2005 and 2019, the category of labor-saving equipment accounted for 68% of credit for equipment.
Figure 11 shows the effects of this credit on agricultural production. In the specification based on municipalities above the median in the use of labor, a 1% increase in credit leads to a 0.23% increase in crop production and non-significant variations in the other production indicators. For municipalities with a low proportion of workers per area, there is an increase of 0.20% in both the agricultural GDP and crop production and 0.01% in cattle production. There is an increase of 0.01 p.p. for the share of agricultural GDP over total GDP. In the analysis of the upper and lower quartiles, the effects are stronger. In more labor-intensive municipalities, growth is 0.34% of agricultural GDP, 0.04 p.p. in the share of agricultural GDP over total GDP, and 0.38% of crop production. There is also a 0.01% reduction in cattle production. In less labor-intensive municipalities, the share of agriculture in GDP increases by 0.02 p.p., crop production increases by 0.22%, and cattle production by 0.05%.
Figure 11. Impact of BNDES Rural Credit for Laborsaving Equipment on Agricultural Production by Municipality Profile, 2005 – 2019
Note: Municipalities are classified as having a high proportion of workers per area or a low proportion of workers per area.
Source: CPI/PUC-Rio with data from BNDES and IBGE, 2022
Figure 12 shows the impacts of credit for labor-saving equipment on land use. In the median-based specification, there is an increase in the area devoted to crops and a reduction in the area devoted to cattle. The effects are stronger for less labor-intensive municipalities. These greater effects on land use in less labor-intensive municipalities are to be expected, as they are areas where land is more abundant and land uses are less consolidated, as in the Midwest and North of the country. In the quartile-based specification, there is a decrease of 0.01% in crop areas in more labor-intensive municipalities. For the quartile of less labor-intensive municipalities, there is a 0.03% increase in crop areas and a 0.01% decrease in forest areas.
Figure 12. Impact of BNDES Rural Credit for Labor-Saving Equipment on Land Use by Municipality Profile, 2005 – 2019
Note: Municipalities are classified as having a high proportion of workers per area or a low proportion of workers per area.
Source: CPI/PUC-Rio with data from BNDES and MAPBIOMAS Coleção 6.0, 2022
Figure 13 shows the impacts of credit for labor-saving equipment on agricultural productivity. There is an increase in crop productivity in all regressions, and the effect is stronger when analyzing more labor-intensive municipalities and in the quartile-based specification. For cattle productivity, there is a significant increase only in less labor-intensive municipalities.
Figure 13. Impact of BNDES Rural Credit for Labor-Saving Equipment on Agricultural Productivity by Municipality Profile, 2005 – 2019
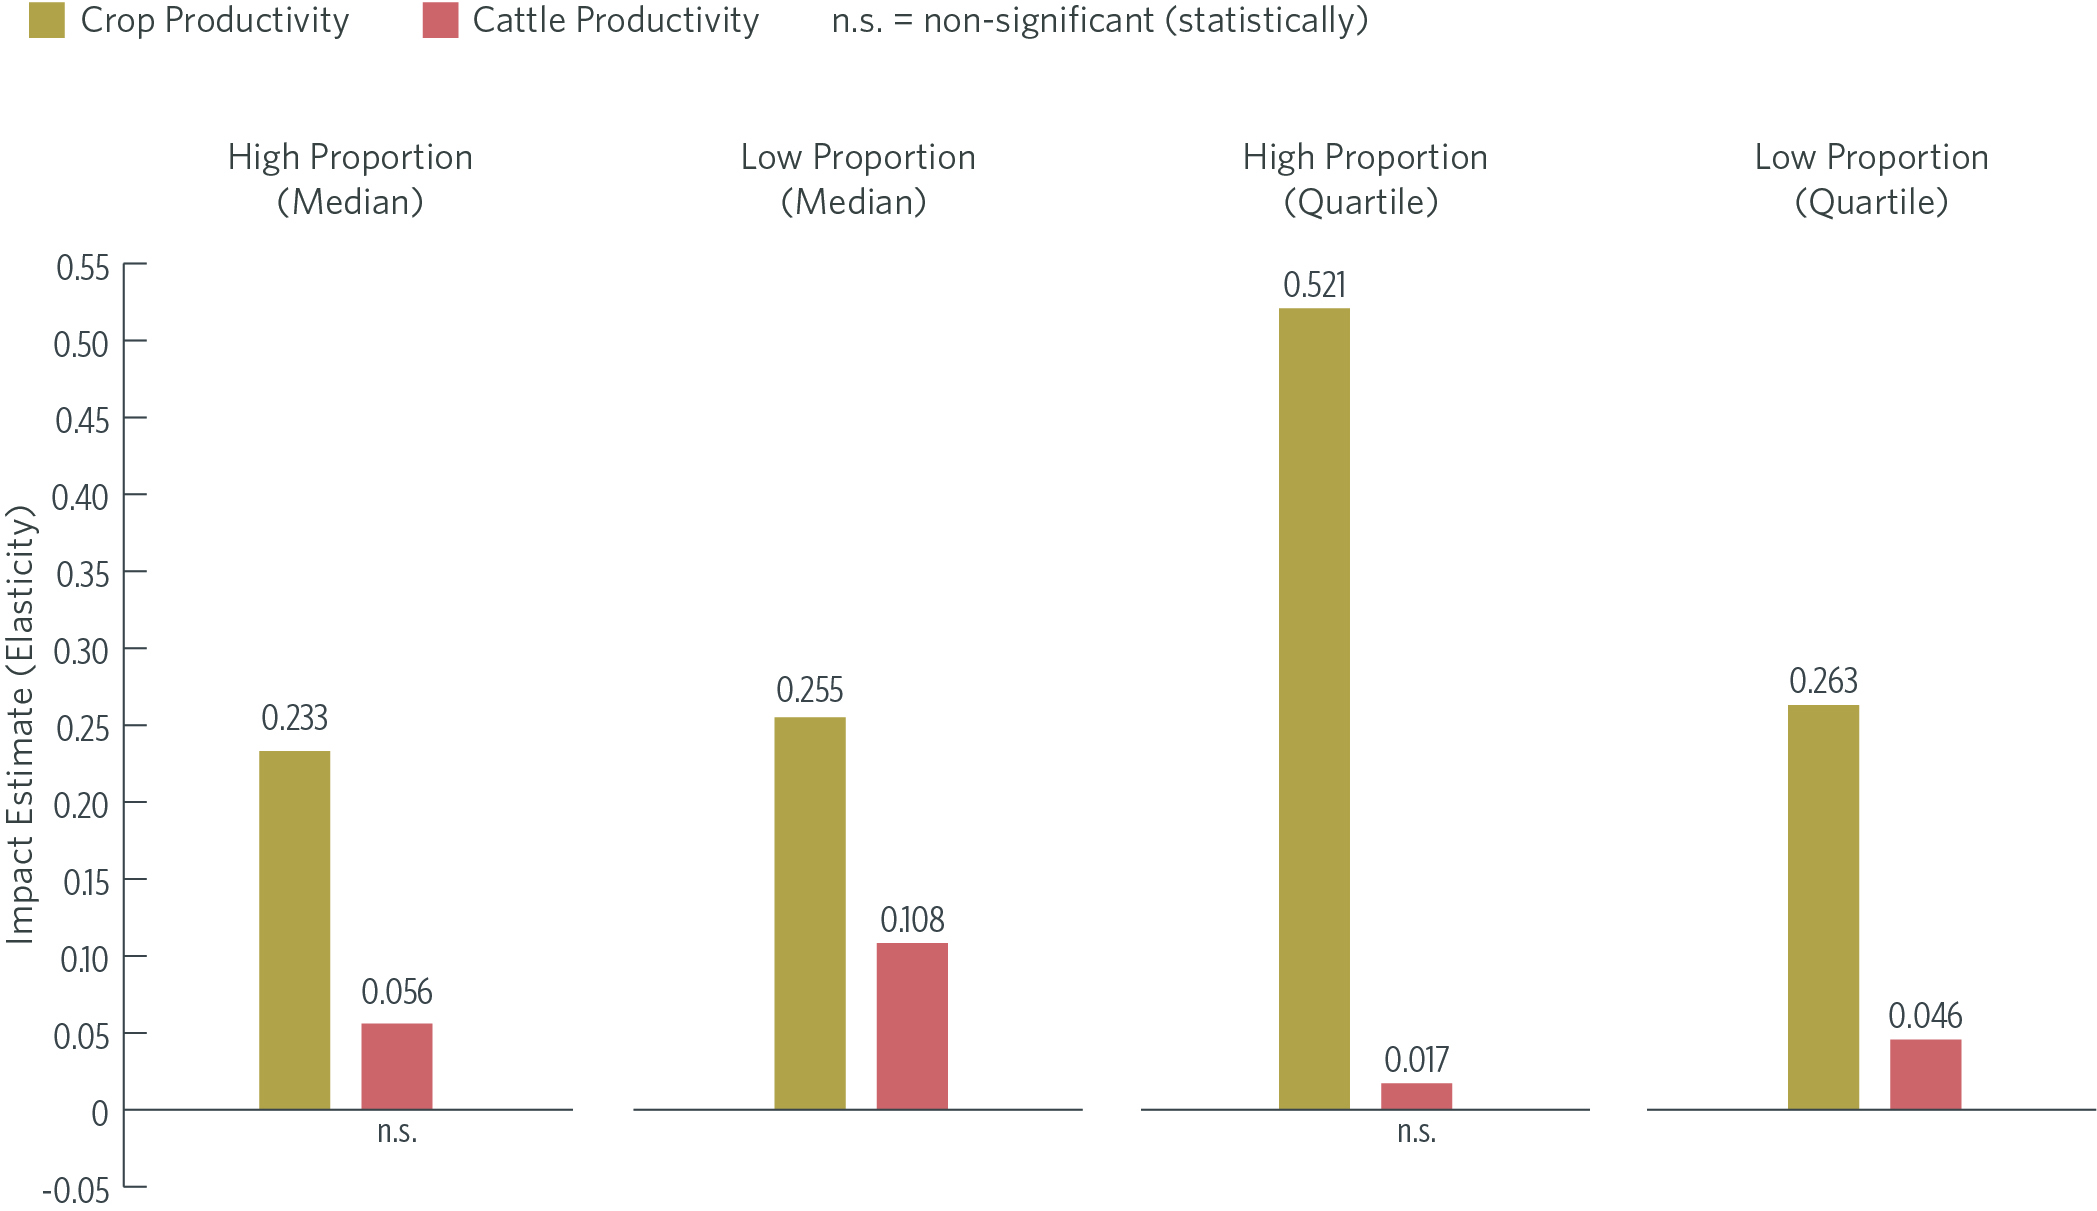
Note: Municipalities are classified as having a high proportion of workers per area or a low proportion of workers per area.
Source: CPI/PUC-Rio with data from BNDES, IBGE and MAPBIOMAS Coleção 6.0, 2022
Thus, the analysis shows that the effects on production and land use are greater when we focus on credit intended to finance labor-saving equipment, especially in more labor-intensive municipalities.
6. CONCLUSION
This study evaluated BNDES rural credit for financing farming machinery and equipment on agricultural activity and land use. The findings show that credit availability helps intensify farming activity, confirming previous research by CPI/PUC-Rio. In addition, the results show that rural credit for equipment drives small changes in areas allocated to agriculture and does not lead to deforestation. In fact, estimates suggest a slight conversion of pasture areas, which are historically less productive, into cropland.
The disaggregated analyses, in turn, show stronger production and productivity increases, especially in crops, in municipalities with a high proportion of workers per area, and for credit intended to finance labor-saving machinery and equipment.
These results indicate that credit for equipment modifies producers’ decisions. Credit made available by BNDES for investment in the agricultural sector is an effective instrument for public policies that combine the promotion of production and environmental conservation.
Thus, BNDES credit can have impacts beyond the explicit objectives of the financing lines. The estimated effects of BNDES credit for farming equipment are not linked to the national production requirements for financed inputs. Credit impacts the environment and the efficiency of agricultural production, complementing BNDES’s objectives in promoting the sector and expanding the productivity of the Brazilian economy. Thus, it is important to consider environmental and agricultural productivity aspects when formulating the bank’s credit policies.
DATA SOURCES
The analysis used panel data from 4,790 Brazilian municipalities between 2005 and 2019, built from different sources. For rural credit for equipment, we used data from BNDES containing the date of release of resources, municipality, financial agent, equipment, total finance amount, investment amount, and type of financed equipment. The following municipal data were obtained from the Brazilian Institute of Geography and Statistics (IBGE): (i) Municipal GDP and Municipal Agricultural GDP;[21] (ii) crop production, through the Municipal Agricultural Survey (PAM);[22] (iii) cattle production, through the Municipal Cattle Survey (PPM);[23] and (iv) number of rural workers through the IBGE Agricultural Census (2006).[24] Finally, data related to land use (crop, cattle, and forest areas) were obtained from MAPBIOMAS (Coleção 6.0) – a database generated by satellite images.[25]
METHODOLOGY
A rigorous assessment of the effects of credit on production and land use variables is methodologically complex. On the one hand, an increase in credit allows producers to finance their activities and thus increase their production. On the other hand, banks tend to concentrate the credit supply in municipalities with greater productive potential. This poses a reverse causality issue – is a greater amount of rural credit a cause or a consequence of a more robust agricultural activity? In line with previous research, researchers from CPI/PUC-Rio and BNDES have managed to isolate the effect of concern through an econometric technique called shift-share approach.
National-level variations in the volume of credit transferred by financial agents generate different local variations in the volume of rural credit for equipment in each municipality. This occurs because the agents are heterogeneously located in the municipalities and have different shares in the local credit markets. This variability allows researchers to identify the effects of credit at the local level.
The analysis draws on a modified shift-share approach to predict municipal-level credit shocks, using changes in market shares of financial agents and estimating the variations in the agents’ supply from one year to another. This makes it possible to distinguish the effects of municipal demand from the effects of credit supply. Thus, the methodology overcomes the problem of reverse causality endogeneity associated with the possibility of funders favoring producers or regions with greater agricultural potential. The complete study and more details about the methodology will be available in the scientific article.
This text is the exclusive responsability of the authors, and does not necessarily reflect the BNDES’s opinion. The authors would like to gratefulefully acknowledge Juliano Assunção, Gabriel Campos, Leila Pereira, and Mariana Stussi for their comments and suggestions, Natalie Hoovr El Rashidy and Giovanna de Miranda for their reviewing and editing work, and Julia Berry for the graphic design work.
[1] Banco Central do Brasil. Matriz de Dados do Crédito Rural – MDCR – v2. bit.ly/3em1xNX.
[2] Souza, Priscila, Stela Herschmann, and Juliano Assunção. Rural Credit Policy in Brazil: Agriculture, Environmental Protection, and Economic Development. Rio de Janeiro: Climate Policy Initiative, 2020. bit.ly/3gpuydv.
[3] Souza, Priscila, André Sant’Anna, Luciano Machado, Barbara Intropidi, and Pedro Vogt. Credit for Investments in Brazilian Agriculture and the Role of the Brazilian Development Bank. Rio de Janeiro: Climate Policy Initiative, 2021. bit.ly/3ljOr6X.
[4] Sant’Anna, André A., Luciano Machado, and Priscila Souza. Avaliação de Efetividade dos Financiamentos do BNDES para Compra de Máquinas e Equipamentos Agrícolas. Rio de Janeiro: BNDES, 2021. bit.ly/3v2iYfn.
[5] Antonaccio, Luiza, Juliano Assunção, Joana Chiavari, Cristina Lopes, Amanda Schutze, and Maína Celidonio. Ensuring Greener Economic Growth for Brazil. Rio de Janeiro: Climate Policy Initiative, 2018. bit.ly/33ARO0F.
[6] BNDES. Estatísticas Operacionais do Sistema BNDES. sd. bit.ly/3kjnkcA.
[7] Souza, Priscila, André Sant’Anna, Luciano Machado, Barbara Intropidi, and Pedro Vogt. Credit for Investments in Brazilian Agriculture and the Role of the Brazilian Development Bank. Rio de Janeiro: Climate Policy Initiative, 2021. bit.ly/3ljOr6X.
[8] Value deflated by the Broad Consumer Price Index (IPCA).
[9] Only the municipalities that received some rural credit for equipment in 2019 were considered in this calculation.
[10] Agricultural productivity is defined as the value of agricultural production in relation to the area devoted to crops in the municipality. Cattle productivity is defined as the number of head of cattle in the area allocated for pasture.
[11] Hayami, Yujiro and V. W. Ruttan. Factor Prices and Technical Change in Agricultural Development: The United States and Japan, 1880-1960. Chicago: Journal of Political Economy, 1970. bit.ly/3rCXof1.
[12] Japan and the United States are paradigmatic examples. In Japan, where land was a relatively scarcer production factor than labor, technological development in crops throughout the 19th century prioritized chemical and biological inputs (such as fertilizers and pesticides) that expanded land productivity. In the United States, where labor was the proportionally scarcer production factor, mechanical innovations (such as tractors and harvesters) predominated, which allowed the cultivation of larger areas with the same labor.
[13] Binswanger, Hans. Agricultural Mechanization: A Comparative Historical Perspective. The World Bank Research Observer, 1986. bit.ly/3Oo4Owo.
[14] Daum, Thomas and Regina Birner. Agricultural mechanization in Africa: Myths, realities and an emerging research agenda. Global Food Security, 2020. bit.ly/3vqZjVk.
[15] Mano, Yukichi, Kazushi Takahashi, and Keijiro Otsuka. Mechanization in land preparation and agricultural intensification: The case of rice farming in the Cote d’Ivoire. Agricultural Economics, 2020. bit.ly/3K0SLlC.
[16] Adu-Baffour, Ferdinand, Thomas Daum, and Regina Birner. Can small farms benefit from big companies’ initiatives to promote mechanization in Africa? A case study from Zambia. Food Policy, 2019. bit.ly/3jW8EyN.
[17] Belton, Ben, Myat Thida Wina, Xiaobo Zhang, and Mateusz Filipski. The rapid rise of agricultural mechanization in Myanmar. Food Policy, 2021. bit.ly/391nORm.
[18] Daum, Thomas and Regina Birner. The neglected governance challenges of agricultural mechanisation in Africa – insights from Ghana. Food Security, 2017. bit.ly/3EtM36f.
[19] Only the municipalities that registered positive rural credit for equipment were considered when calculating the median.
[20] The year 2006 was chosen for classification due to the availability of data from the Agricultural Census and for being the first year in the rural credit for equipment database used in this study.
[21] IBGE. Produto Interno Bruto dos Municípios. 2019. bit.ly/3JCbq7a.
[22] IBGE. Produção Agrícola Municipal. 2019. bit.ly/3hTDO9E.
[23] IBGE. Pesquisa da Pecuária Municipal. 2019. bit.ly/346Szi9.
[24] IBGE. Censo Agropecuário 2006. bit.ly/3GyqpgX.
[25] MAPBIOMAS. Cobertura e Transições Municípios (Coleção 6.0). 2020. bit.ly/3iGk4HP.
