Priorities That Do Not Prioritize: The Mismatch Between the Objectives and the Application of Resources from Constitutional Funds Leads to Credit Concentration in the Rural Sector
Rural credit policies are crucial instruments for the development of agriculture in Brazil, as they help stimulate land productivity and alleviate deforestation pressures.[1],[2],[3],[4] In particular, Constitutional Financing Funds (Fundos Constitucionais de Financiamento – FCFs) are a relevant source of subsidized credit for the North, Northeast, and Midwest regions. These funds seek to contribute for the economic development of these regions by directing resources to small producers and to low income areas.[5] In the 2020/21 agricultural year, FCFs allocated R$ 22.9 billion in financial resources to the rural sector, accounting for 19% of rural credit in these regions.
In this brief, researchers from the Climate Policy Initiative/Pontifical Catholic University of Rio de Janeiro (CPI/PUC-Rio) show that, although rules establishing priority classes for beneficiaries may be apparently aligned with policy objectives, loose eligibility criteria for these classes mean that there is no real prioritization in resource allocation. In other words, priorities are not prioritized.
This misalignment inhibits the FCFs from meeting their objectives. Over time, this loosening of the criteria for setting priorities has undercut the original rules put in place to channel resources to small-scale producers and less developed locations. A simplification of the multiple rules in place (including different beneficiary scales, types of municipalities, funding limits, etc.), can improve the channeling of resources and provide a better understanding of the policy’s direction. Additionally, making fewer changes to rules from one year to another would make resource availability more predictable for producers, reducing uncertainty.
Reducing poverty and inequality are important public policy objectives. However, the question is whether a credit instrument is indeed the most suitable policy to achieve these objectives. In addition to the costs involved in making it operational, targeted credit can generate economic and regional distortions and be less effective. Given the substantial resources channeled through the FCFs, it is important to compare the effectiveness of the subsidized credit policy to that of public policies meant to combat poverty and inequality directly.
THE KEY FINDINGS OF THIS BRIEF INCLUDE:
FCF Priority Criteria do Not Prioritize:
• Priority beneficiaries include nearly all producers. Based on the 2017 Agricultural Census, 99.96% of establishments in FCF regions have a level of income from agricultural activities that qualifies them priority beneficiaries for the FCFs (i.e., producers that have a gross annual income up to R$ 16 million).
• Geographic priorities include most municipalities in the regions covered by FCFs. Of the municipalities covered by the FCFs for the Northeast (FNE), North (FNO), and Midwest (FCO), 97%, 90%, and 51% are considered priority municipalities, respectively.
FCF criteria for priority beneficiaries and geographies have gotten laxer over time:
• Priority beneficiary classes and municipalities were revised in recent years to expand priorities rather than focus resources. With each revision, larger producers gained more access to funds and more municipalities were included as priorities. Case in point: until 2010, priority had been given to small-scale producers – i.e., those with gross annual income up to R$ 300,000. In 2011 a new priority class was created, called small-medium scale, and beneficiaries with annual gross income up to R$ 16 million became priorities.
Loose Priority Criteria Leads to Resource Concentration:
• The average value of FCF credit agreements has been growing, with a significant increase since the 2017/18 agricultural year. Furthermore, contracts in the upper decile saw the most accentuated growth, which indicates that funds concentrate in higher-value contracts.
• The concentration of FCF funds is facilitated by the use of loose criteria to define the priority classes both in terms of producer scale and geographic location. Between the 2013/14 and 2020/21 agricultural years, the 5% of municipalities that borrowed the most rural credit from FCFs held, on average, 41% of FNE resources, 36% of FNO resources and 24% of FCO resources. These shares are higher than the shares of these municipalities in terms of agricultural production value, thus indicating greater access to financing. Additionally, in the FNO and FCO, the percentage of FCF credit held by smaller producers is lower than the fraction they hold of the value of agricultural revenue, which means that financial resources have not been effectively prioritized.
FCFs Remain Extremely Relevant to Small Producers and Less Developed Municipalities:
• Resources from FCFs remain relevant as they reach producers and municipalities with fewer access to credit markets, particularly in the Northeast and North regions of the country. Between the 2013/14 and 2020/21 agricultural years, in 78% of FNE municipalities and 59% of FNO municipalities FCFs served as the main sources of rural credit. On the other hand, producers in the Midwest region – which has experienced rapid agricultural expansion – had better access to other sources of financing, with only 9% of municipalities having the FCO as their main source of rural credit.
Constitutional Financing Funds: Objectives and Operation
FCFs “(…) aim to contribute to the economic and social development of the North, Northeast and Midwest (…) by executing financing programs for productive sectors (…)”, according to Law No. 7,827/1989. Additionally, FCFs must give “(…) preferential treatment to the productive activities of small and mini-scale rural producers (…),” and should support the “(…) creation of new, dynamic centers, activities, and hubs, notably in inland areas, to reduce intra-regional income disparities (…)”.[6]
Article 159 of Brazil’s 1988 Federal Constitution requires that 3% of Income Tax (Imposto de Renda – IR) and Tax on Industrialized Products (Imposto sobre Produtos Industrializados – IPI) proceeds to financing programs that are directed towards productive sectors in the country’s regions, with the objective of fostering economic and social development. Law No. 7,827 of September 27, 1989, later regulated this constitutional provision and instituted the FNO, FNE, and FCO, which receive, respectively, 0.6%, 1.8%, and 0.6% of proceeds directed from the IR and IPI taxes..
FCFs are fundamental elements for the implementation of the National Policy for Regional Development (Política Nacional de Desenvolvimento Regional – PNDR).[7] General guidelines for the FCFs include: (i) prioritizing mini and small-scale rural producers and/or those who produce basic food items; (ii) using favorable terms, financing limits, and interest rates, in view of the economic and social nature of the enterprises; and (iii) supporting the creation of new centers and activities geared towards reducing intra-regional income disparities.[8]
The resources of each of the FCFs are operated primarily through their managing banks: Banco da Amazônia in the FNO, Banco do Nordeste in the FNE and Banco do Brasil in the FCO. Even though managing banks can transfer resources from FCFs to other financial institutions, the volume of credit effectively operated by these is low. In 2020, only 0.36%, 0.06% and 4.5% of the total resources of the FNO, FNE and FCO, respectively, were operated by other financial institutions.[9]
Every year, Banco da Amazônia, Banco do Nordeste, and Banco do Brasil must prepare budgetary schedules for the use of FCF Funds. Such budgetary schedules contain information on the amounts available in the funds, as well as the amount of credit to be allocated to states, sectors of economic activity, priority areas, and different types of beneficiaries. The budgetary schedules must follow annual guidelines previously established by the Ministry of Regional Development (Ministério do Desenvolvimento Regional – MDR) and must be validated by the Deliberative Councils of the Development Superintendencies for each region (SUDAM in the North, SUDENE in the Northeast, and SUDECO in the Midwest).[10]
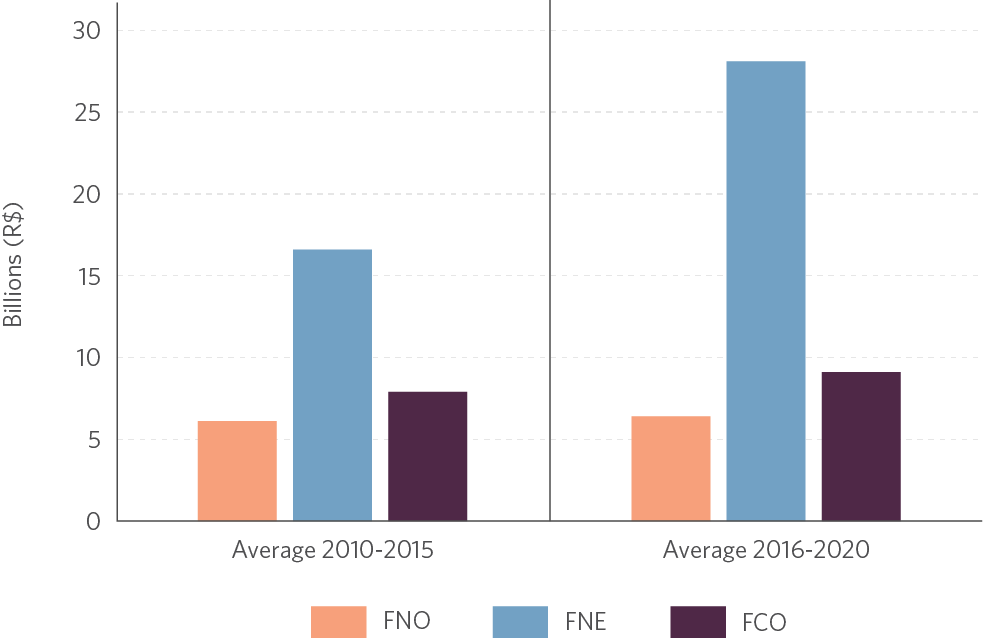
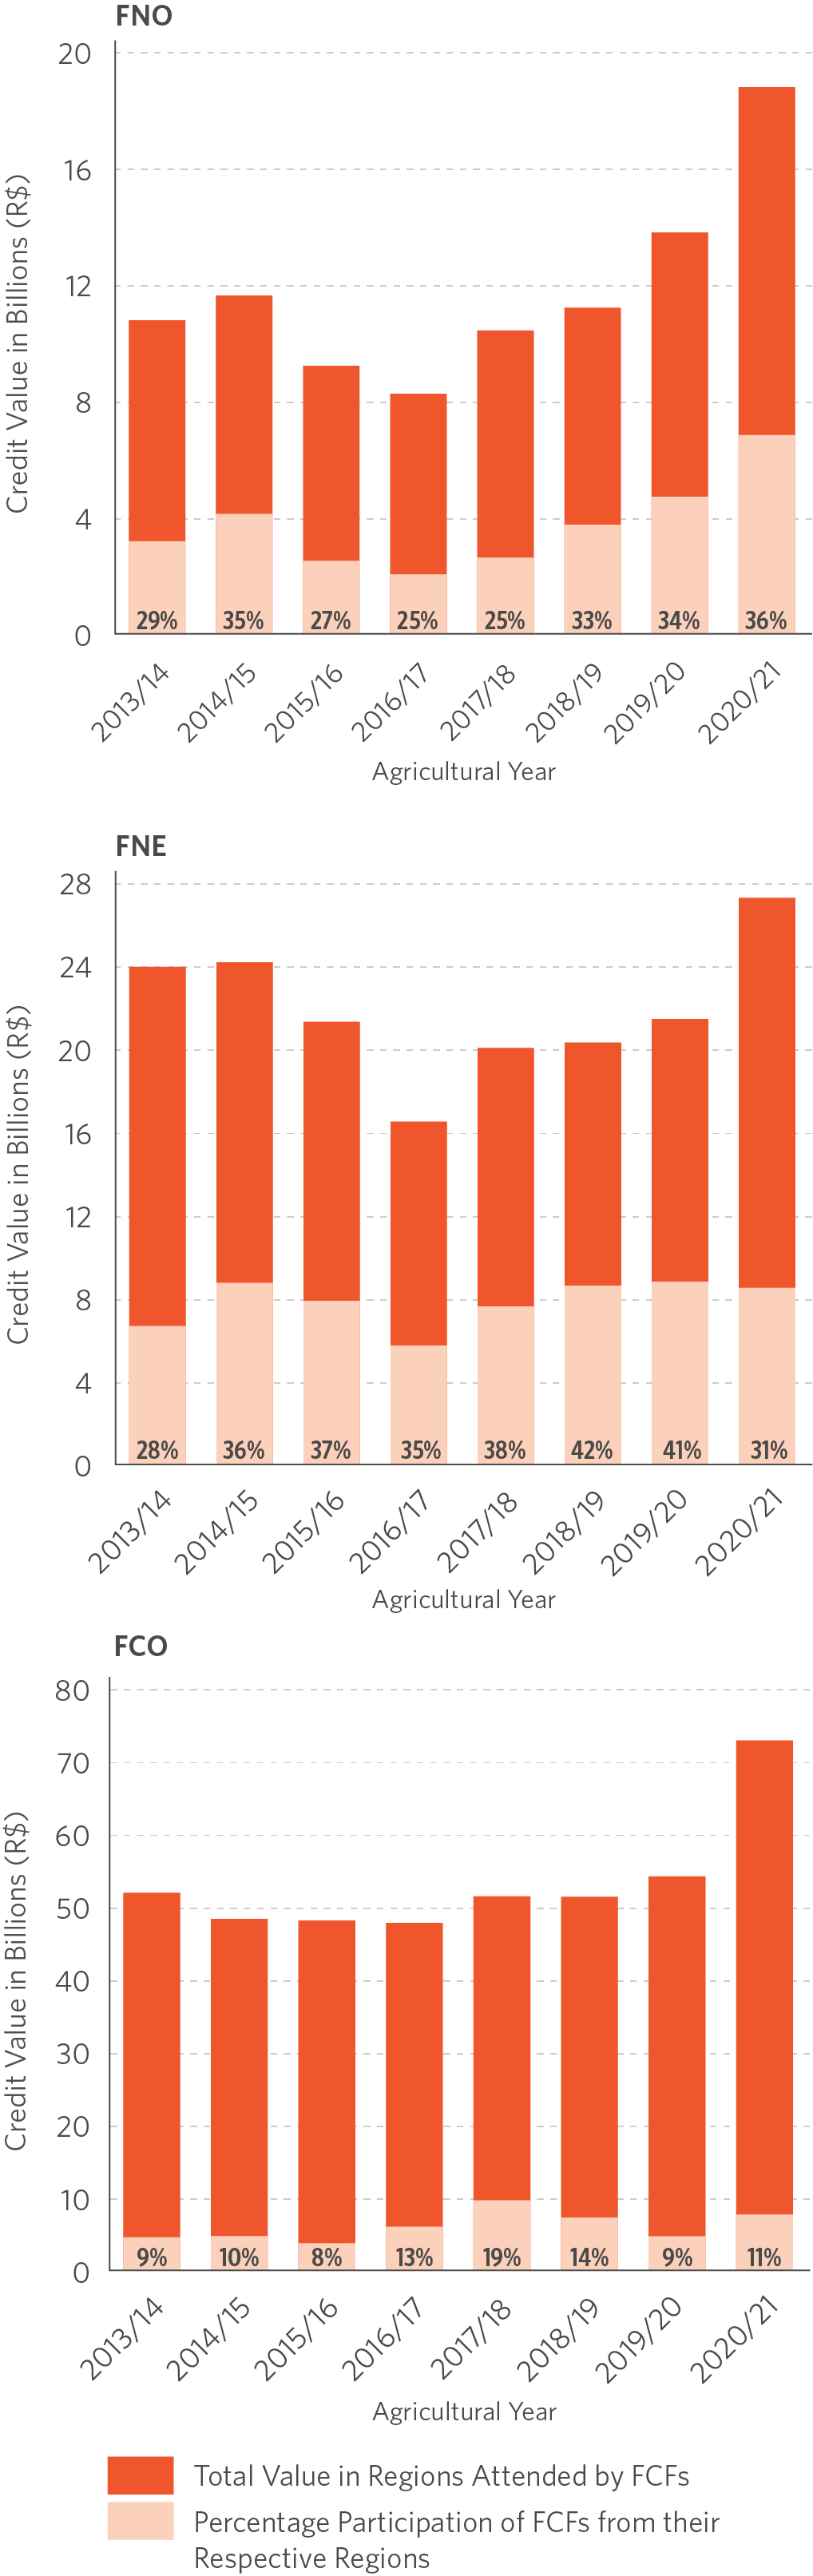
Figure 1 shows the evolution of amounts scheduled for each fund, as well as the participation of the rural sector in the funds. As shown in Figure 1a, the FNE has more money than the FCO and FNO, in line with the rule on tax proceeds distribution. Between 2016 and 2020, the FNE scheduled investments of around R$ 28 billion per year, while the FCO and FNO scheduled R$ 9 billion and R$ 6 billion in investments per year, respectively. Figure 1b shows that the rural sector represents a significant portion of total FCFs loans, accounting for 53%, 49%, and 24% of the resources scheduled between 2016 and 2020 under the FCO, FNO and FNE, respectively. The rural sector’s share in the FNE dropped between the periods under analysis (from 36% to 24%), which resulted from a significant increase in the total scheduled amount and the allocation of investments into infrastructure, mainly for wind power generation projects.[11]
Figure 1. Amounts Scheduled by FCF, 2010-2020
a. Total Resources Expected by FCF
b. Participation of Rural Sector in FCF Expected Resources
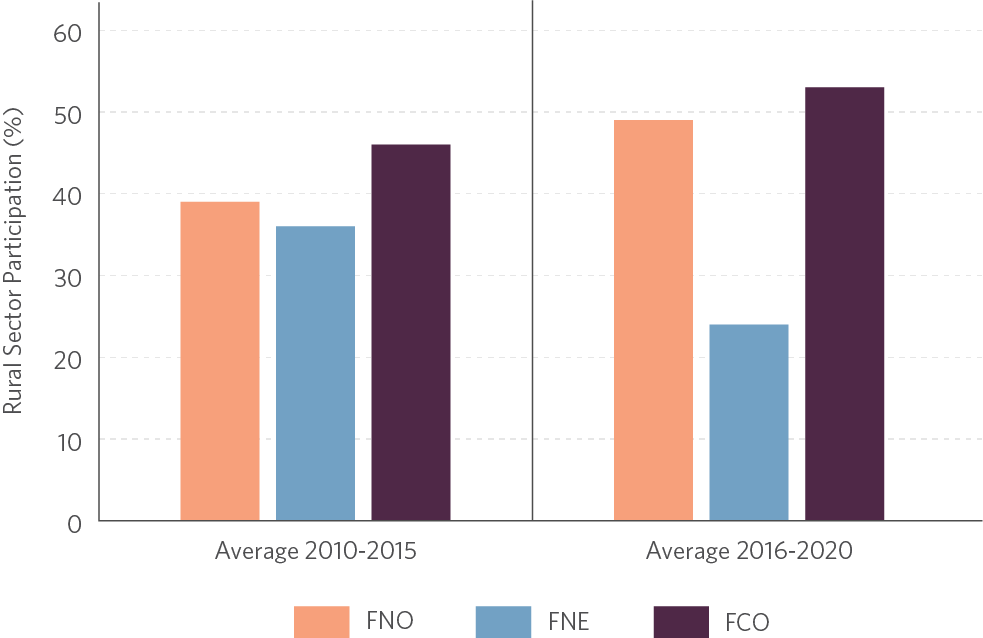
Note: Amounts deflated by the Broad Consumer Price Index (Índice Nacional de Preços ao Consumidor Amplo – IPCA), using the year 2020 as reference.
Source: CPI/PUC-Rio with data from the Ministry of Regional Development, 2022
Prioritization of Resource Allocation
In addition to dealing with the distribution of resources to different economic sectors, the FCFs’ budgetary schedules also plan for the allocation of resources and financing conditions by beneficiary size and enterprise location. The objective is to give preference to smaller beneficiaries, stimulate local economies, and develop new economic activity hubs.
A Focus on Small Producers?
The FCFs’ budgetary schedules prioritize the distribution of resources to mini, small and small-medium-scale enterprises. Table 1 is based on data from FCF schedules and shows the definitions of beneficiary scale classes between 2001 and 2021.
Table 1. Classification of the Scale of Rural Properties according to Annual Gross Income from Agriculture, 2001-2021
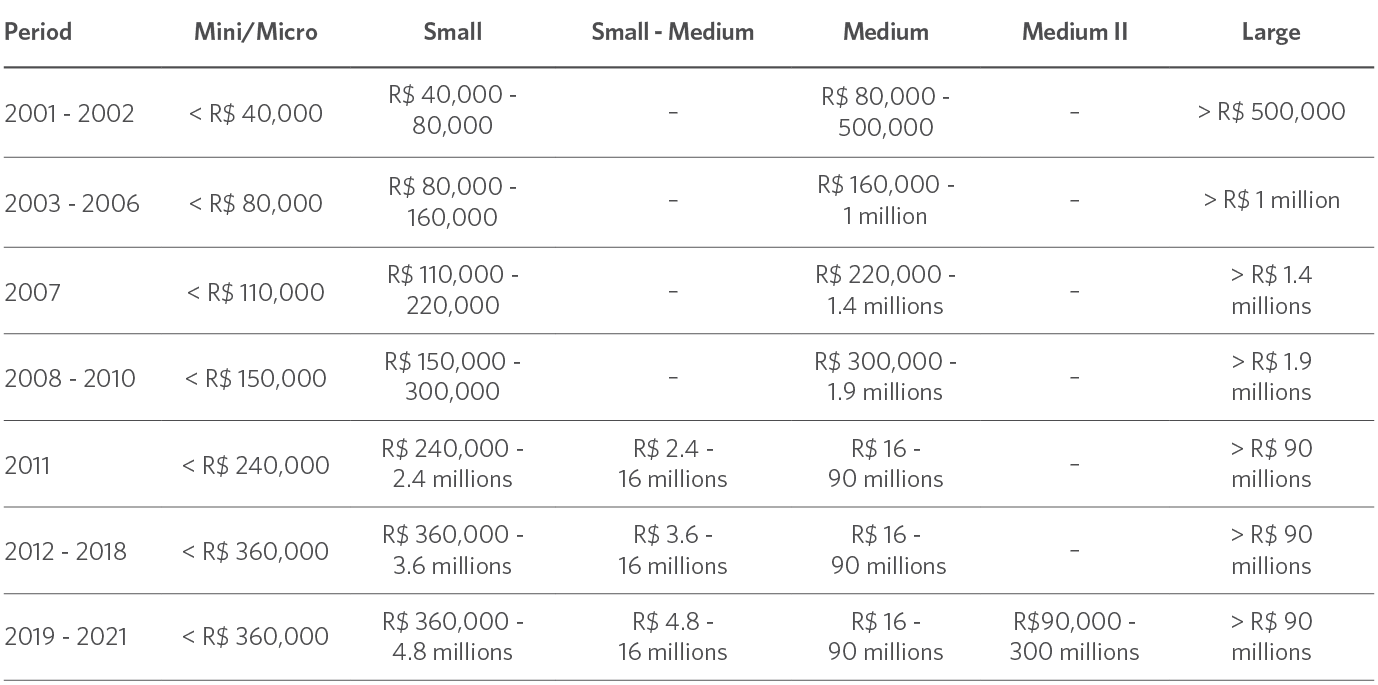
Note: The amounts consider the annual gross income of all agricultural activities and products; Medium Category II was created exclusively by the FNE for producers with gross income between R$ 90 and 300 million. Large producers are those with gross income above this limit. For the other funds (FNO and FCO) Large category remains for all producers with gross income above R$ 90 million.
Source: with data from the Ministry of Regional Development, 2022
Producers up to the small and small-medium-scale categories are prioritized in different ways (as described in Box 1). At least 30% of annual resources must be directed to small beneficiaries in all FCFs. In addition, since 2011 both the FCO and the FNO have planned to allocate 51% of resources to beneficiaries belonging to mini, small, and small-medium-scale categories. In 2021, the FCO revised the rule and scheduled to allocate 60% of resources to beneficiaries up to small-medium scale. The FNE, which until 2016 had been using the rule of allocating 51% of resources to beneficiaries up to small-medium scale, began to allocate a slightly higher share of resources to these beneficiaries between 2017 and 2021 (about 56% of resources, on average).
The revisions of priority classes in recent years have caused priorities to expand.[12] One such example was a revision in 2011, described in Table 1, which significantly increased the number of beneficiaries considered small and medium-scale. Until 2010, beneficiaries were deemed small if their gross annual income was between R$ 150,000 and R$ 300,000 and medium-scale if their gross annual income was between R$ 300,000 and R$ 1.9 million. Starting in 2011, beneficiaries with annual gross income up to R$ 2.4 million were considered small. Additionally, a small-medium scale class was created for annual gross incomes between R$ 2.4 million and R$ 16 million; the medium-scale class came to include beneficiaries whose annual gross income was between R$ 16 million and R$ 90 million. With each revision, larger and larger producers gained more and more access to funds.
BOX 1. THE PRIORITIZATION OF PRODUCERS
In line with guidelines proposed by the MDR, FCF budgetary schedules designate mini, small and small-medium-scale rural producers as priorities. The four main prioritization methods are listed below:
1. They direct resources to mini, small and small-medium-scale producers. According to 2021 budgetary schedules, producers up to small-medium scale must receive 60%, 53% and 51% of the resources from the FCO, FNE and FNO, respectively.
2. They establish minimum resource thresholds for small-scale producers. According to 2021 budgetary schedules, the minimum threshold ensuring that 30% of FCO and FNO resources go to beneficiaries mini and small scale must be respected. Under the FNE, beneficiaries up to small scale must receive 85.4% of the 53% of resources directed to classes up to small-medium scale. The small class includes producers with annual gross incomes up to R$ 4.8 million. According to data from the 2017 Agricultural Census, fewer than 2% of agricultural establishments in the region covered by the FCO and about 0.1% of establishments in regions covered by the FNE and FNO have annual gross incomes above R$ 4.8 million.[13]
3. They offer different interest rates depending on producer scale. Table 2 summarizes the pre-fixed interest rates based on producer size, as defined in the FCF budgetary schedules for 2021. In general terms, the interest rates charged by FCFs are lower than the rates of 7.5% to 8.5% set by the 2020/21 Agricultural Plan for beneficiaries with annual gross incomes above R$ 2.4 million.[14]
Table 2. Interest Rates by Fund and Beneficiary Scale, 2021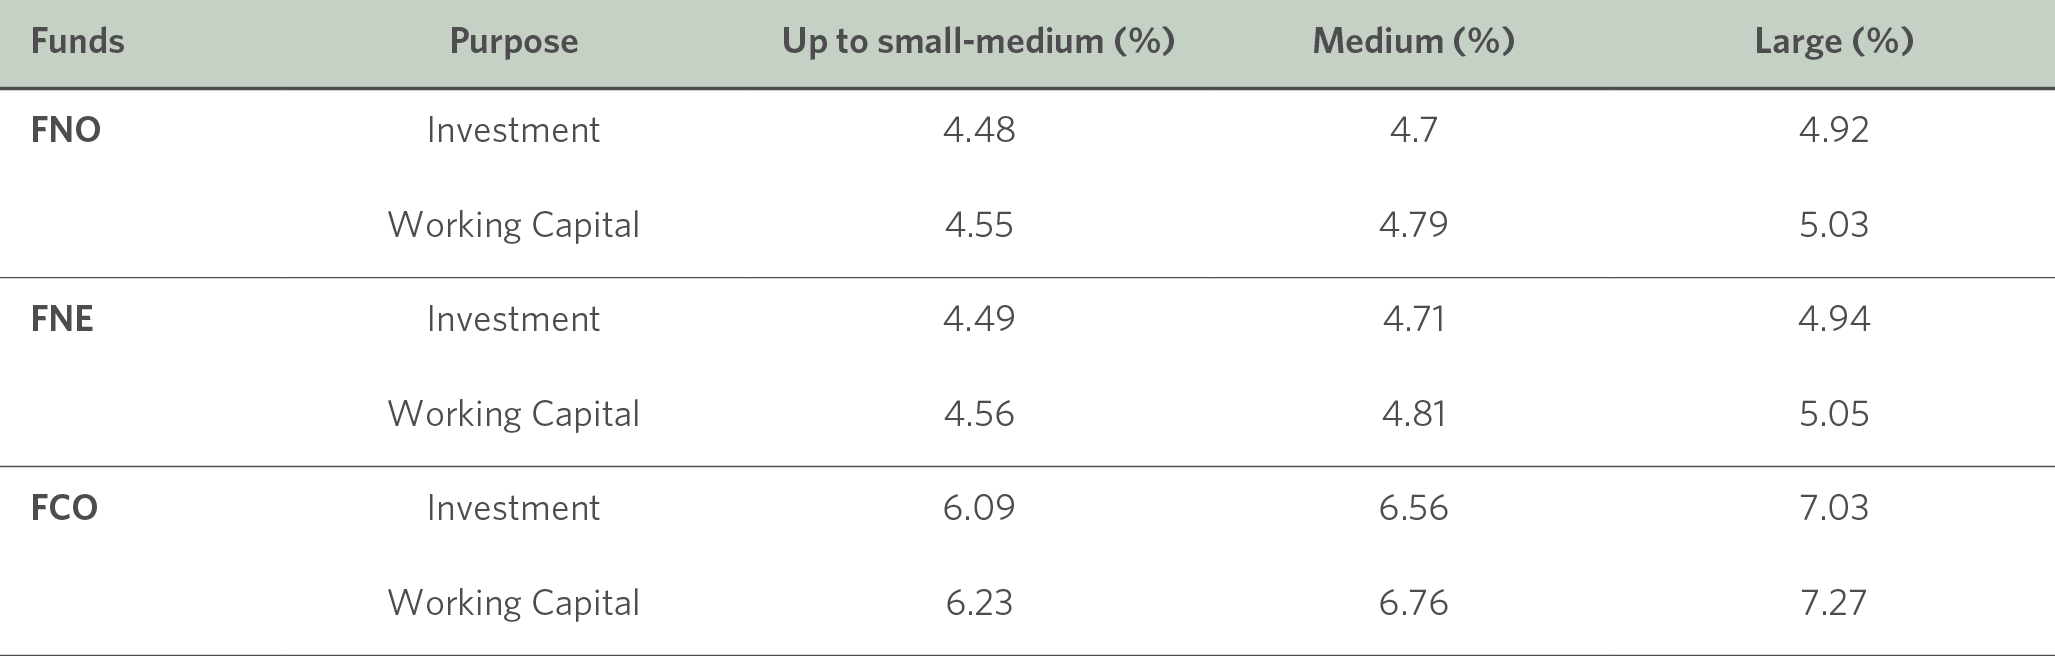
Note: In the FNE, the Medium producer category corresponds to the Medium I category (annual gross income between R$ 16 and R$ 90 million). The Large category comprises producers in the Medium II (annual gross income between R$ 90 and R$ 300 million) and Large (annual gross income above R$ 300 million) categories.
Source: CPI/PUC-Rio with data from the FCF Budgetary Schedules made available by the Ministry of Regional Development, 2022
4. They establish different credit limits for investments based on beneficiary scale and location. Table 3 in Box 2 provides a more precise description of this type of prioritization that combines size and location.
Figure 2 compares the scale classification of producers under the FCFs to that of the Rural Credit Manual (Manual de Crédito Rural – MCR) of the Central Bank of Brazil.[15] It should be noted that beneficiary scale categories under the FCFs have much higher annual gross income thresholds than those in the MCR, which are used, for example, to determine eligibility for the National Program for Strengthening Family Agriculture (Programa Nacional de Fortalecimento da Agricultura Familiar – PRONAF) and the National Program for Support to Medium-Scale Rural Producers (Programa Nacional de Apoio ao Médio Produtor Rural – PRONAMP). Producers deemed small and small-medium by FCFs (i.e., annual gross incomes between R$ 360,000 and R$ 16 million) would be classified as medium or large under the MCR criterion. Furthermore, data from the 2017 Agricultural Census reveal that approximately 0.04% of establishments in the regions covered by FCFs are classified as medium or large according to the FCFs’ criteria.[16] Therefore, despite the preference that FCFs offer to mini, small, and small-medium enterprises, the actual scale classification of their criteria means that nearly all producers are considered as priority beneficiaries.
Figure 2. Rural Producer Scale Classifications based on Annual Gross Income, 2021
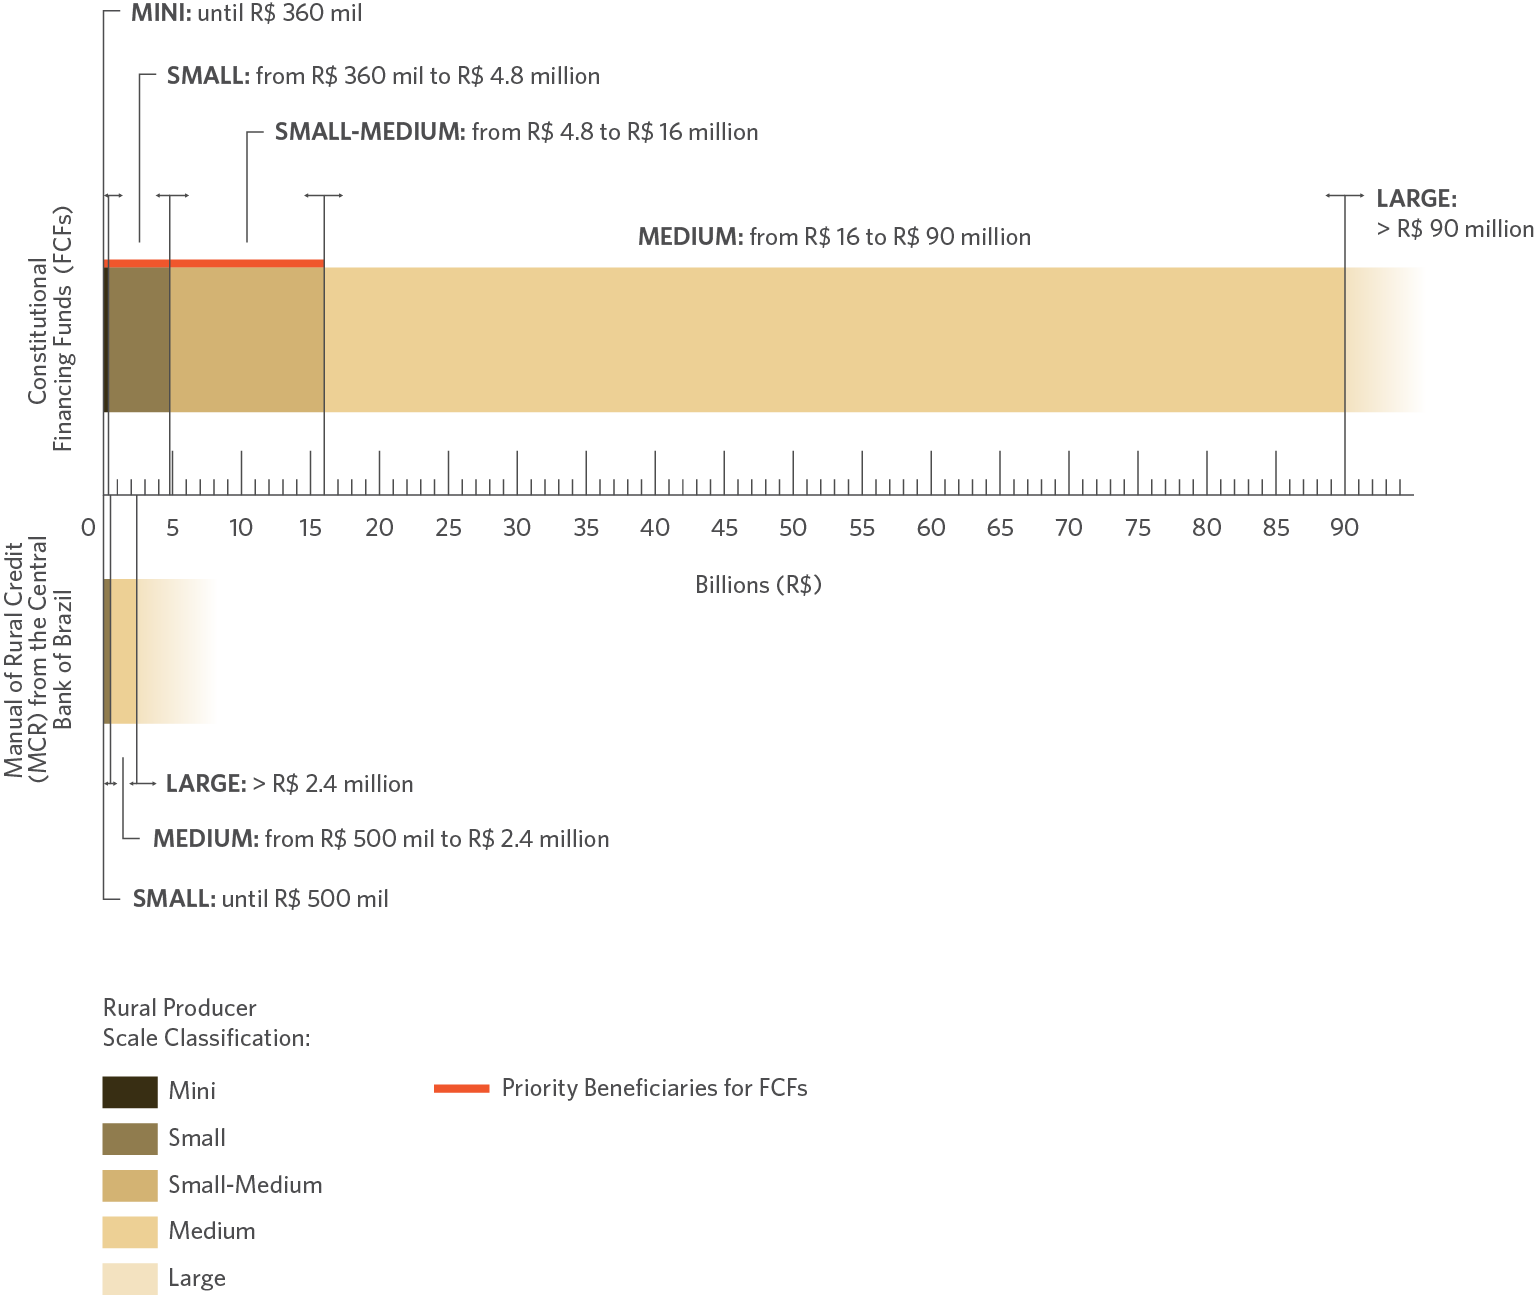
Source: CPI/PUC-Rio with data from the Ministry of Regional Development and from the Central Bank of Brazil, 2022
WHAT ARE THE SPATIAL PRIORITIES?
FCFs prioritize the distribution of resources and offer better financing conditions for enterprises in regions designated as geographic priorities in the PNDR (as detailed in Box 2). The two ways in which the PNDR classifies municipalities are illustrated in Figure 3 below. First, Figure 3a shows the special sub-regions, which include: (i) border region; (ii) integrated development region (Região Integrada de Desenvolvimento – RIDE); and (iii) semi-arid. Second, Figure 3b shows the classification of municipalities in the PNDR according to income bracket (based on per capita household income) and degree of dynamism (considering municipal GDP growth).[17]
Figure 3. Classification of Municipalities by Special Sub-regions and by Typology, 2021
a. Special Subregions (Classification in use since 2018)
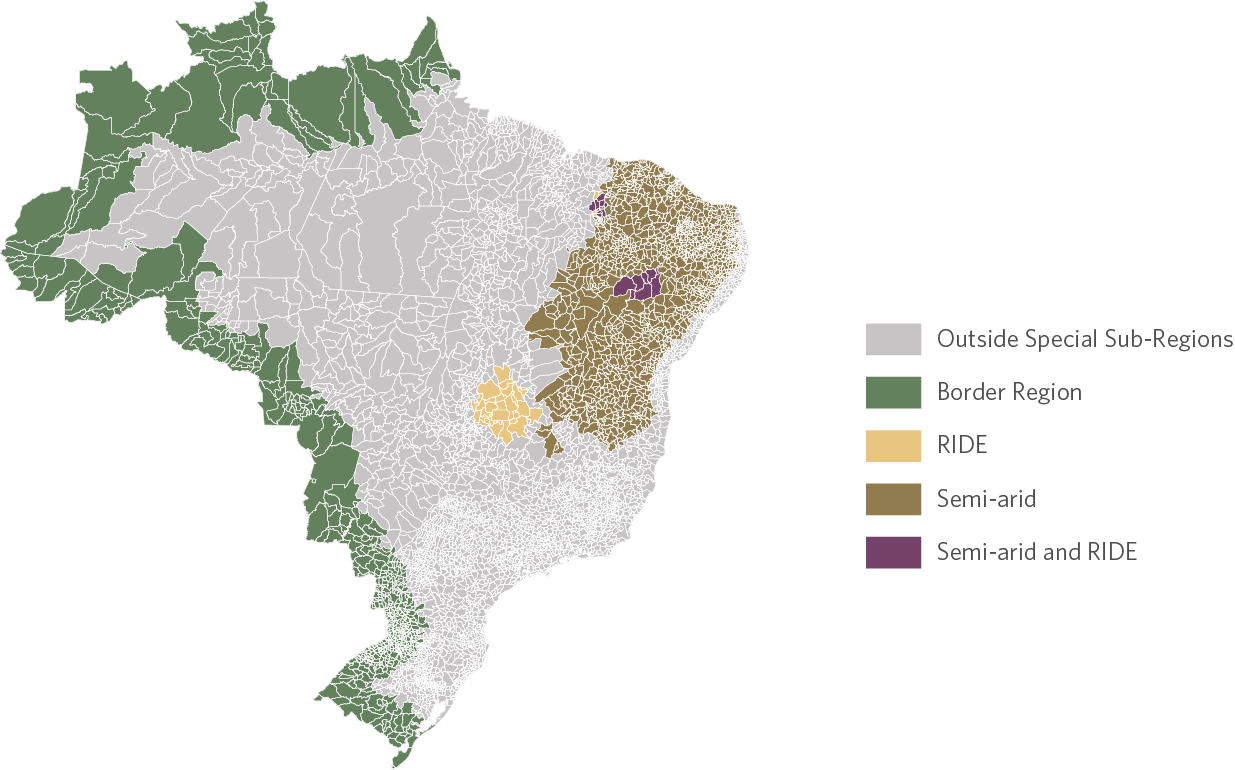
b. PNDR Typology (Classification in use since 2018)
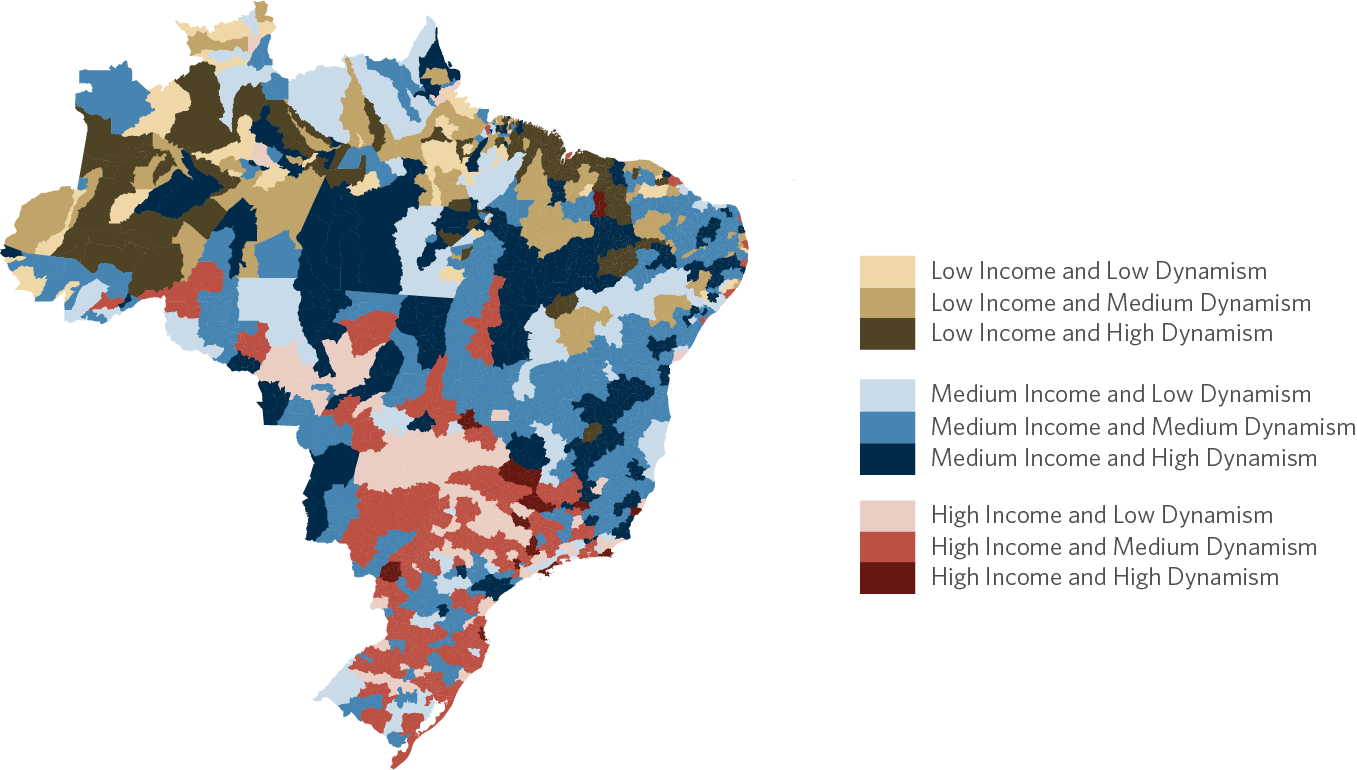
Source: CPI/PUC-Rio with data from the Ministry of Regional Development’s PNDR, 2022
Figure 4 shows the municipalities deemed geographic priorities by FCFs – i.e., those located in special sub-regions or classified under the PNDR typology as low or medium income at any level of dynamism. In such municipalities, interest rates are lower and financing limits for investments are above 80%. Priority municipalities account for 97%, 90%, and 51% of the total number of municipalities covered by the FNE, FNO, and FCO, respectively. Consequently, almost all regions covered by the FNO and FNE are deemed priorities.
Figure 4. Municipalities Designated as Priorities by FCFs, 2021
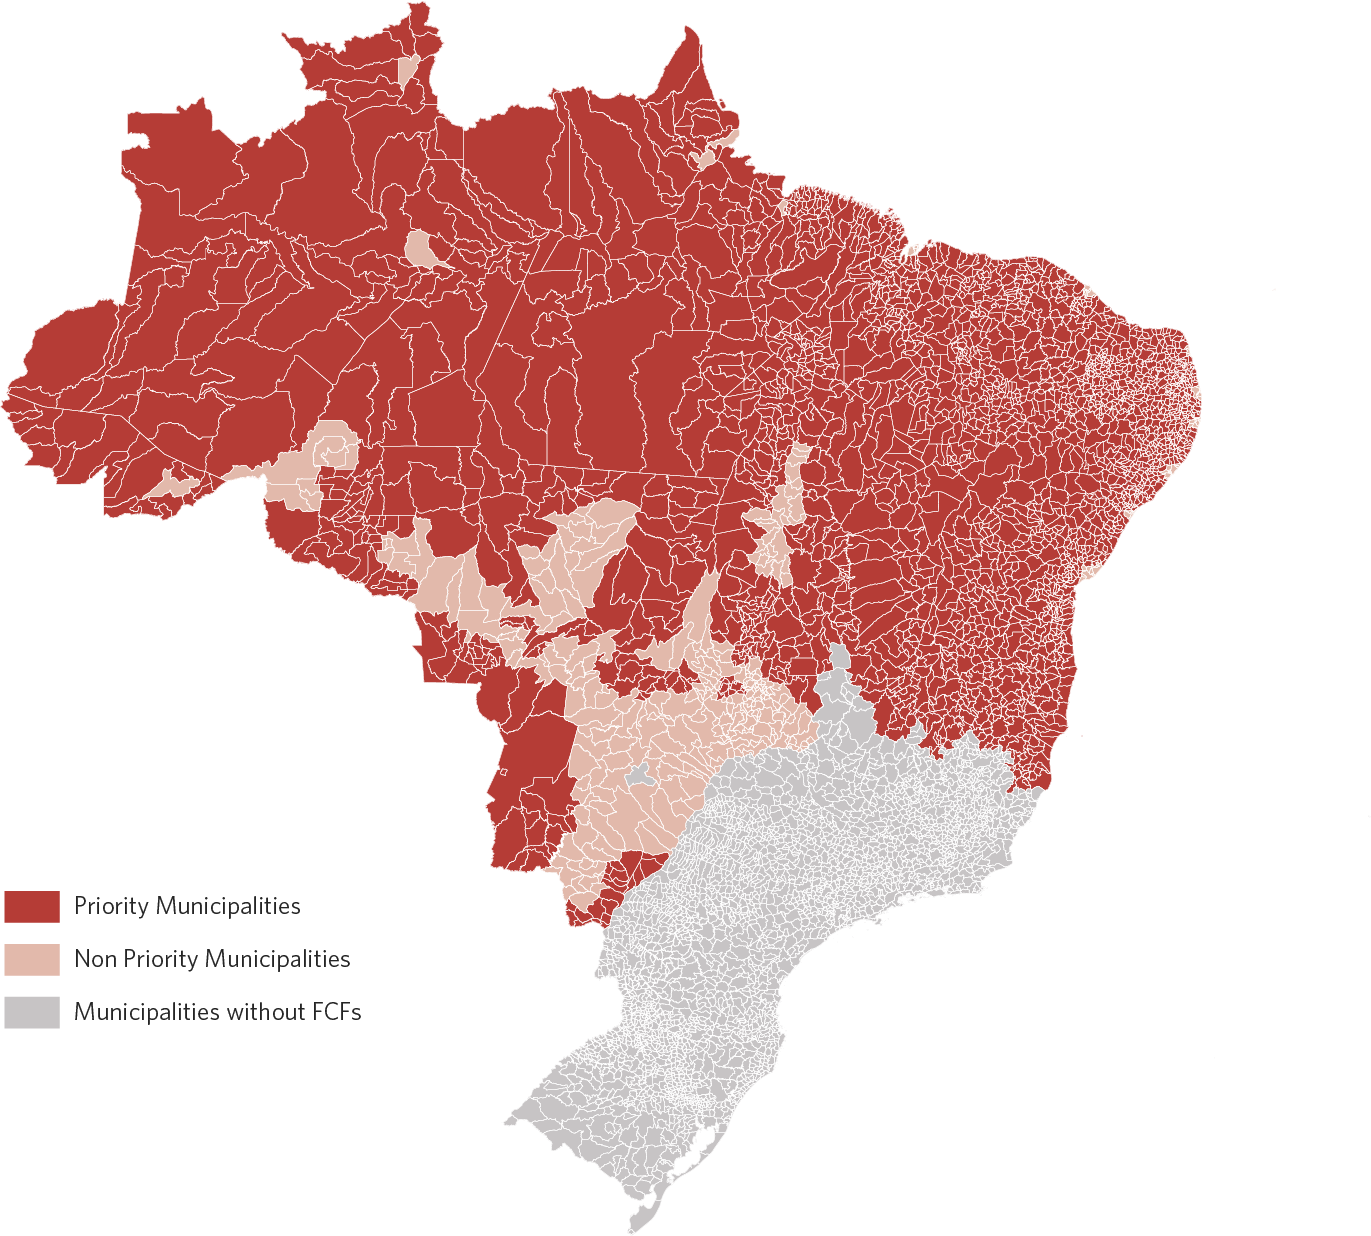
Note: Municipalities located in special sub-regions or classified under the PNDR typology as low or medium income are considered spatial priorities.
Source: CPI/PUC-Rio with data from the Ministry of Regional Development’s PNDR, 2022
BOX 2. THE PRIORITIZATION OF MUNICIPALITIES
The budgetary schedules of the FCFs offer two ways of prioritizing municipalities for rural credit:[18]
1. They direct resources to municipalities in special sub-regions or classified as up to medium income in the PNDR (regardless of dynamism). The 2021 FNE and FCO budgetary schedules set a maximum limit of 30% of rural sector resources for beneficiaries in municipalities classified as high-income under the PNDR. Furthermore, the semi-arid region must receive 50% of the FNE’s resources. According to the 2021 budgetary schedules, municipalities up to middle income must receive 90% and 70% of FNO and FNE resources, respectively. In the FCO, budgetary schedules are split as follows: 51% for middle-income municipalities, 17.5% for the border region, 3.5% for RIDES and 3% for the Pantanal Plain.
2. They set different credit limits for investments based on beneficiary scale and location. Table 3 presents these limits in the FCFs’ budgetary schedules for 2021. Although there are more restrictive limits for beneficiaries larger in scale and located in non-priority locations, such as high-income municipalities, these limits seem quite high. For example, medium-scale beneficiaries in high-income municipalities can finance 70% to 85% of their investments, depending on the fund.
Table 3. Credit Limits for Investment by Fund, Geographic Priorities, and Beneficiary Scale, 2021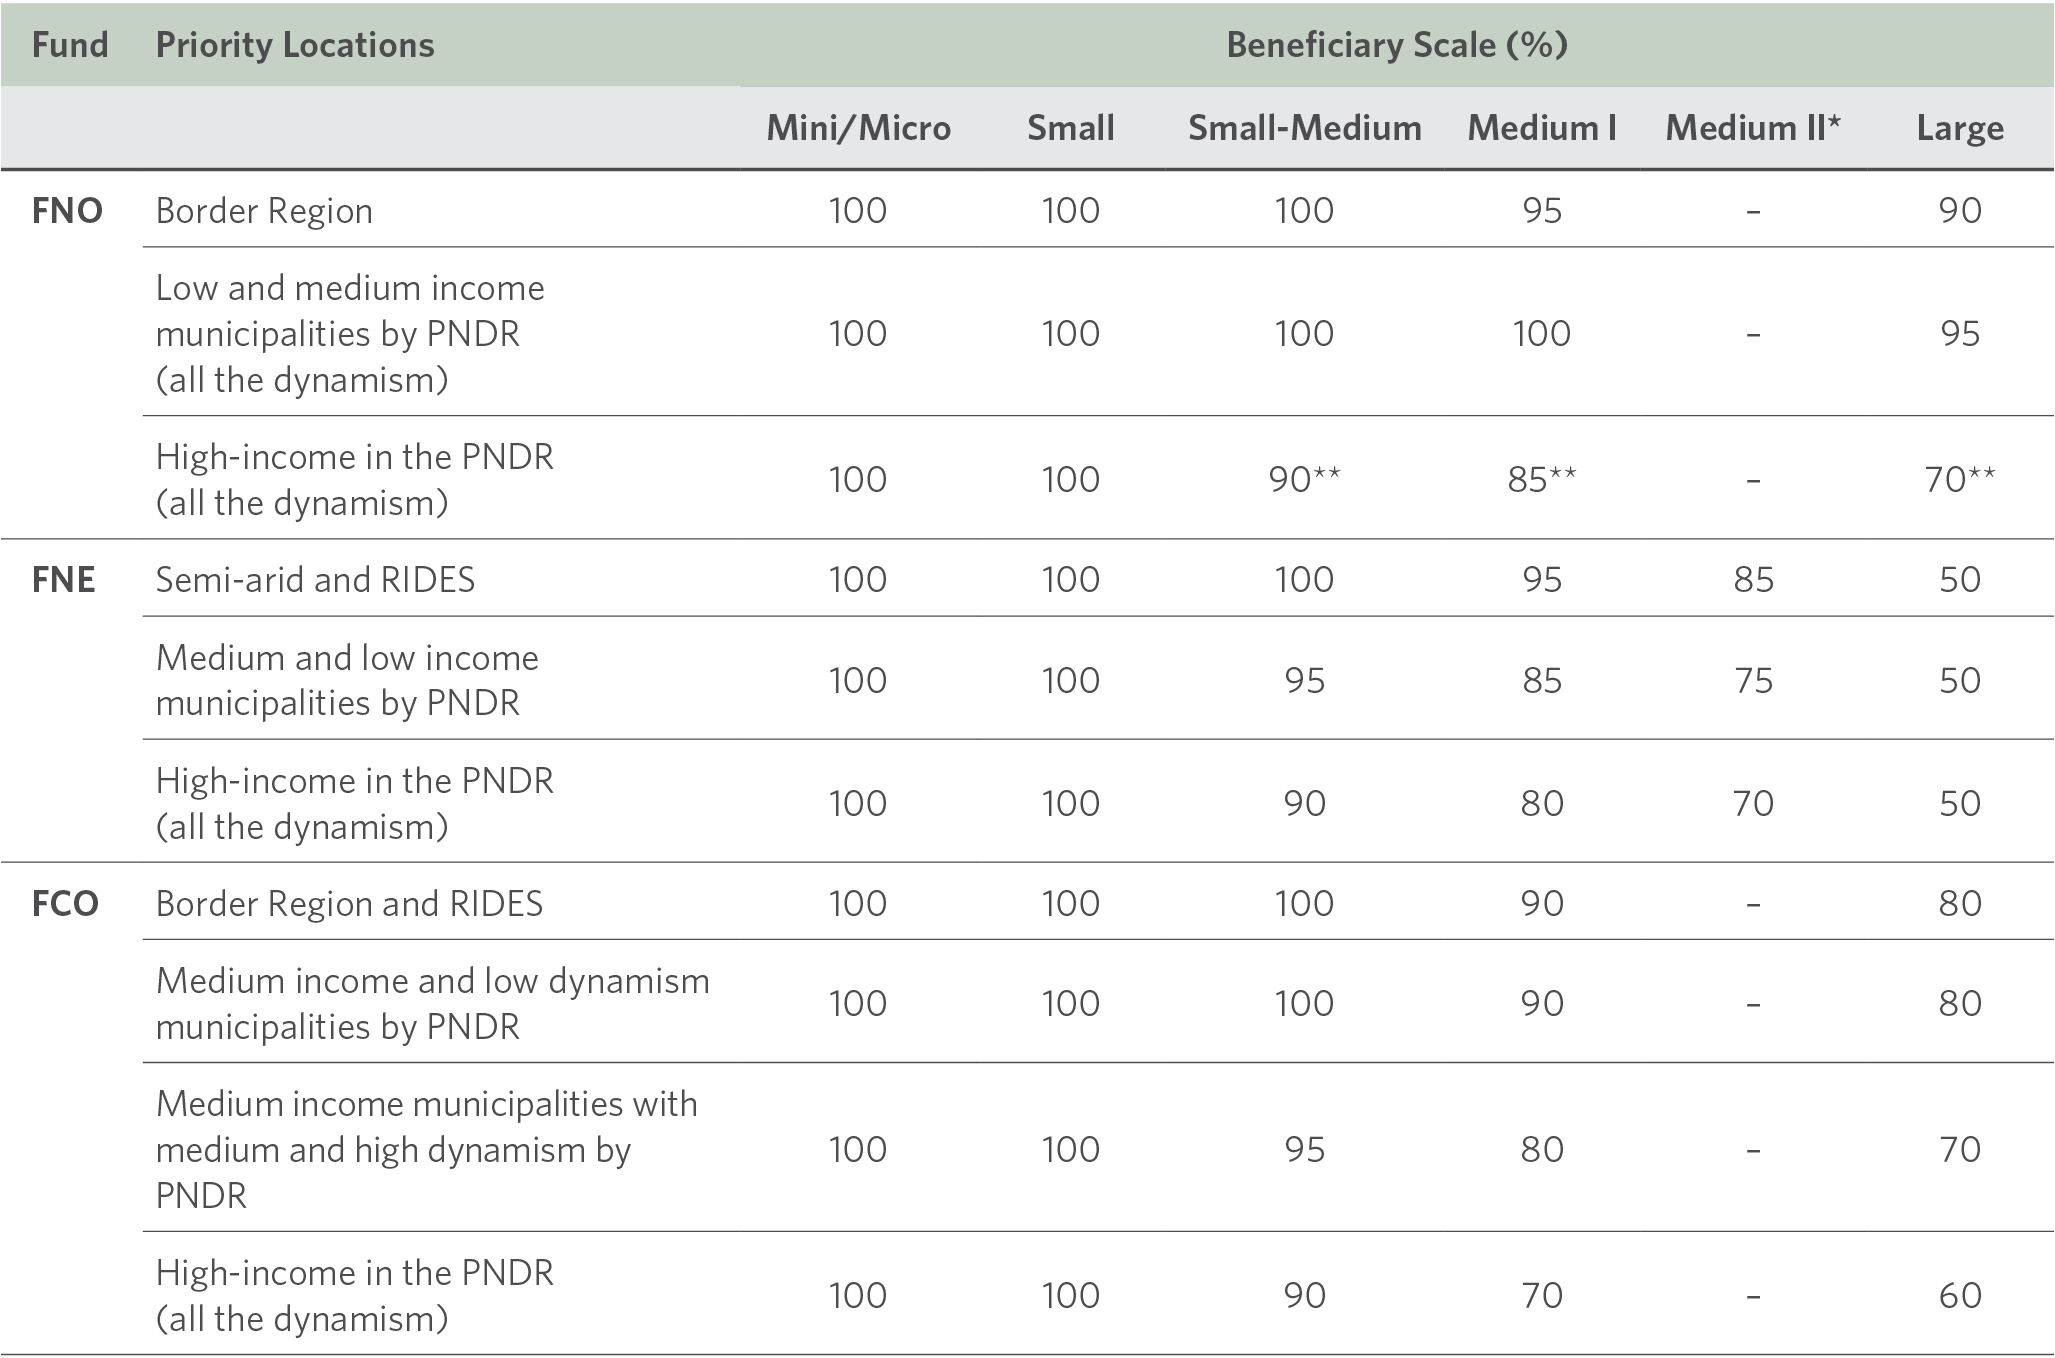
*Classification of medium size II is exclusively from the FNE; **Financial limits for the Rural Verde, Empresarial Verde and Infra Verde lines. For the Rural, Business and Infra lines, limits of 85%, 80% and 65% will be considered for small-medium, medium and large companies, respectively.
Source: CPI/PUC-Rio with data from the Ministry of Regional Development, 2022
Priorities do not Prioritize
The FCF budgetary schedules emphasize that the promotion of economic and social development in the regions served is a crucial part of funding allocation and conditions. In fact, there are different ways of reaching the different economic sectors, beneficiary segments and municipalities that face more severe funding restrictions. However, the abundance of priority types and the looseness of criteria suggests that a significant portion of the available funds is allocated in a way that is inconsistent with the objectives. Additionally, the revisions of priority beneficiaries and municipalities over the years have served to expand priority groups rather than improve the targeting of resources. With each revision, larger producers gained more access to funds and more municipalities were included as priorities.
The next sections discuss how FCF resources are actually distributed in the rural sector and the relevance of these resources at the local level.
Concentration of FCF Resources in the Rural Sector
This section shows that the broadly defined priority classes and high credit limits lead to little effective prioritization in the allocation of FCF resources. In addition, changes in classification over the years favor the concentration of such resources.
The process of concentration of credit from FCFs is notable, above all, in the North and Northeast regions. Figure 5 shows the evolution of the value of rural credit contracts in the different FCFs, comparing the average value to the median values and to the first and ninth deciles. The average contract amount has increased significantly since the 2017/18 agricultural year. More importantly, the growth of contracts in the top decile was stronger than the median, indicating that resources have concentrated in higher-value contracts.
Figure 5. Average Contract Amounts by FCF, 2013/14 – 2020/21


Note: Amounts deflated by the IPCA, using July 2021 as reference.
Source: CPI/PUC-Rio with data from the Central Bank of Brazil’s SICOR, 2022
Figure 6 shows the percentage of rural credit from FCFs that was effectively directed to producers with annual incomes up to R$ 500,000 in the 2020/21 agricultural year. It also compares this share of credit from FCFs with the fraction that these producers have from other sources of rural credit and the value of gross revenue from agriculture.[20] In the Northeast region, lower-income producers have a greater share in the credit offered by FCFs than in other sources of credit and in the revenue from agriculture. This shows that the FNE is indeed able to direct resources to these smaller producers. In the other regions, however, despite the credit from FCFs being proportionally higher than the credit from the other funding sources, the fraction of the credit from FCFs is smaller than the fraction of these producers in the revenue from agriculture. As such, there does not seem to be an effective prioritization of FCF resources for these smaller producers.
Figure 6. Concentration of Rural Credit in 2020/21 and of Agricultural Revenue for Smaller Producers
Note: Share calculated considering producers with annual gross income up to R$ 500,000.
Source: CPI/PUC-Rio with data from the Central Bank of Brazil’s SICOR and from the IBGE’s 2017 Agricultural Census, 2022
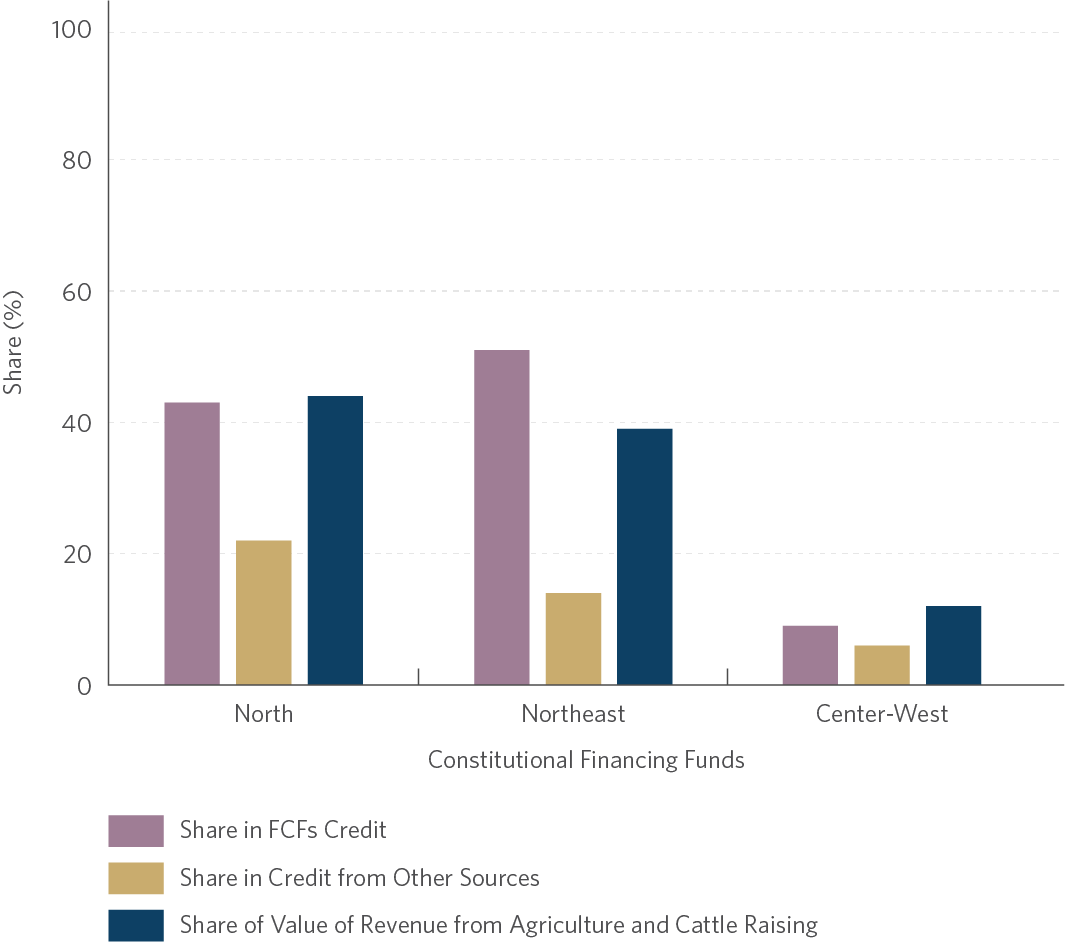
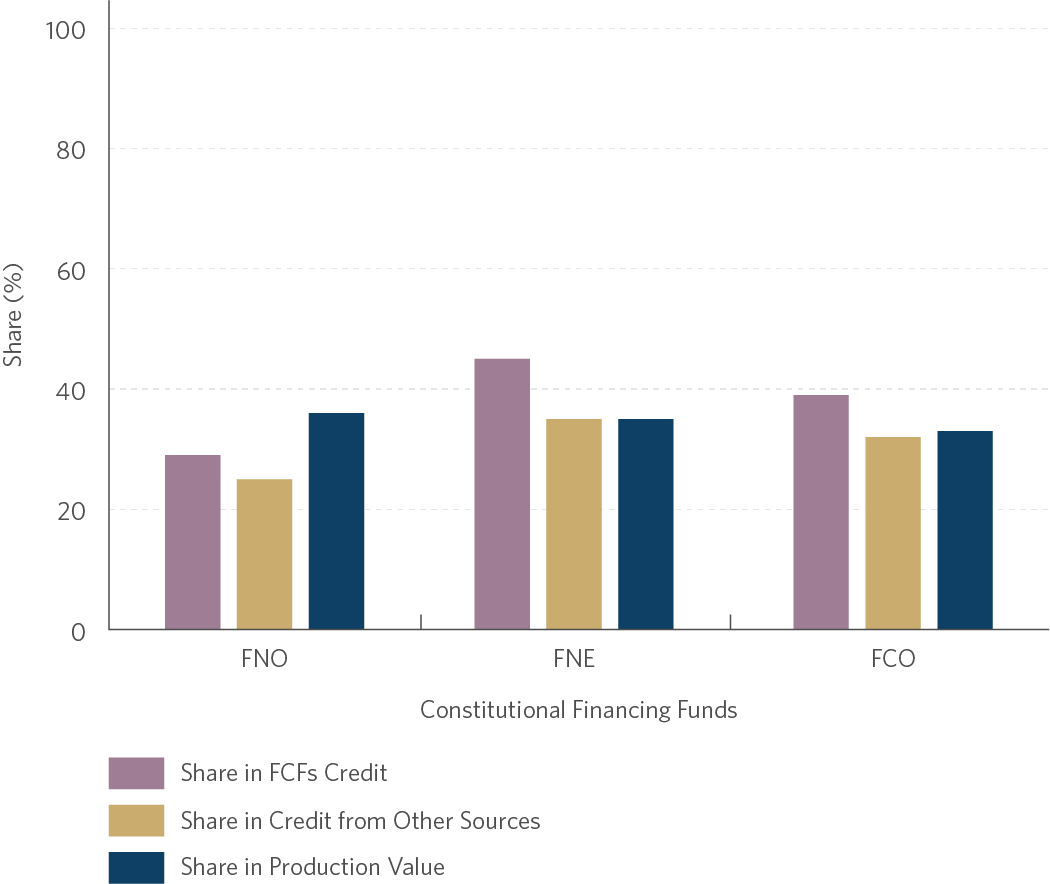
Figure 7 shows the concentration of FCF resources at the municipal level: the 5% municipalities that received the most resources from FCFs between the 2013/14 and 2020/21 agricultural years concentrated, on average, 43% of FNE resources, 36% of FNO resources, and 24% of FCO resources. These same municipalities also concentrated a smaller portion of the value of agricultural production, according to data from the 2017 Agricultural Census. The blue bars in Figure 7 indicate that the municipalities with the highest concentrations of resources from FCFs accounted for 34%, 21%, and 23% of the value of agricultural production of the FNE, FNO, and FCO, respectively.
Figure 7. Concentration of Rural Credit (2013/14 – 2020/21) and Production Value for main Municipality FCF Credit Recipients
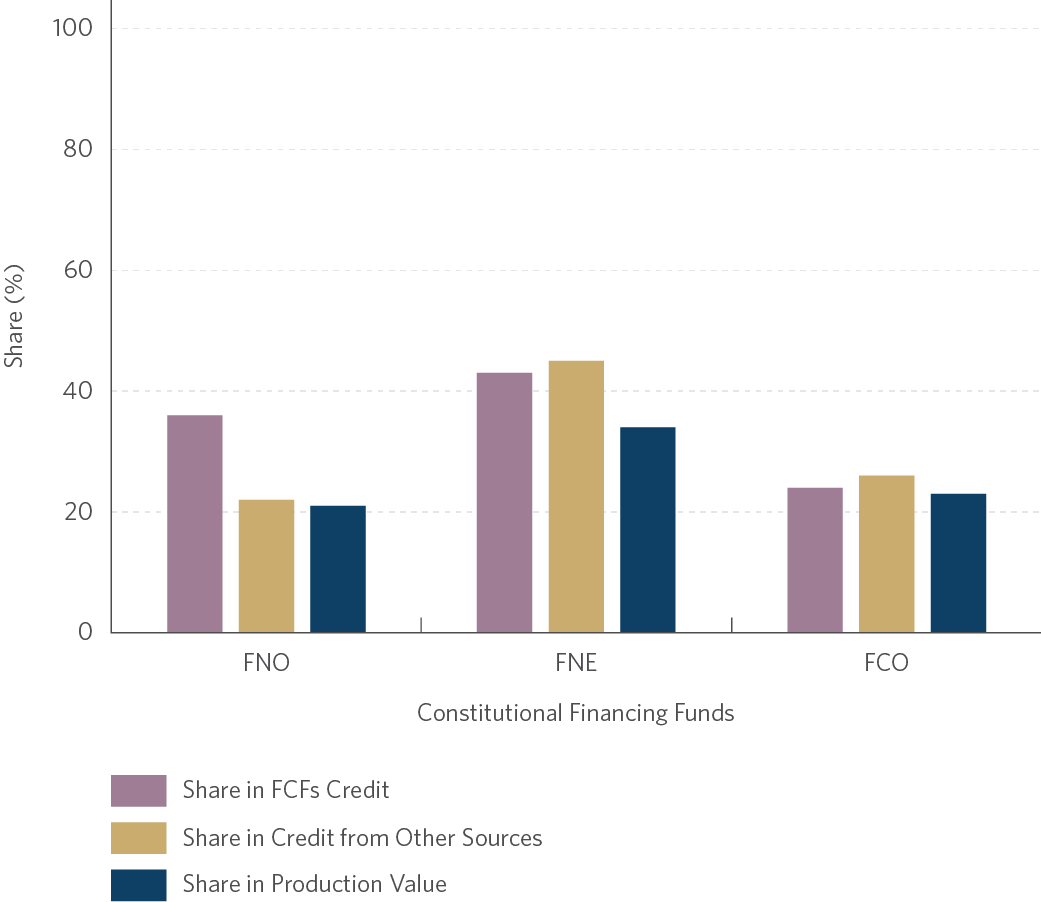
Note: Share calculated considering the top 5% municipalities that most received credit from FCFs between 2013/14 and 2020/21.
Source: CPI/PUC-Rio with data from the Central Bank of Brazil’s SICOR and from the IBGE’s 2017 Agricultural Census, 2022
There are geographic and temporal heterogeneities in the concentration of FCF resources. Figure 8 shows the number of years that each municipality remained among the top 5% recipients that received the most resources from FCFs between 2013/14 to 2020/21. Some municipalities in the Matopiba region – made up by the state of Tocantins and parts of the states of Maranhão, Piauí, and Bahia – stand out for keeping their positions as the main recipients of FCF credit throughout the period. This region is an important producer of soy and corn, representing 10% of the country’s production of those crops in 2018, according to data from Embrapa.[21]
Figure 8. Permanence of Municipalities among the Top 5% that Most Concentrate FCF Resources, 2013/14 – 2020/21
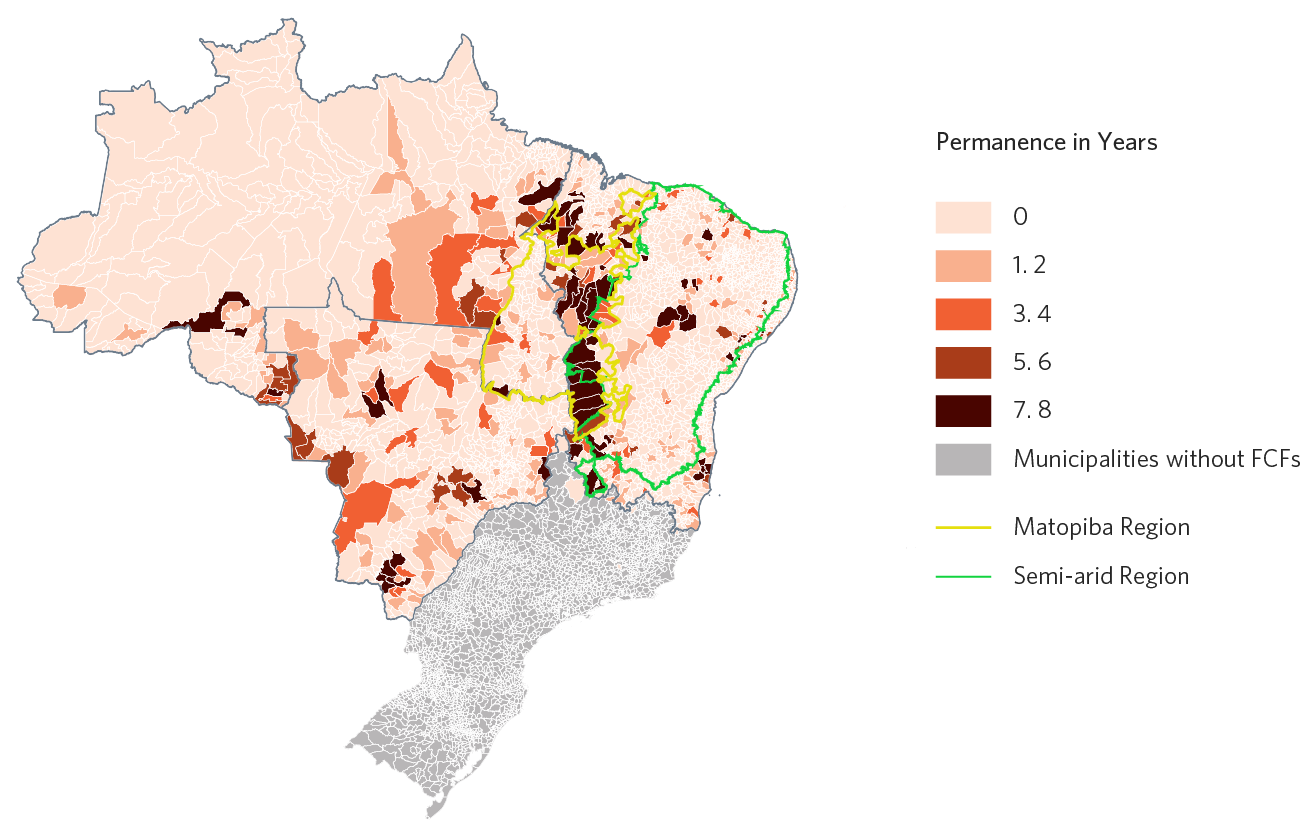
Source: CPI/PUC-Rio with data from the Central Bank of Brazil’s SICOR, 2022
Relevance of FCFs in the Rural Sector
Despite the concentration of resources, credit from FCFs is extremely important for the rural sector in these regions. In the 2020/21 agricultural year, FCFs allocated R$ 8.5 billion, R$ 7.6 billion, and R$ 6.8 billion to the rural sectors of the FNE, FCO, and FNO, respectively. The main products were cattle (35%); machines and implements (8%); soy (8%); harvesters, harvester pullers (6%); and tractors (5%).
Although apparently close, the amounts allocated by the FCFs represent different portions of the rural credit in each region. Figure 9a shows that FCFs represented, on average, around 36% of the total amount of rural credit in the FNE, 11% of rural credit in the FCO, and 32% in the FNO between the 2013/14 and 2020/21 agricultural years. The Midwest region features both the highest volume of total rural credit and the greatest diversity of funding sources.
FCFs also account for a significant portion of investment credit. According to Figure 9b, on average 36% of rural credit for investment in the Midwest region comes from the FCO, which is significantly higher than the 11% for total credit in the region. In the North and Northeast, the relevance of FCFs in rural credit for investment is even greater: on average, FCFs represent 52% and 39% of the volume of investment credit in the FNE and FNO, respectively.
Figure 9. Total Rural Credit, Rural Investment Credit and Respective Shares of FCFs by Region of Coverage, 2013/14-2020/21
a. Total Rural Credit Value and Participation
b. Value of Rural Credit for Investment and Participation
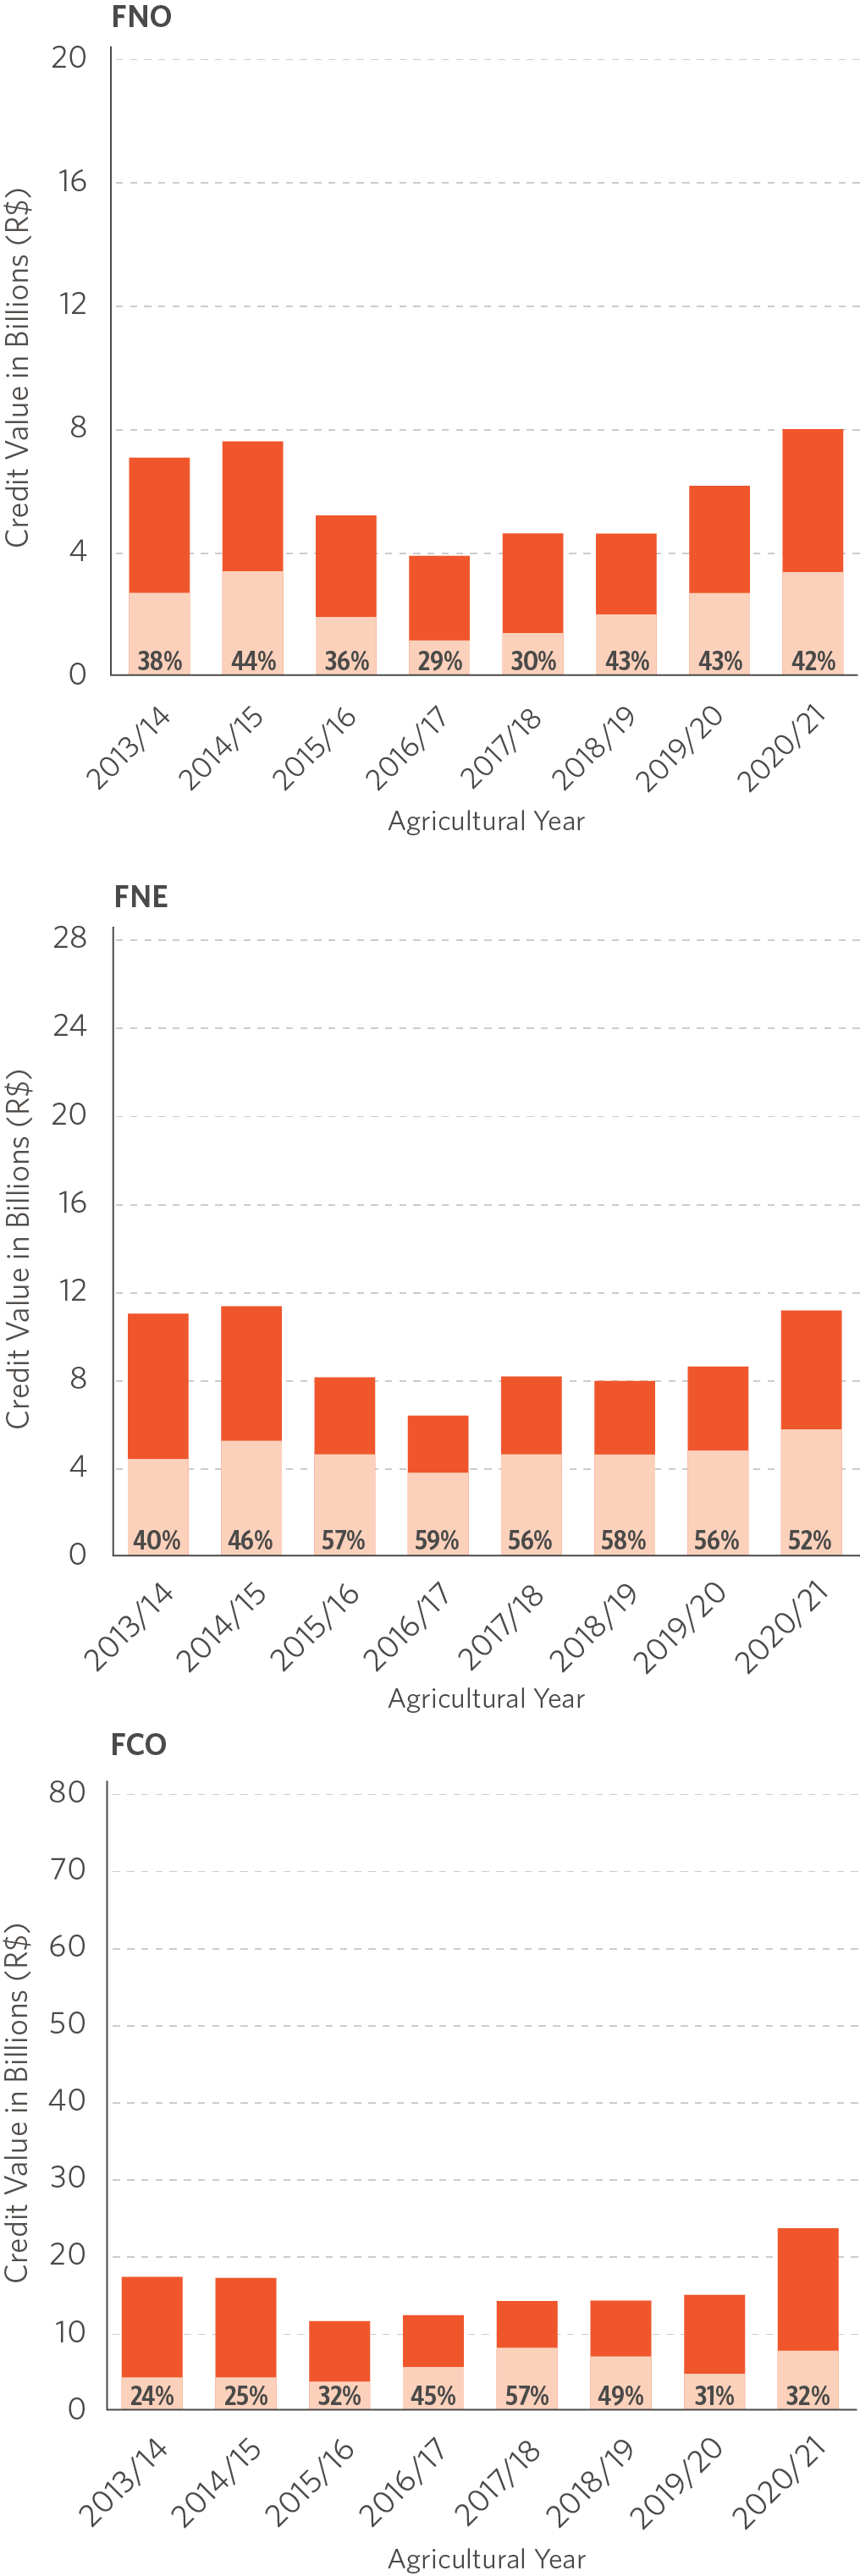
Source: CPI/PUC-Rio with data from the Central Bank of Brazil’s SICOR, 2022
The greater participation of FCFs in rural credit for investment seems to be in line with the funds’ objective to promote development in such regions. Investment credit could, for example, be used to finance the purchase of machinery and equipment and thus increase agricultural yields. Analyzing FCF’s credit for investment for 2020/21, 12% were allocated to acquiring machines and implements, 9% to harvesters and harvester pullers, and 7% to tractors. However, a very expressive portion of investment resources was directed to the cattle category (31%).
The differing degree of importance of FCFs to the rural sector in each of the regions has to do with the characteristics of credit markets. Municipalities located in the FCO region have more sources of rural credit than those in other regions: the median number of sources per municipality is seven for the FCO, five for the FNO and four for the FNE. Consequently, the percentage of municipalities where FCFs constitute the main source of funding is only 8% for the FCO, a number much lower than the almost 80% for the FNE, as seen in Figure 10.
Figure 10. Proportion of Municipalities by the Importance of FCFs as Sources of Credit, 2013/14 – 2020/21
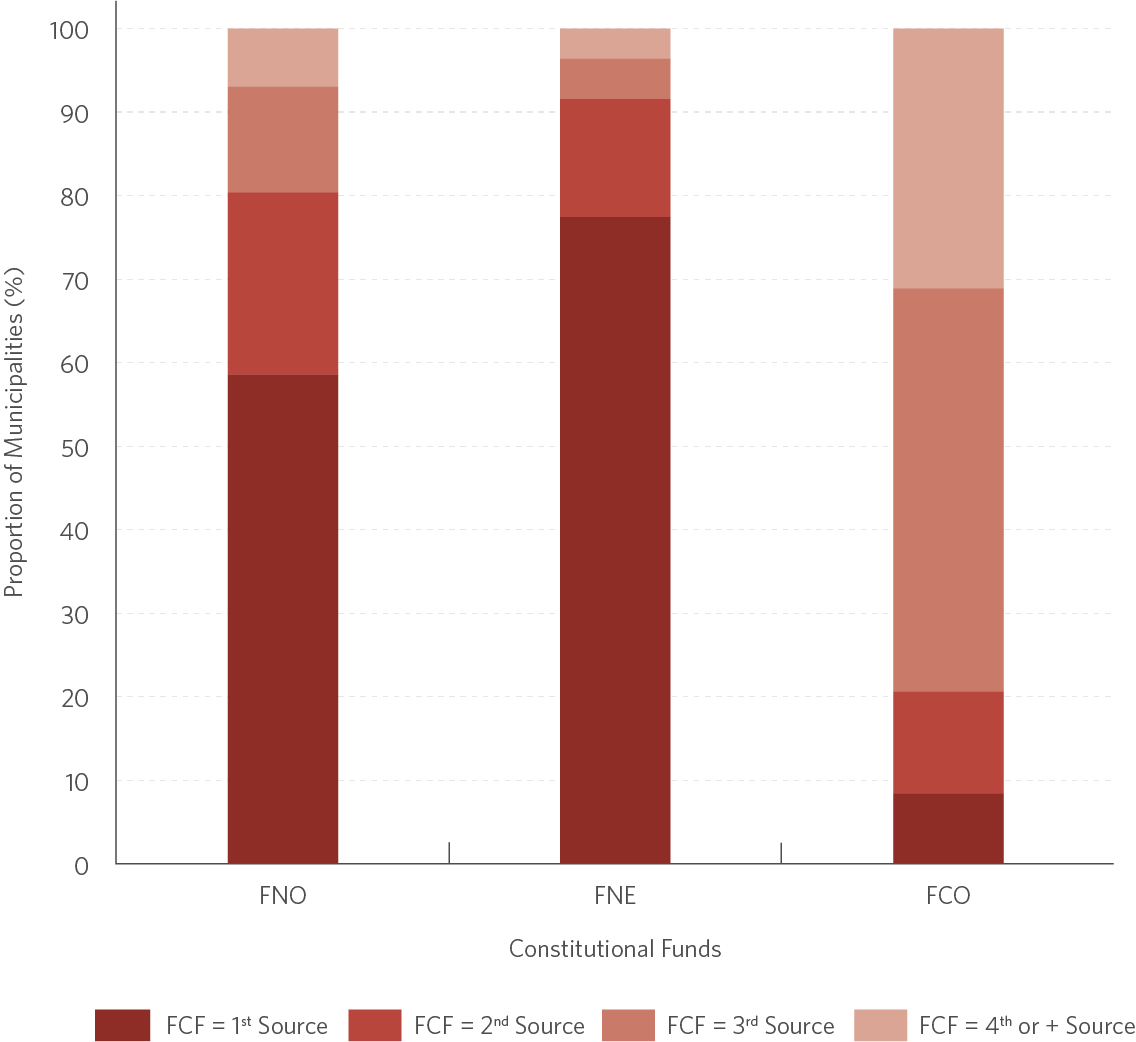
Source: CPI/PUC-Rio with data from the Central Bank of Brazil’s SICOR, 2022
The municipalities with the lowest Municipal Human Development Index (MHDI) in the regions covered by FCFs receive a smaller fraction of rural credit, as shown in Figure 11. However, in the FCO and FNE, municipalities with MHDIs below the median receive a greater share of resources from FCFs than from the other sources, and also greater than their share of the total value of production in their respective regions. In other words, FCO and FNE funding seems to be directed more towards agricultural activities in less developed municipalities than in more developed ones, proportionally. In the FNO, municipalities with lower MHDIs proportionately concentrate less of the FCF credit than the value of agricultural production, implying a weaker preference for rural activity.[22],[23]
Figure 11. Concentration of Rural Credit and Production Value by Less Developed Municipalities
Note: Share calculated considering the 50% municipalities with the lowest MHDI.
Source: CPI/PUC-Rio with data from the Central Bank of Brazil’s SICOR, from IBGE’s 2017 Agricutural Census and from UNDP 2010, 2022
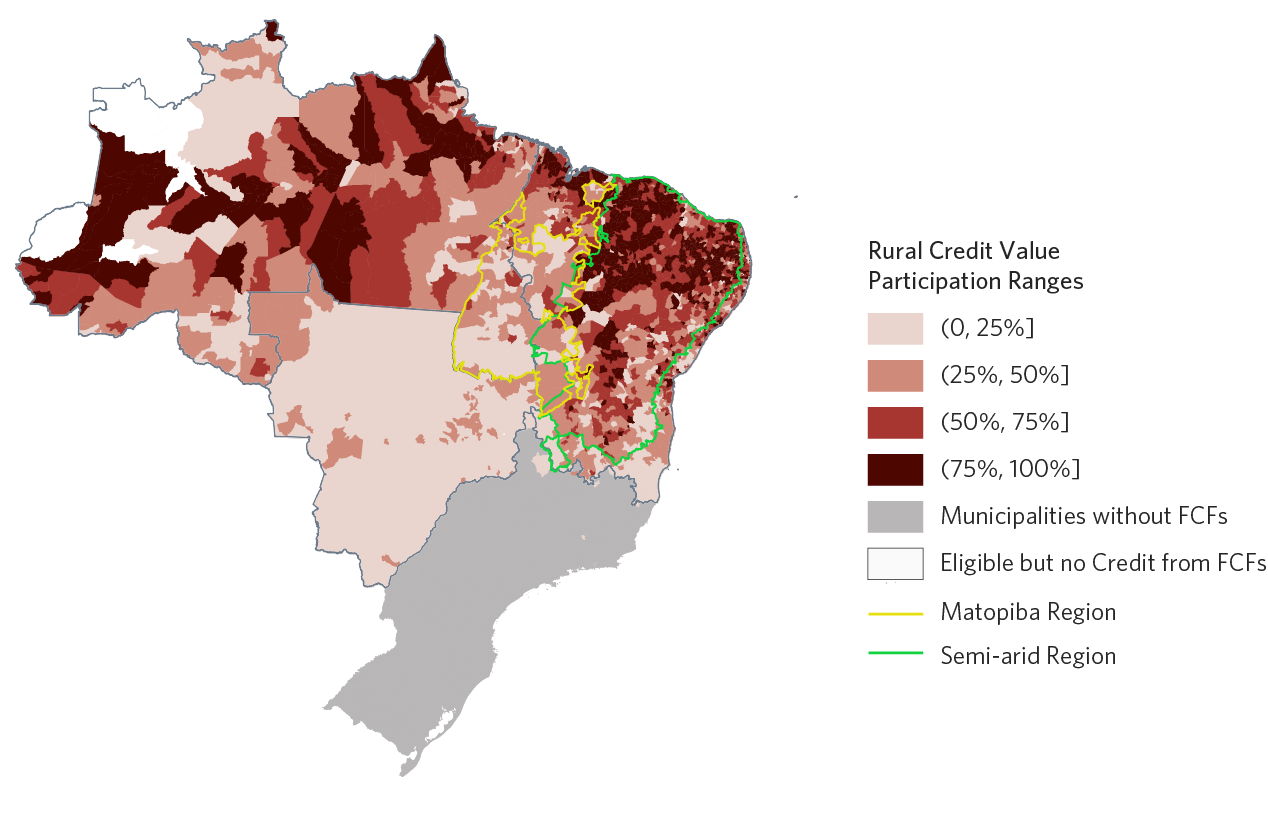
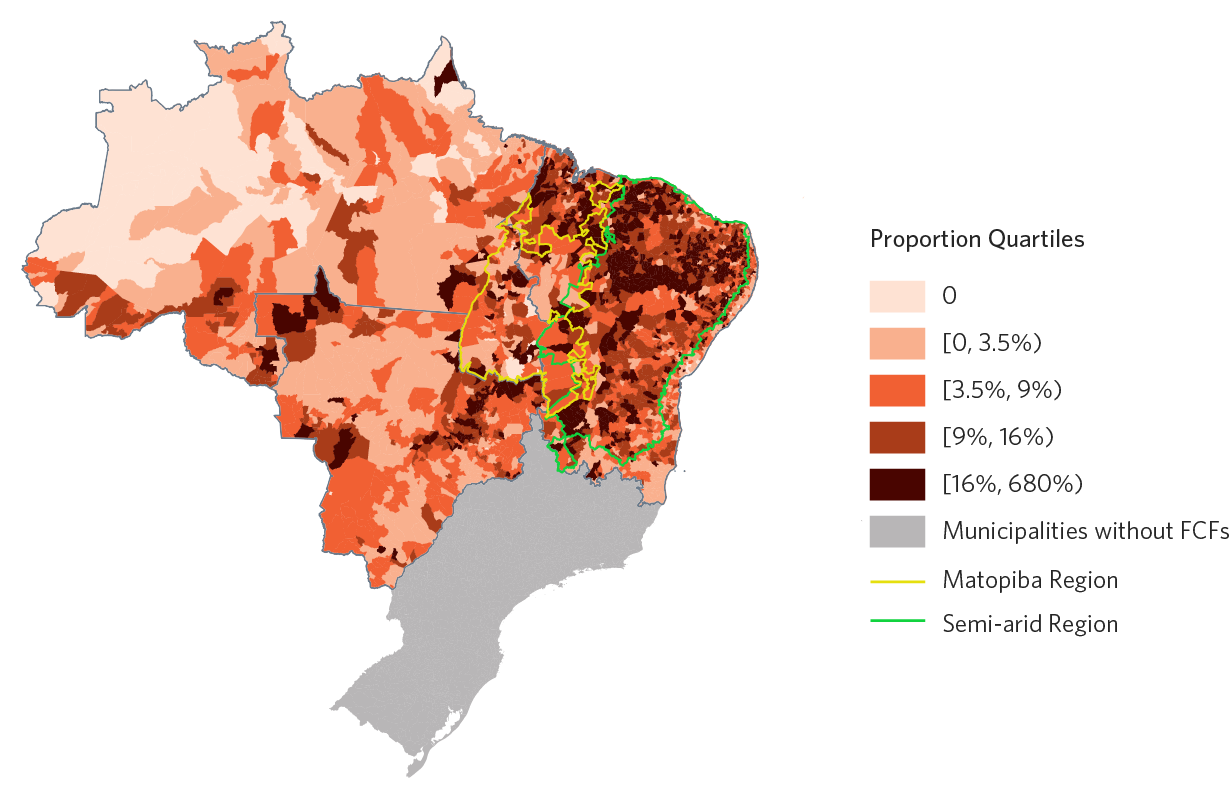
There are marked differences in the relevance of FCF resources to municipalities. Figure 12a shows the participation of FCFs in the total amount of rural credit contracted in each municipality between the 2013/14 and 2020/21 agricultural years. The degree of municipal dependence on FCF resources, mainly in the North and Northeast regions, is quite heterogeneous. In these regions, there are municipalities where FCF resources account for less than 25% of the total rural credit contracted (mostly in Matopiba) and, at the same time, municipalities where FCF resources account for more than 75% (mostly in the semi-arid). In the Midwest region, resources from FCFs can represent up to 25% of the rural credit contracted in most municipalities. Figure 12b shows credit from FCFs as a proportion of the value of agricultural production at the municipal level. Regions more dependent on FCF resources (e.g., municipalities in the semi-arid) are also the ones with the highest shares of agricultural production financed by FCFs. In other words, in these places there seem to be few alternative credit sources available for agricultural production.
Figure 12. Municipal Distribution of the Importance of FCF Resources
a. Participation of FCFs in the Total Value of Rural Credit in the Municipality
Average Calculate for Agricultural Years 2013/14 to 2020/21
b. Rural Credit from FCFs by Value of Municipal Agricultural Production
Agricultural Census 2017 and SICOR 2016/17
Source: CPI/PUC-Rio with data from the Central Bank of Brazil’s SICOR and from the IBGE’s 2017 Agricultural Census, 2022
The relevance of FCF resources is even more evident when comparing certain socioeconomic characteristics of municipalities grouped by share of FCFs in total rural credit. Table 4 compares municipal characteristics based on data from the 2010 Census, from the UNDP and from the 2017 Agricultural Census. It should be noted that the municipalities most dependent on FCFs – i.e., those in which FCF resources account for more than 75% of rural credit – show lower levels of development as measured by the MHDI, in addition to higher illiteracy rates. Average monthly nominal incomes are also lower than in other municipalities, as well as the value of agricultural production and the areas of rural properties.
Table 4. Socioeconomic Characteristics of Municipalities by Level of Dependence on FCFs Resources, 2010 and 2017
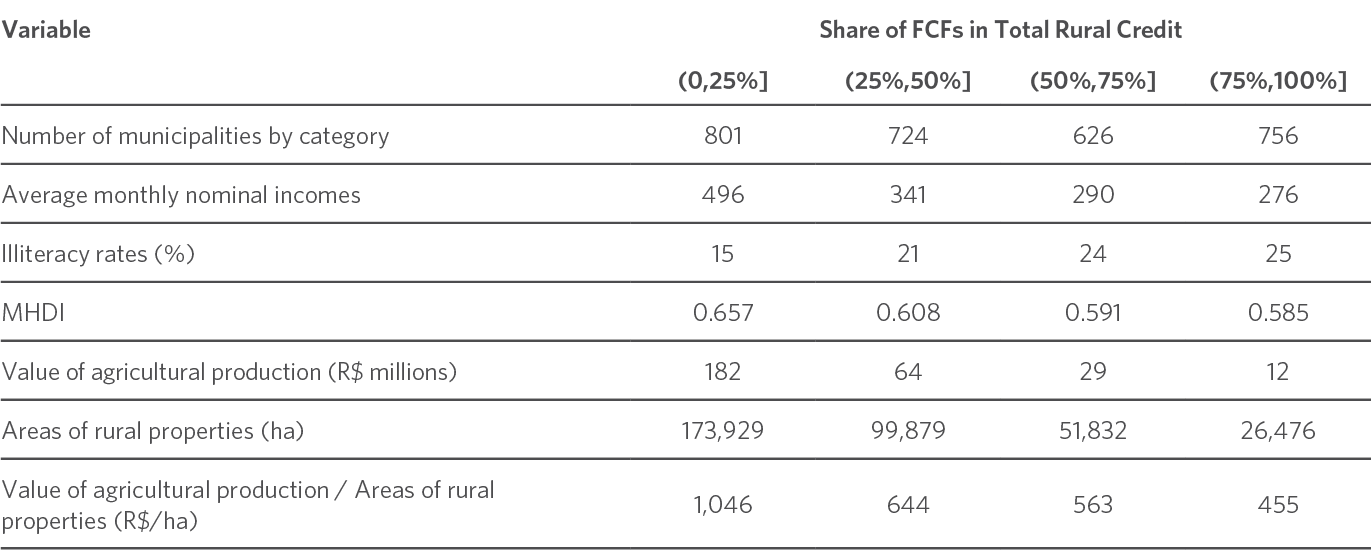
Source: CPI/PUC-Rio with data from the IBGE’s 2010 Census, the 2010 UNDP and the 2017 IBGE’s Agricultural Census, 2022
Therefore, despite the many types of beneficiaries and priority locations, FCFs remain enormously relevant to less developed regions where no alternative credit sources exist. A significant number of municipalities depend almost exclusively on these resources. For example, between 2013 and 2020, an average of 238 municipalities – i.e., 8% of the total number of municipalities covered – had no credit sources other than FCFs. Meanwhile, as seen in the previous section, a considerable portion of rural credit is still concentrated in just a few municipalities. Therefore, the targeting of FCFs must be improved so they may foster the development of their regions, in line with their objectives.
Conclusion
This study provides an overview of FCFs and how they operate. Despite rules that aim to prioritize the allocation of resources to smaller beneficiaries and less developed regions, the current type classifications are overly comprehensive and compromise the effective prioritization of resources. Furthermore, revisions to beneficiary classes and priority municipalities have made the criteria even less restrictive over the years. A striking example was the creation, in 2011, of the small-medium scale priority beneficiary class, with annual gross income up to R$ 16 million. Both the breadth of priorities and the loosening of criteria over the years have led to a concentration of FCF resources. Therefore, redefining these criteria and simplifying the rules can help improve resource allocation and enable a better understanding and assessment of the policy’s direction.
Finally, it should be asked whether rural credit is the most appropriate policy to achieve the goals of reducing poverty and regional income disparities in Brazil. It is important to compare the effectiveness and the impacts of the subsidized credit policy with those of public policies meant to combat poverty and inequality directly.
The authors would like to thank Barbara Intropidi, Gabriel Campos and Pedro Vogt for research assistance, Juliano Assunção and Daniel da Mata for their input, Natalie Hoover El Rashidy and Giovanna de Miranda for editing and revision, and Julia Berry and Meyrele Nascimento for formatting and graphic design. The authors are also grateful to the Ministério da Agricultura, Pecuária e Abastecimento, Ministério da Economia, Banco Central, Banco da Amazônia, Banco do Nordeste, and Banco do Brasil for the valuable discussions.
[1] Binswanger, Hans P., Shahidur R. Khandker, and Mark R. Rosenzweig. “How infrastructure and financial institutions affect agricultural output and investment in India”. Journal of Development Economics 41, no. 2 (1993): 337-366. bit.ly/3HUprwY.
[2] Duflo, Esther, Michael Kremer, and Jonathan Robinson. “How high are rates of return to fertilizer? Evidence from field experiments in Kenya”. American Economic Review 98, no. 2 (2008): 482-88. bit.ly/3oWII8s.
[3] Assunção, Juliano and Priscila Souza. O Impacto do Crédito Rural na Agricultura Brasileira e no Meio Ambiente. Rio de Janeiro: Climate Policy Initiative, 2019. bit.ly/3cL3x1a.
[4] Assunção, Juliano and Priscila Souza. Os Impactos do Crédito Rural na Produção Agropecuária e no Uso da Terra: Uma Análise por Linhas de Crédito, Tipo de Produtor e Finalidade do Crédito. Rio de Janeiro: Climate Policy Initiative, 2020. bit.ly/3oXsGLJ.
[5] Art. 2 and 3 of Law No. 7,827/1989. bit.ly/3d22oSJ.
[6] Art. 2 and 3 of Law No. 7,827/1989. bit.ly/3d22oSJ.
[7] The PNDR was formalized by Decree No. 6,047/2007. bit.ly/3r3Nxzr. It has recently been amended by Decree No. 9,810/2019. bit.ly/3l57a6C.
[8] Art. 3 of Law No. 7,827/1989. bit.ly/3d22oSJ.
[9] Data obtained from the 2020 financial year reports available at: FNO (bit.ly/3666cCr), FNE (bit.ly/3rHAWlG) and FCO (bit.ly/3Bcd7W4).
[10] Ministry of Regional Development. Fundos Regionais e Incentivos. bit.ly/2ZhzyKS.
[11] Data obtained from Banco da Amazônia via Brazil’s Freedom of Information Act and from Banco do Nordeste’s website (bit.ly/3K4rYG0) show that the realization of FCF resources is closely aligned with the budgetary schedule. For the FNO, the total amount spent per year between 2016-2020, on average, was BRL 5.8 billion, with the rural sector representing 55%. For the FNE, the total amount spent per year between 2016-2020, on average, was BRL 24.7 billion, with the rural sector representing 30%. Data on FCO resource execution could not be obtained.
[12] Assunção, Juliano and Priscila Souza. A Fragmentação de Regras do Crédito Rural Brasileiro. Rio de Janeiro: Climate Policy Initiative, 2018. bit.ly/3FFDGE7.
[13] IBGE. Censo Agropecuário 2017. Data broken down by income classes from agricultural activities, obtained upon request to the Brazilian Institute of Geography and Statistics (Instituto Brasileiro de Geografia e Estatística – IBGE).
[14] Ministry of Agriculture and Food Supply. Investimentos. Access date: December 21, 2021. bit.ly/3yJShMB.
[15] Banco Central do Brasil. Manual de Crédito Rural. Access date: November 23, 2021. bit.ly/3l2V5yR.
[16] IBGE. Censo Agropecuário 2017. Data broken down by income classes from agricultural activities, obtained upon request to the Brazilian Institute of Geography and Statistics (Instituto Brasileiro de Geografia e Estatística – IBGE).
[17] In 2018, both the special sub-regions and the classifications of PNDR typologies were revised. The revision, instituted by Ordinance no. 34 of January 18, 2018, added a few municipalities in the semi-arid and RIDES regions and expanded the number of PNDR typology classes from four (low-income, stagnant, dynamic, and high-income) to nine (all the different combinations of high, medium and low income and high, medium, and low dynamism).
[18] One way to differentiate municipalities based on their classification in the PNDR is to offer different interest rates. For this, a location factor of 0.9 is applied in the calculation of interest rates in low- and medium-income municipalities and a factor of 1.1 is used when calculating interest rates for high-income municipalities. This location factor does not affect the interest rates calculated for the rural sector.
[19] There is no similar rule in FNO’s 2021 budgetary schedule that establishes a maximum limit for resources directed to high-income municipalities.
[20] The class up to R$ 500,000 is close to the “mini-scale producer” class in the FCFs. This amount was used because the SICOR-BCB and 2017 Agricultural Census databases do not have information on the other producer scale classes used by the FCFs.
[21] The Matopiba region was created by Decree No. 8,447/2015. bit.ly/3nJxHb3.
[22] The results in Figure 11 remain valid even when considering the 10% municipalities with the lowest MHDIs.
[23] The concentration of resources from FCFs in the most developed municipalities was highlighted by Resende, Guilherme Mendes, Diego Firmino Costa da Silva and Luís Abel da Silva Filho. “Avaliação dos efeitos econômicos dos Fundos Constitucionais de Financiamento do Nordeste, do Norte e do Centro-Oeste: uma análise por tipologia da Política Nacional de Desenvolvimento Regional entre 1999 e 2011”. IPEA no. 2145 (2015). bit.ly/3HRCL5l.
