Mapping the Effect of Deforestation on Rainfall: a Case Study from the State of Mato Grosso
Rainfall and the Role of the Amazon Forest
The Amazon Forest provides many crucial ecological services in Brazil and beyond, including serving as a carbon sink and regulating air quality. Without these benefits, Brazil and other countries would lose a primary support to their development and existence. Often in climate discussions, the forest is reduced to a carbon sink and forest loss is only used to account for emissions, but one important ecological service worthy of greater consideration is the forest’s ability to control rainfall at a continental scale, which affects agricultural production, energy generation, and urban water supply.
In this insight, Climate Policy Initiative/Pontifical Catholic University of Rio de Janeiro (CPI/PUC-Rio) show that Amazon deforestation affects rainfall in the state of Mato Grosso – one of the most important agricultural hubs in the world, home to more than three million people, and 8 hydroelectric power plants. As a case study, CPI/PUC-Rio shows that the deforestation of the Xingu River region could lead to a decrease of 7% of the annual historical average precipitation in the state of Mato Grosso. This impact varies greatly across the state and throughout the seasons. The estimated decrease in the wet season due to deforestation could reach 8% of the historical seasonal rainfall average, with the center and north of the state being the most affected. During the dry season, the estimated impact of deforestation could result in a 15% decrease of the historical seasonal average, with the center and the northwest regions being the most affected.
Table 1. Impact of Deforestation on Rainfall Reduction in Mato Grosso
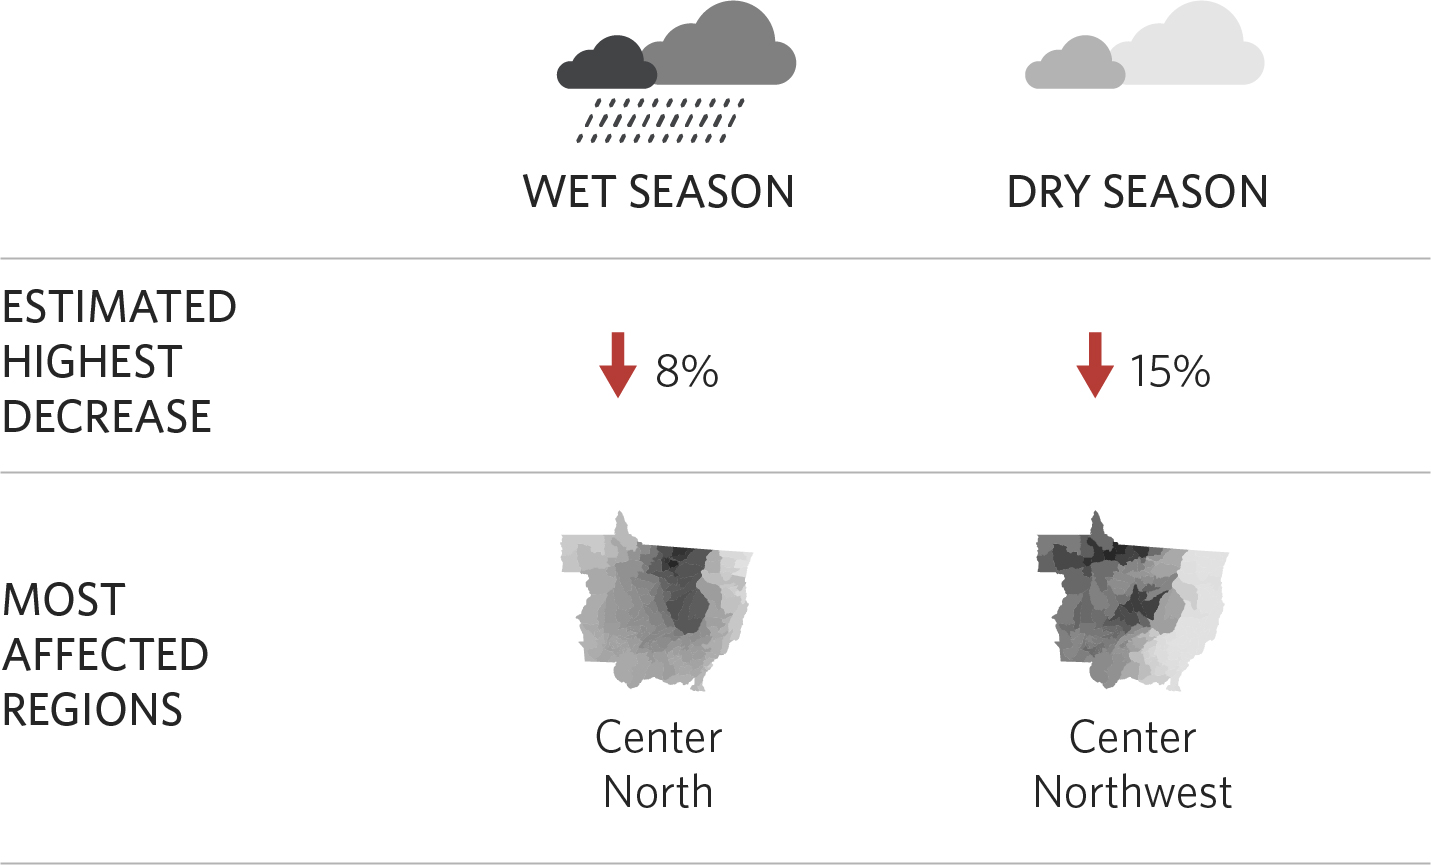
Source: CPI/PUC-Rio, 2021
Continental precipitation starts in the ocean where the sun’s energy converts salt water to water vapor that is then transported through atmospheric circulation to continental lands. In doing so, each air parcel travels over different types of terrain, including densely populated areas, huge monoculture landscapes of soybeans, and dense tropical forest areas. Each type of terrain sustains and provides humidity to each air parcel differently. Forest areas, among all types, maintain and provide the most humidity to the air. The implication of this process is straightforward: air that travels over forest delivers more rainfall. As a result, deforestation reduces rainfall.
Figure 1. Rainfall Trajectory
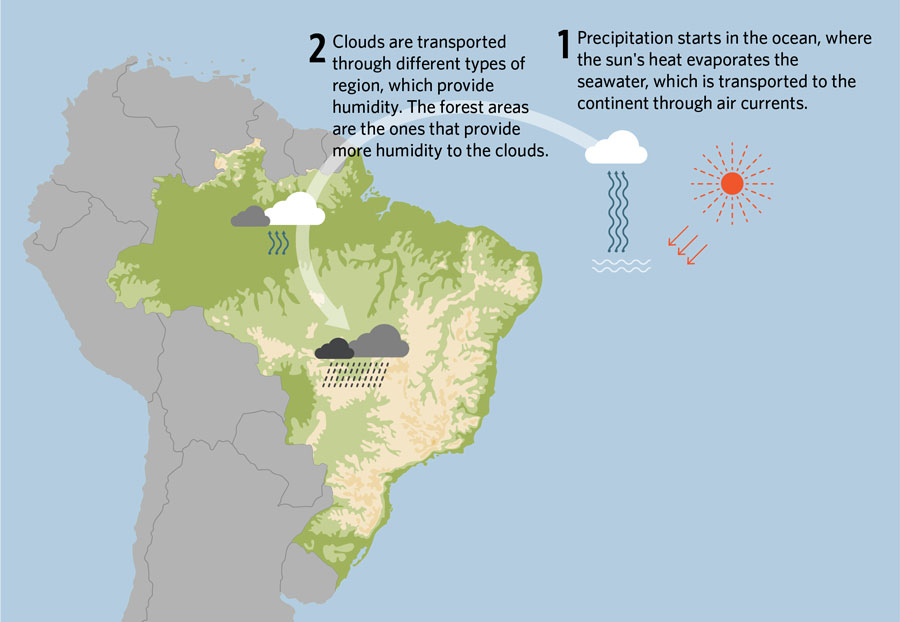
Source: CPI/PUC-Rio, 2021
Significantly, this rainfall process takes place over large areas covering thousands of kilometers, which means the Amazon’s deforestation affects rainfall not only in Brazil but also in Argentina and other South American countries.
This insight summarizes findings using atmospheric transport model to connect deforestation in the Amazon to rainfall in the state of Mato Grosso. Furthermore, it provides a general framework that can be adapted as a tool to analyze the effects of deforestation on rainfall in different settings.[1]
How Deforestation Affects Rainfall: Case Study in Mato Grosso
Rainfall levels in the state of Mato Grosso are already on decline and deforestation may further reduce them. Figure 2a shows a slight drop in overall annual mean precipitation over the 35-year period between 1985 and 2020. However, the results of this study illustrate how precipitation may decline even further if deforestation increases. Also, the marked gap between wet and dry seasons (Figure 2b) may widen even more.
Figure 2. Rainfall in Mato Grosso, 1985-2015
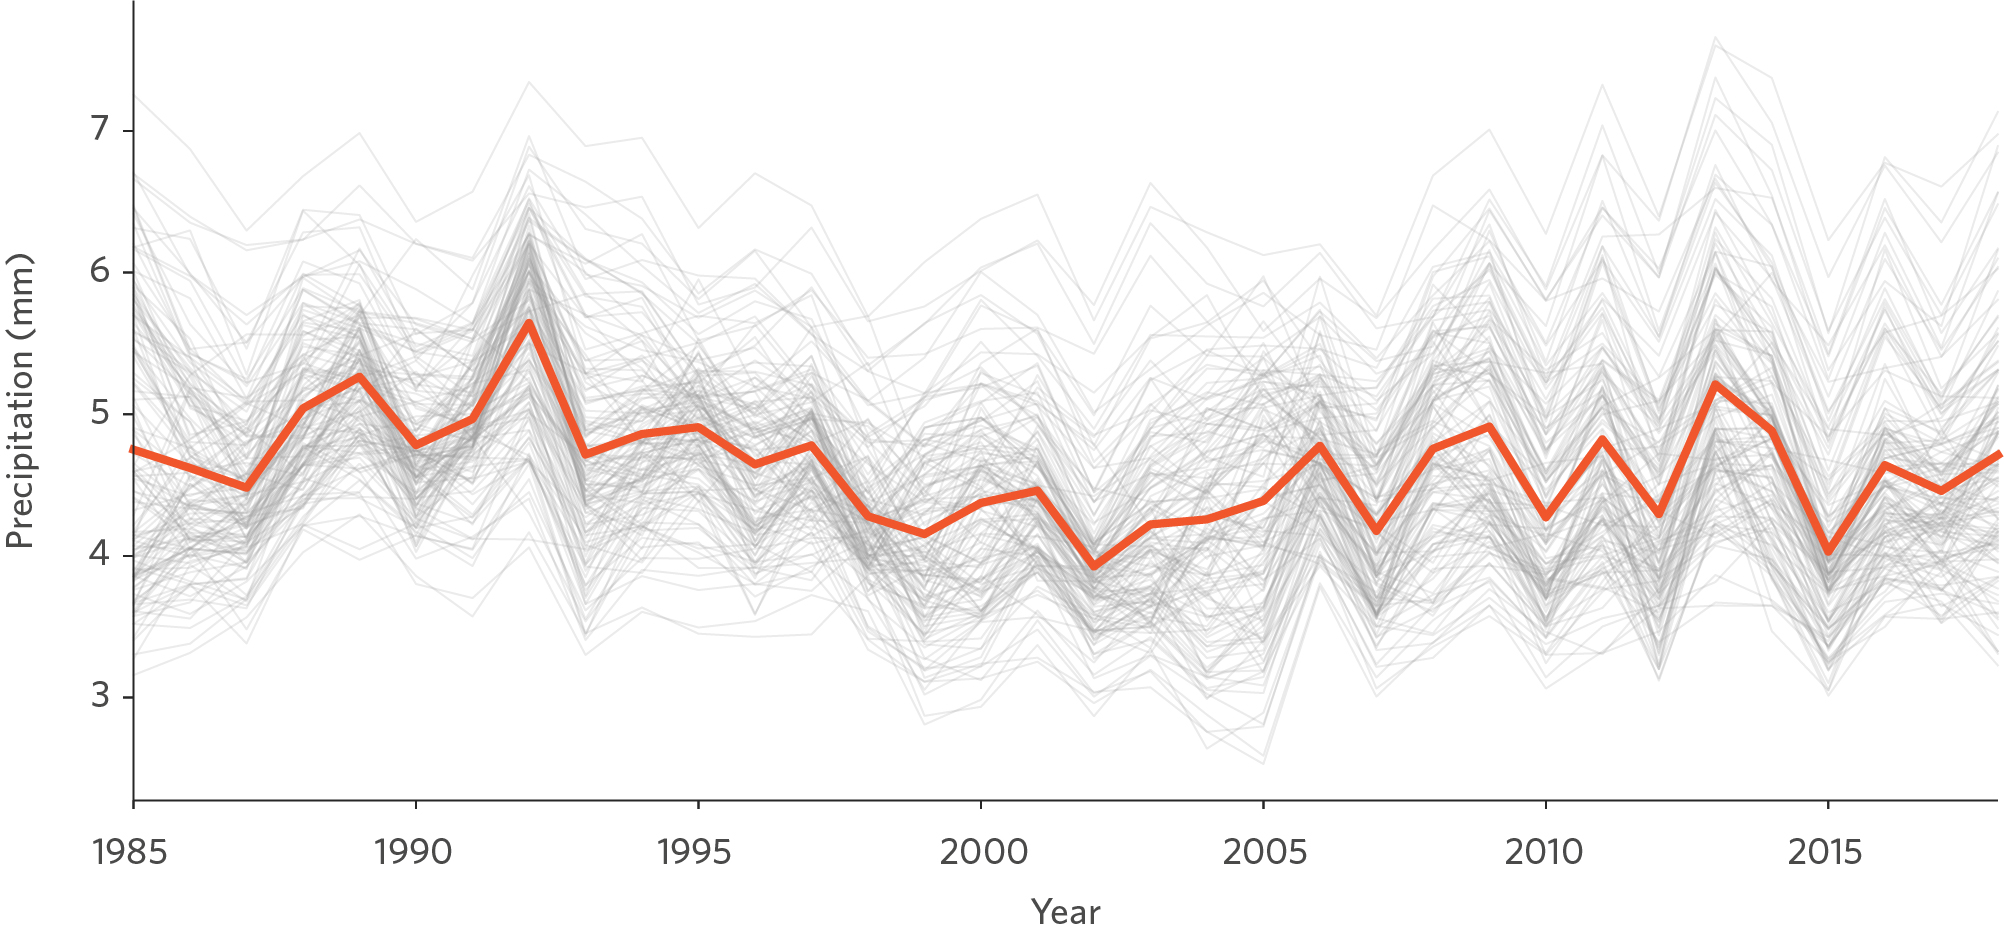
These figures show the average annual precipitation (Figure 2a) and monthly average precipitation (Figure 2b) for each municipality in the state of Mato Grosso. Figure 2a shows a slight decline trend, particularly between 1985 and 2005, while Figure 2b illustrates the markedly difference between the dry season (May to August) and the wet season (September to April).
Source: CPI/PUC-Rio with data from ERA5, 2021
To further investigate this phenomenon, the author considered what would happen if deforestation expanded over the Indigenous territories located in the Xingu River Basin (Figure 3). This Basin comprises eleven Indigenous territories that cover 140,000 km2. Apart from the northern region, the surroundings of this area have been completely deforested, due to expanded soybean planting and cattle pastures.
Figure 3. Indigenous Territories in Xingu’s River Basin
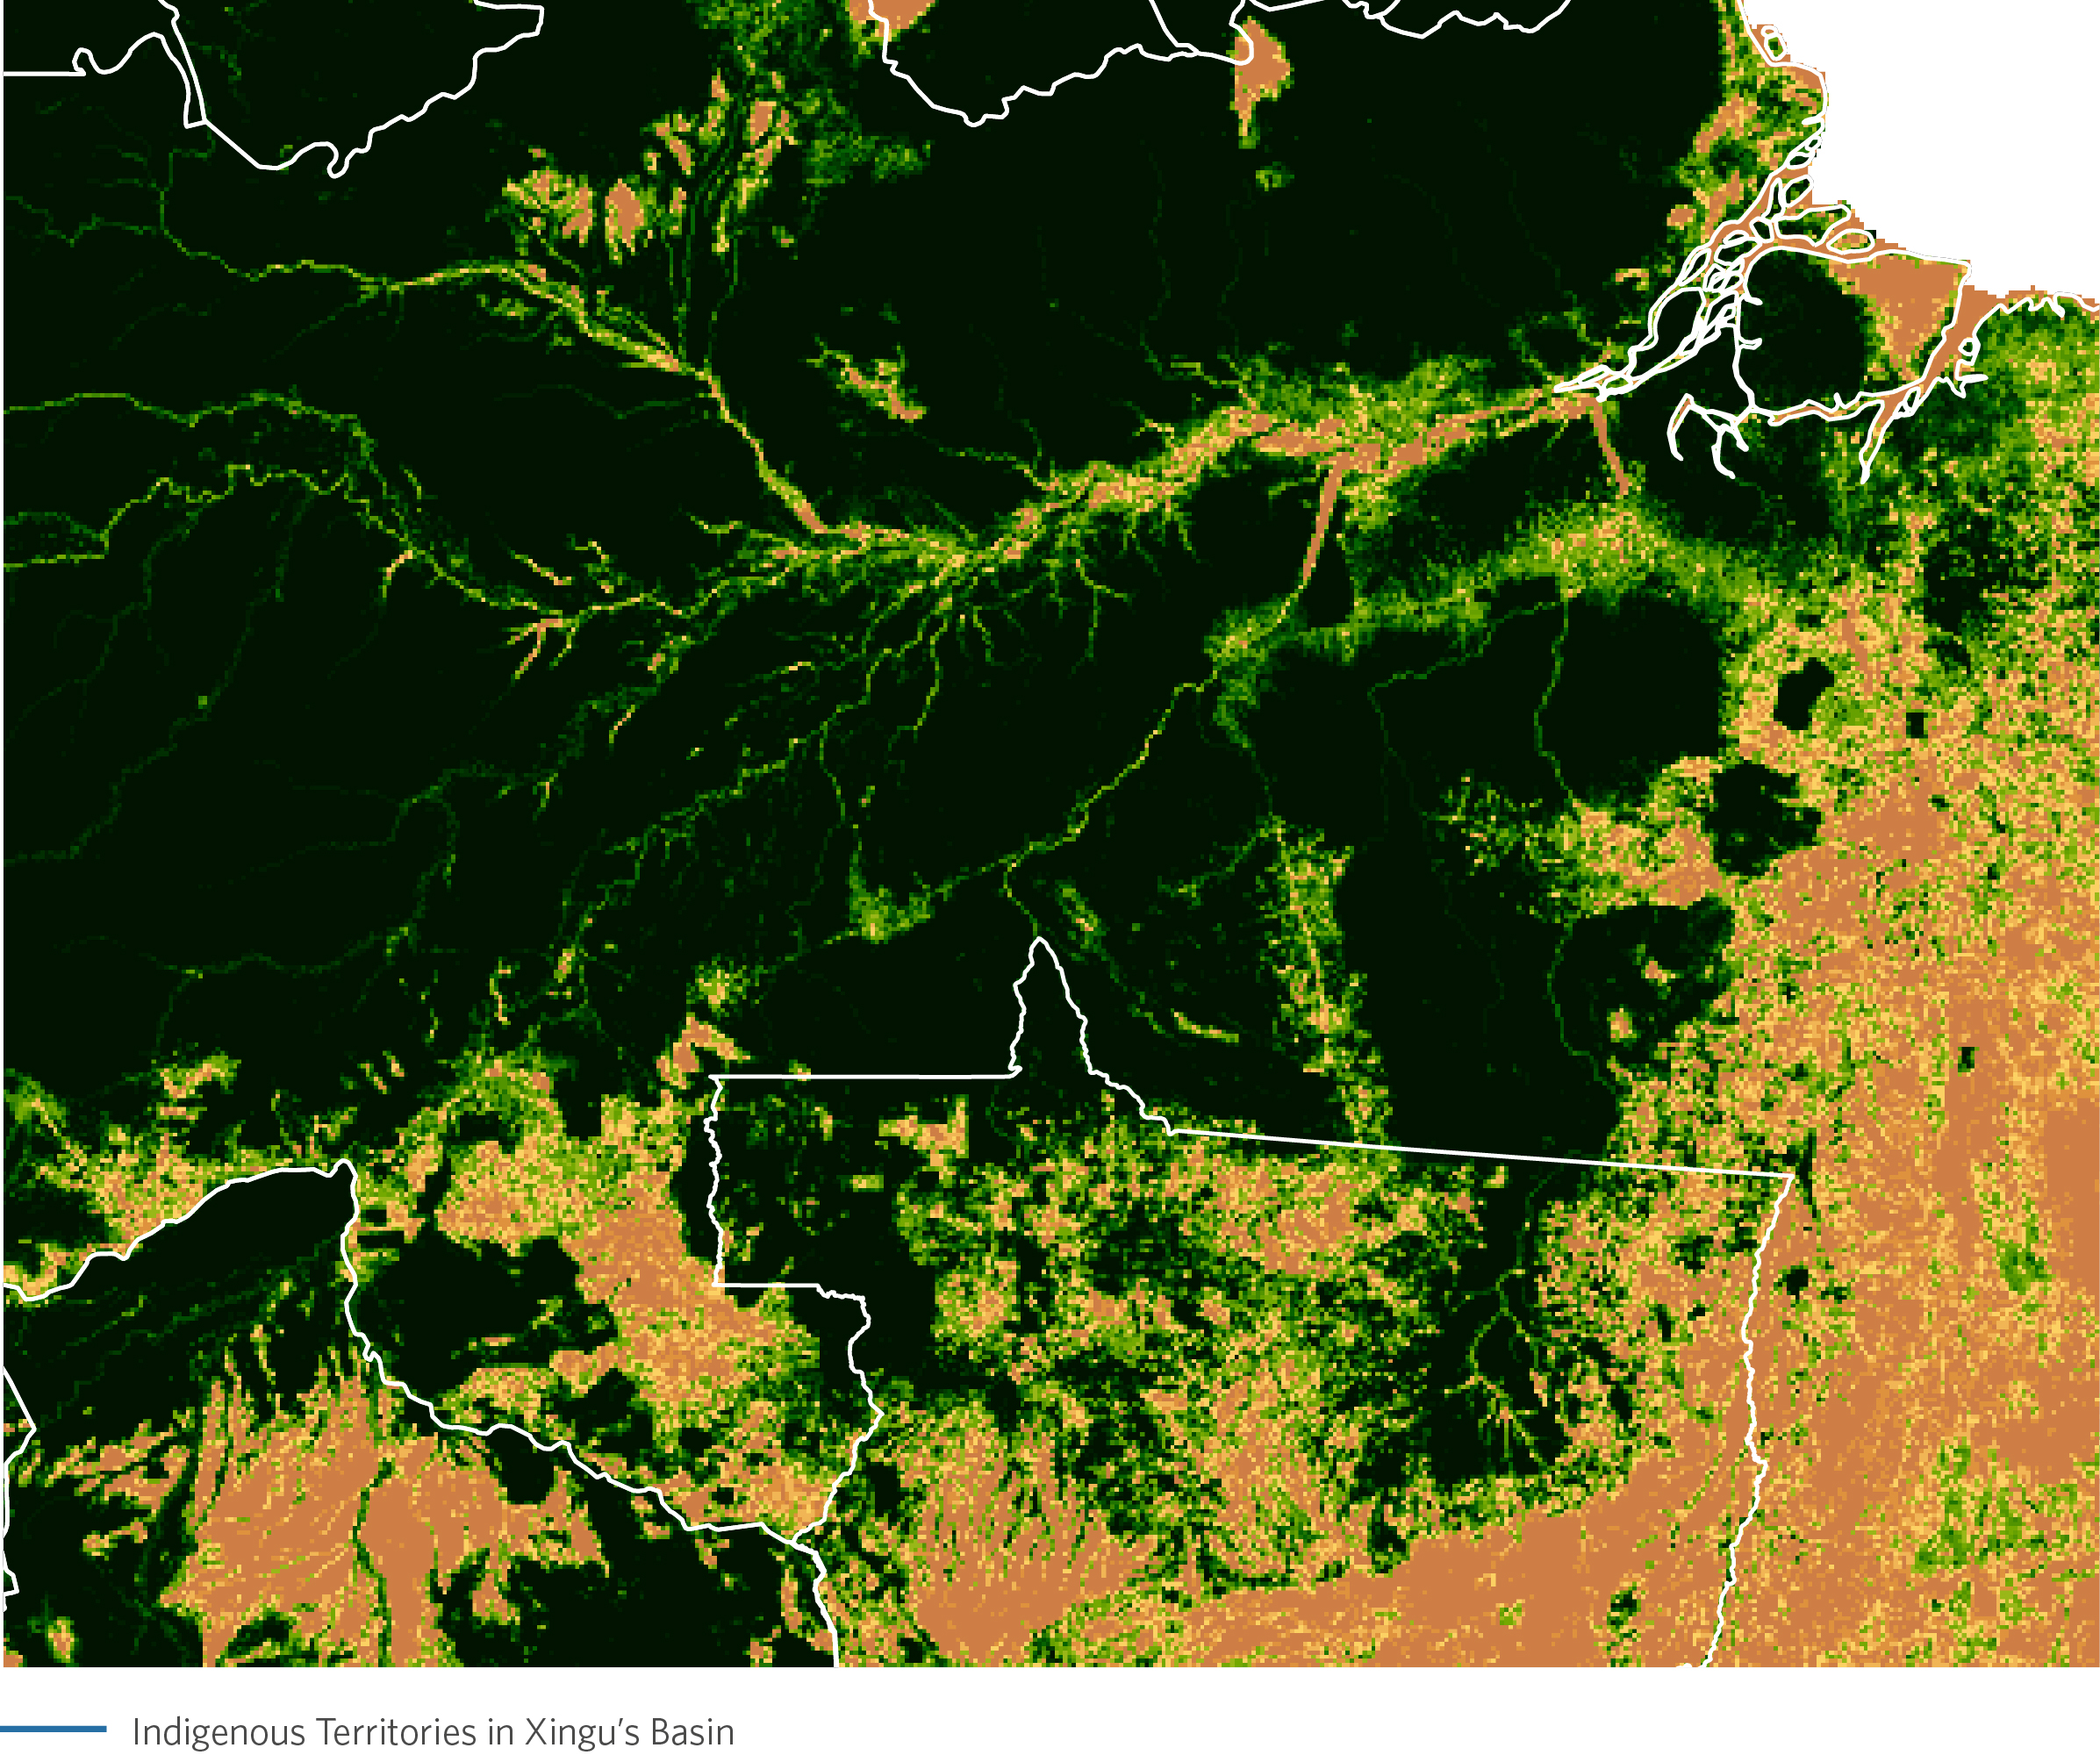
This figure shows the location of the Indigenous Territories of the Xingu River Basin. This is the region that, in the counterfactual scenario, is totally deforested.
Source: CPI/PUC-Rio with data from FUNAI and MapBiomas, 2021
How much rainfall do the territories located in the Xingu River Basin provide to the state of Mato Grosso? Which regions of the state benefit the most from this ecological service? To answer these questions, it is necessary to build a counterfactual scenario where the entirety of the Xingu’s Indigenous Territories is deforested. This counterfactual exercise shows an average decrease of 7% of the annual historical average precipitation in the state of Mato Grosso.
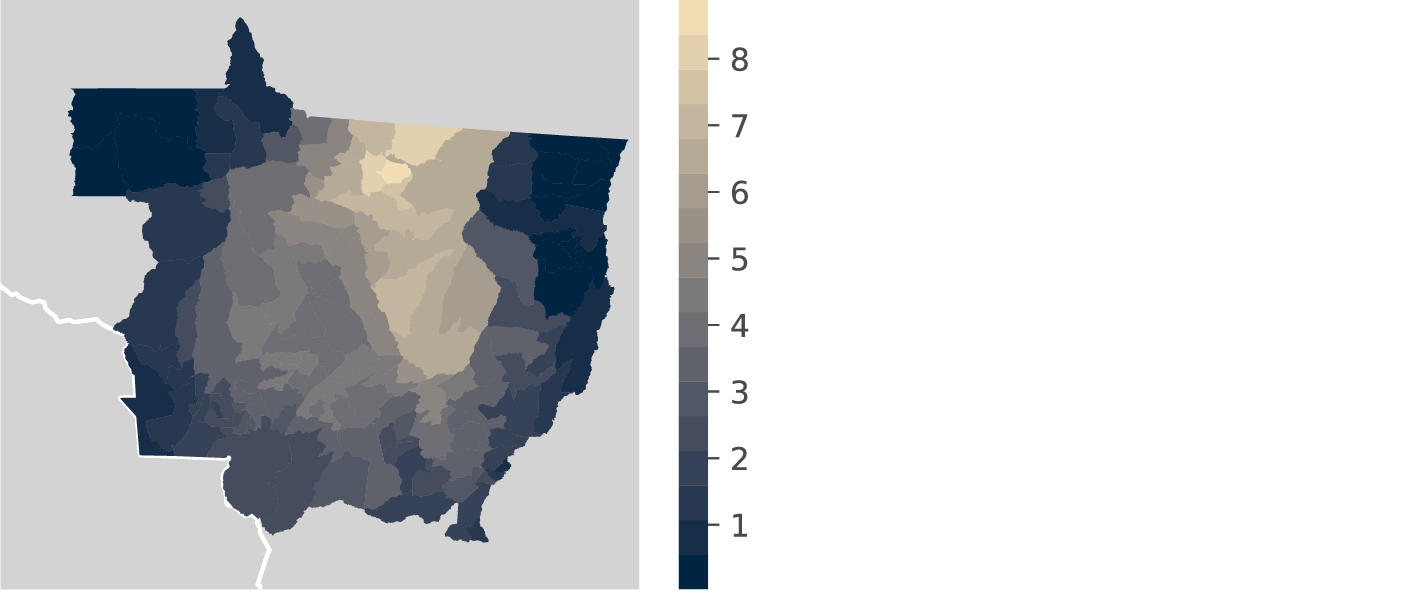
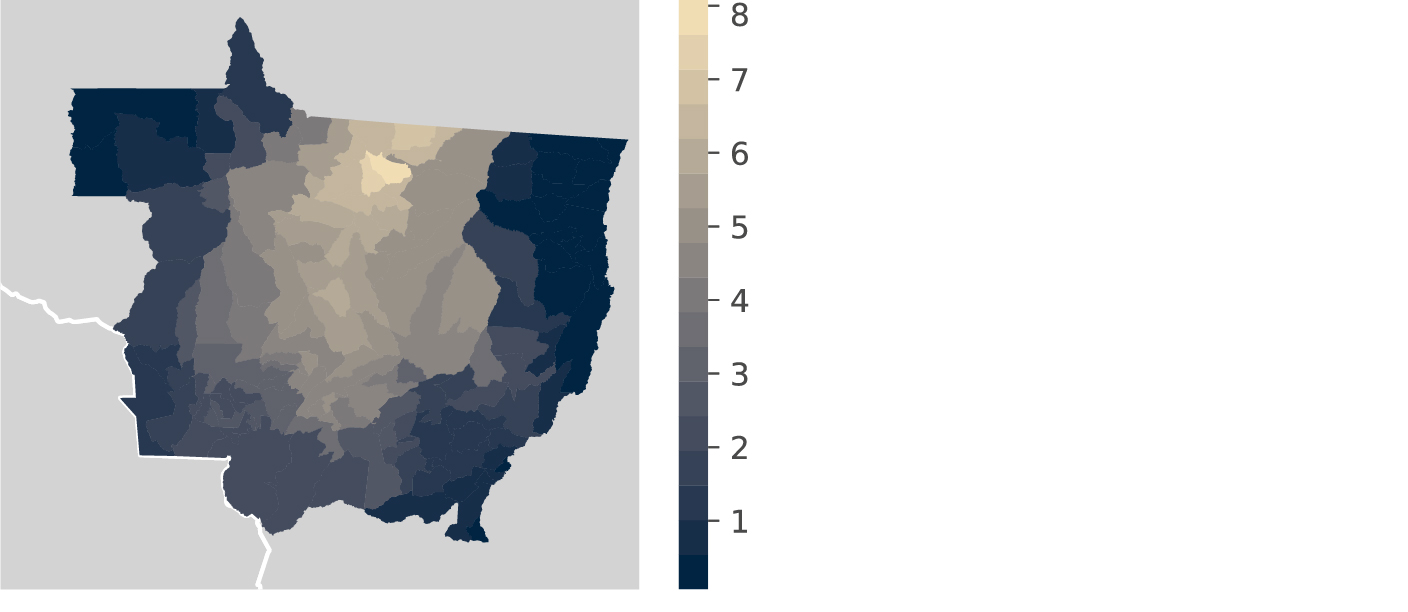
Figure 4 shows the rainfall decrease resulting from the Xingu’s deforestation for wet and dry seasons, as a proportion of the historical average. In the wet season, rainfall level is expected to decline up to 8% of the historical average. The effect is much more pronounced in the dry season, where the level of rainfall can decrease up to 15% of the historical average. The center of the state, where the most productive agricultural producers are, is strongly affected in both seasons. The north of the state, where the Teles Pires hydroelectric power plant is located, is one of the most affected areas in the wet season. However, due to wind patterns, rainfall in the eastern part of the state remains almost unaffected.
Figure 4. Counterfactual Variation in Rainfall due to Xingu’s River Basin Deforestation
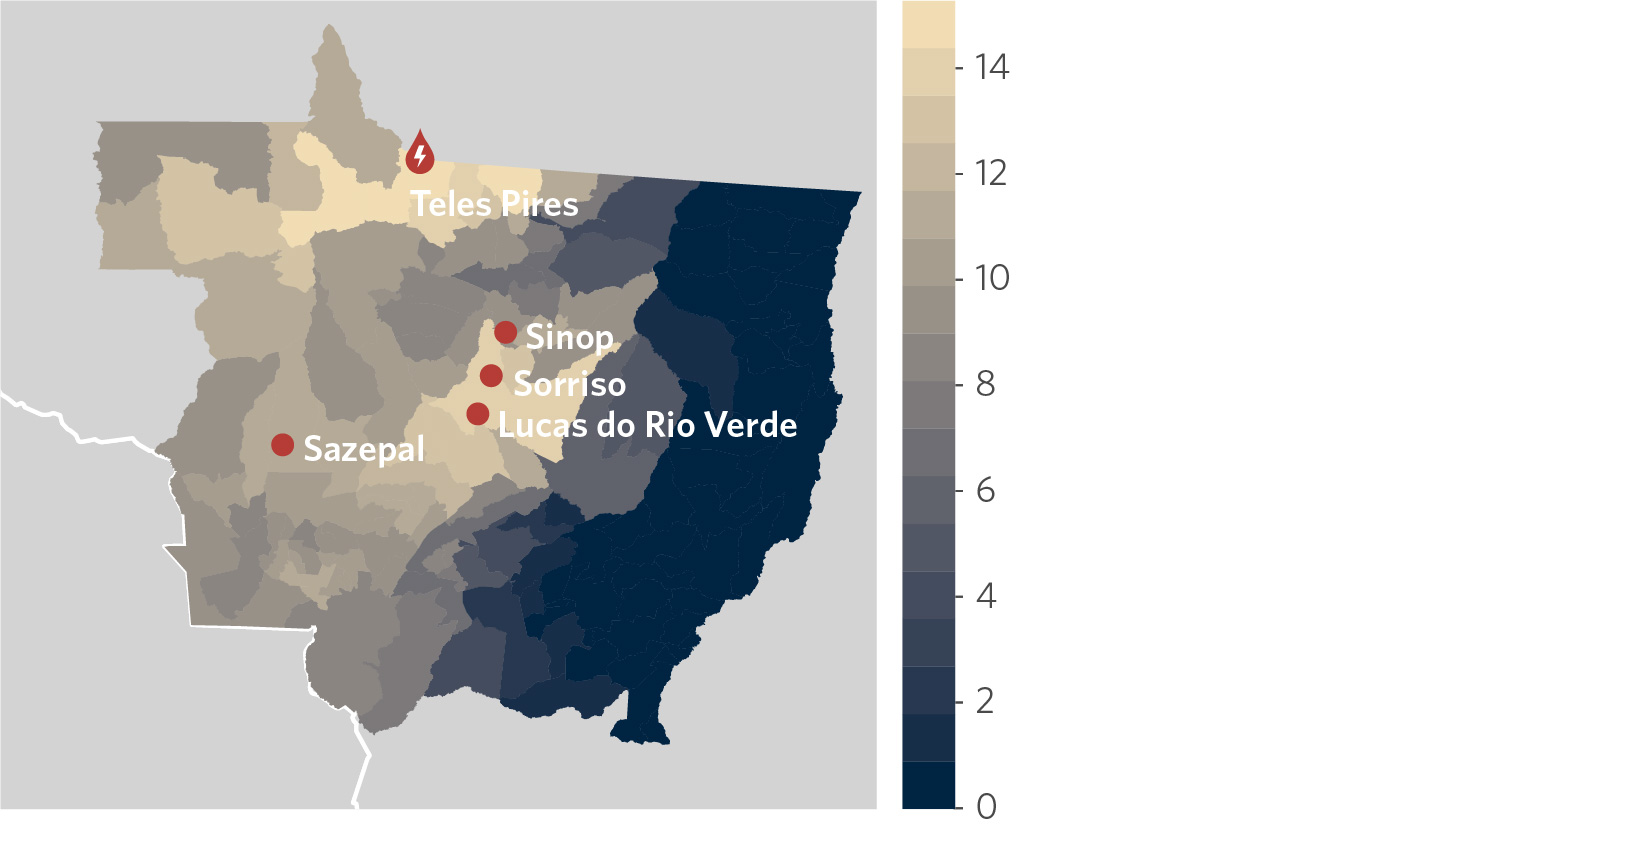
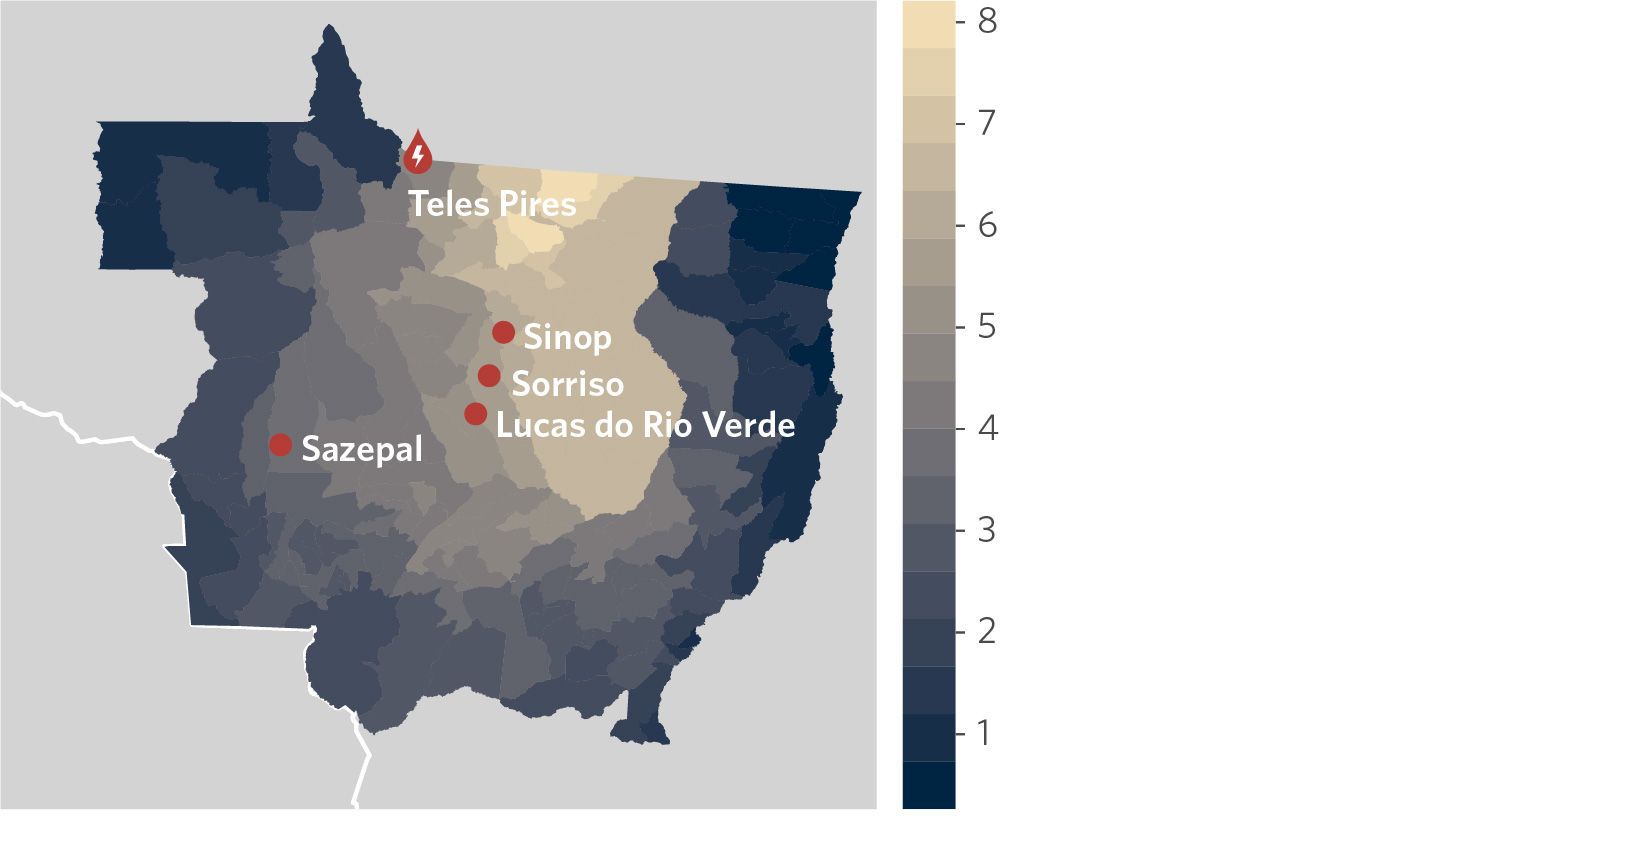
These maps show the impact of the Xingu region deforestation on rainfall, as a proportion of the historical average. Higher values (yellow) mean a higher impact of the deforestation on rainfall. For the dry season (Figure 4a), the Xingu region deforestation may decrease rainfall up to 14% of the historical average. For the wet season, the Xingu region deforestation may decrease rainfall up to 8% of the historical average.
Source: CPI/PUC-Rio with data from ERA5, FUNAI, and MapBiomas, 2021
This exercise highlights a range of important results. First, the results show the significance of protected areas for providing dependability of rainfall and all the economic activities it helps sustain. Second, the impact of deforestation on reducing rainfall is sizeable. An 8% decrease in rainfall levels in the wet season and a 15% decrease in the dry season will affect agricultural productivity, urban water supply, and reservoirs of hydroelectric plants. Third, it is important to note that these effects are not the same throughout Mato Grosso and throughout the year. In general, agriculture, energy, and urban water supply in Mato Grosso benefit from more rainfall but, the month that each sector benefits the most from more rain is different. These variations in effects thus generate substantial differences in exposure to deforestation-induced rainfall changes not only across different regions, but also across different sectors. Potential winners and losers from deforestation are decided by a complex but predictable system of atmospheric transport. For example, the expansion of pastureland into the Xingu’s region can benefit local ranchers, at the expense of decreasing rainfall in the growing season for soybeans producers in the center of the state.
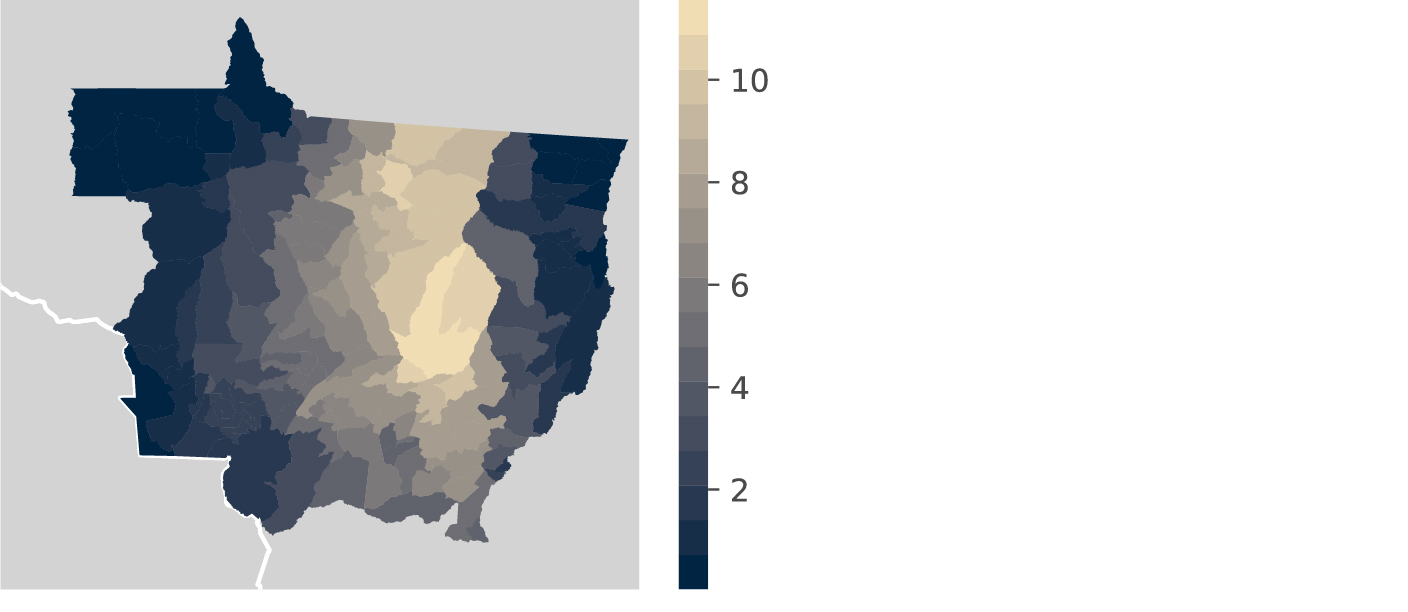
CPI/PUC-Rio also detailed the effect of the Xingu’s region deforestation on precipitation, month by month. In Figure 5, the effect for the months of the wet season is displayed. It is interesting to note that not only does the magnitude of the effects vary across months, but so does the spatial distribution. Across the wet season the biggest effects move from west to east, as the wind patterns change. Figure 6 shows a different pattern for the dry season, with the center of the state being the most affected throughout the months. This is important because sectors benefit differently from more rainfall in each month. For example, soybean producers benefit most from rain in the growing season (October to December), while a run-of-the-river dam has the greatest benefits from rain in the seasonal peak demand for energy (February to March).
Figure 5. Counterfactual Variation in Rainfall due to Xingu River Basin Deforestation Month by Month in the Wet Season
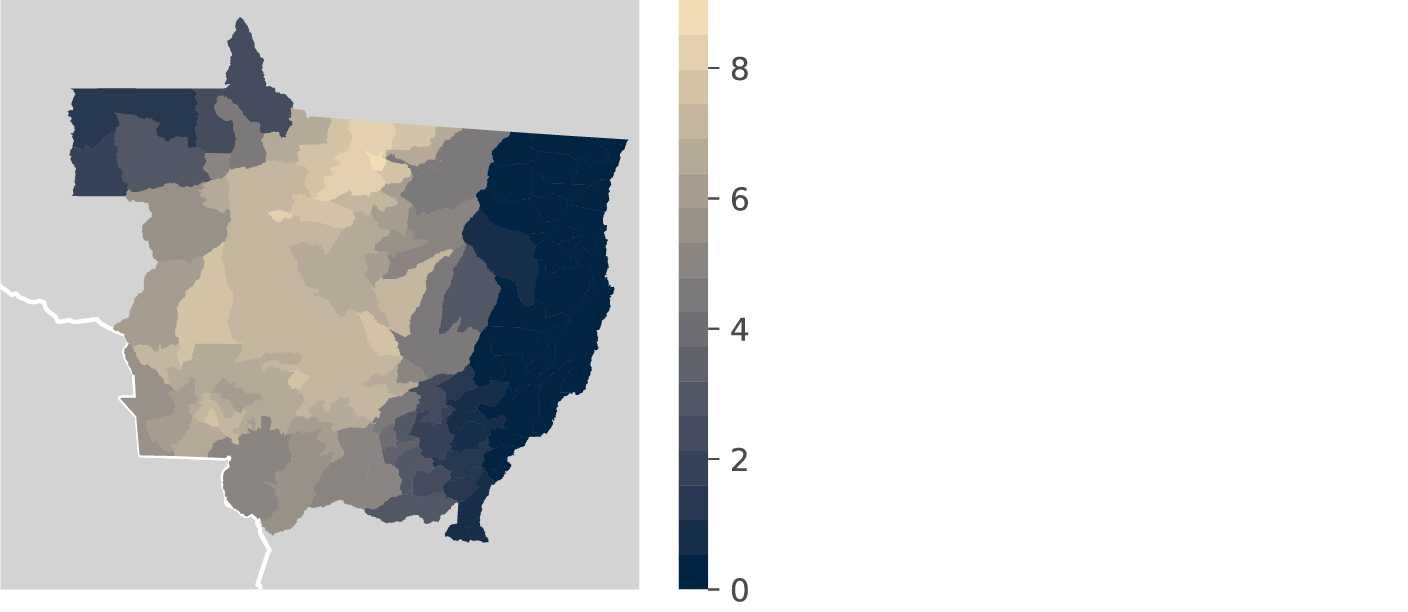
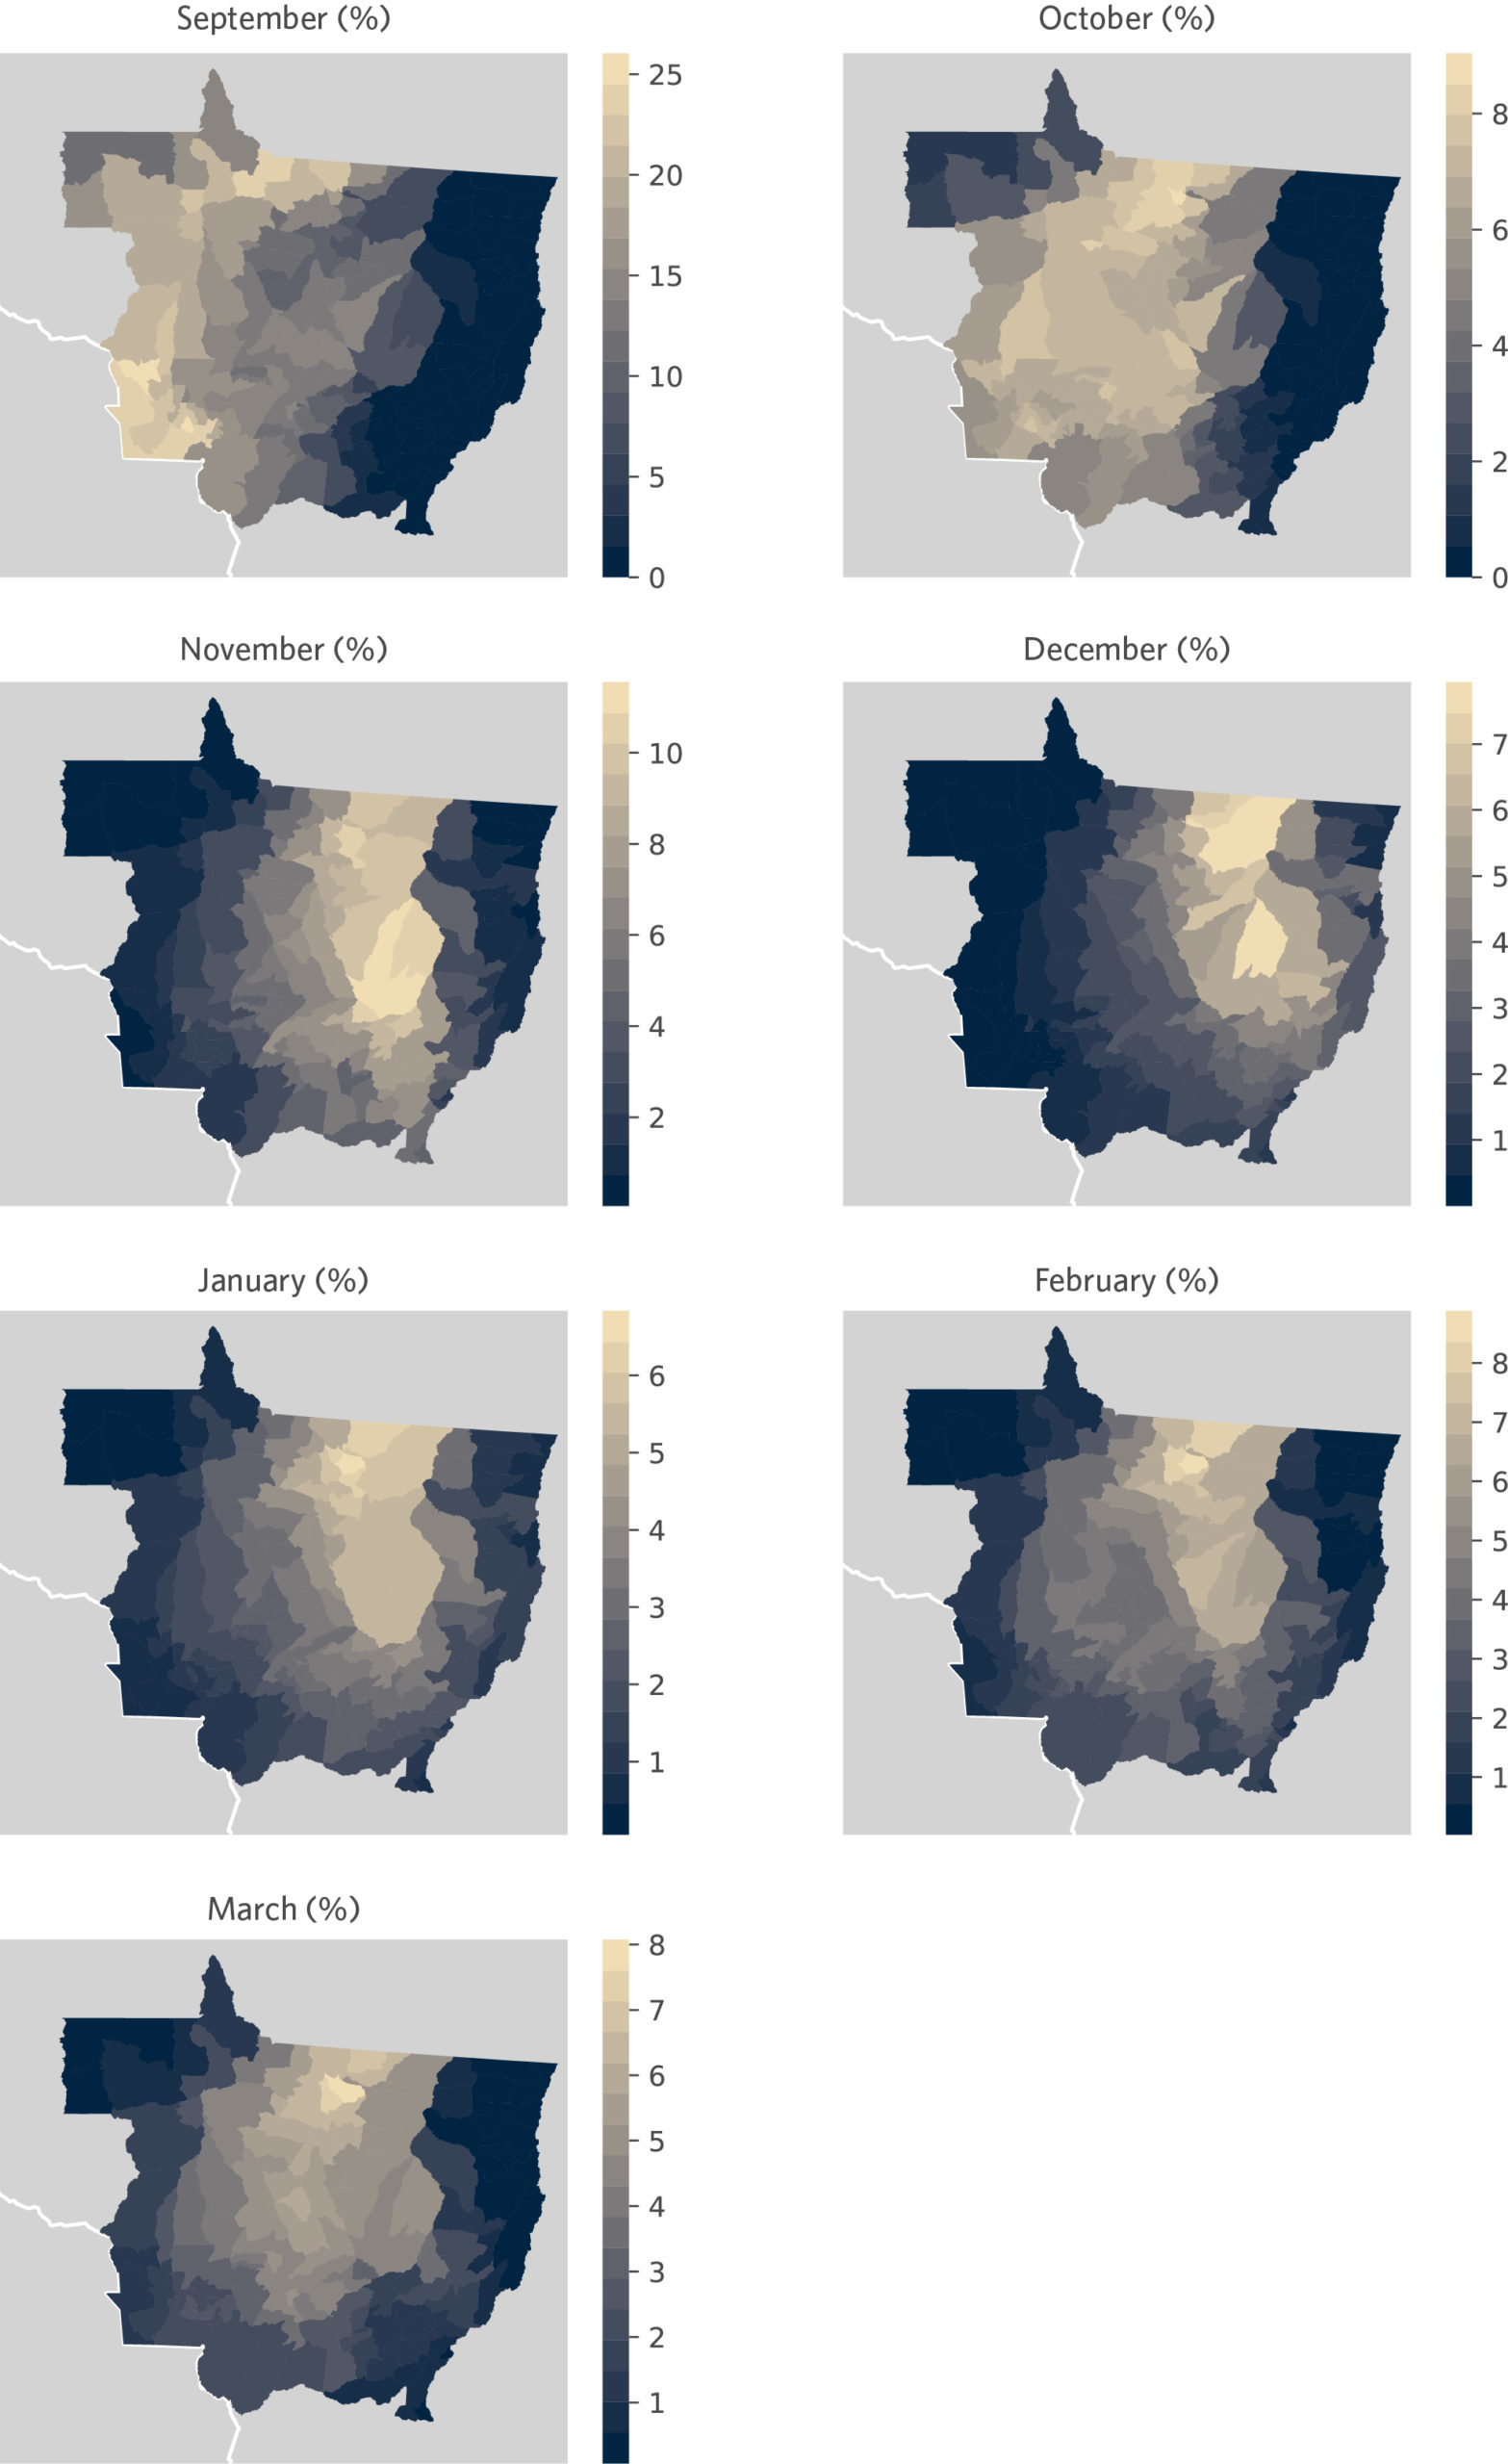
These maps show the impact of the Xingu region deforestation on rainfall for the wet season, as a proportion of the historical average. Higher values (yellow) mean a higher impact of the deforestation on rainfall. Each map shows the deforestation effect on rainfall for that month. For example, the Xingu Region deforestation may decrease rainfall in December up to 7% of the historical average of that month.
Source: CPI/PUC-Rio with data from ERA5, FUNAI, and MapBiomas, 2021
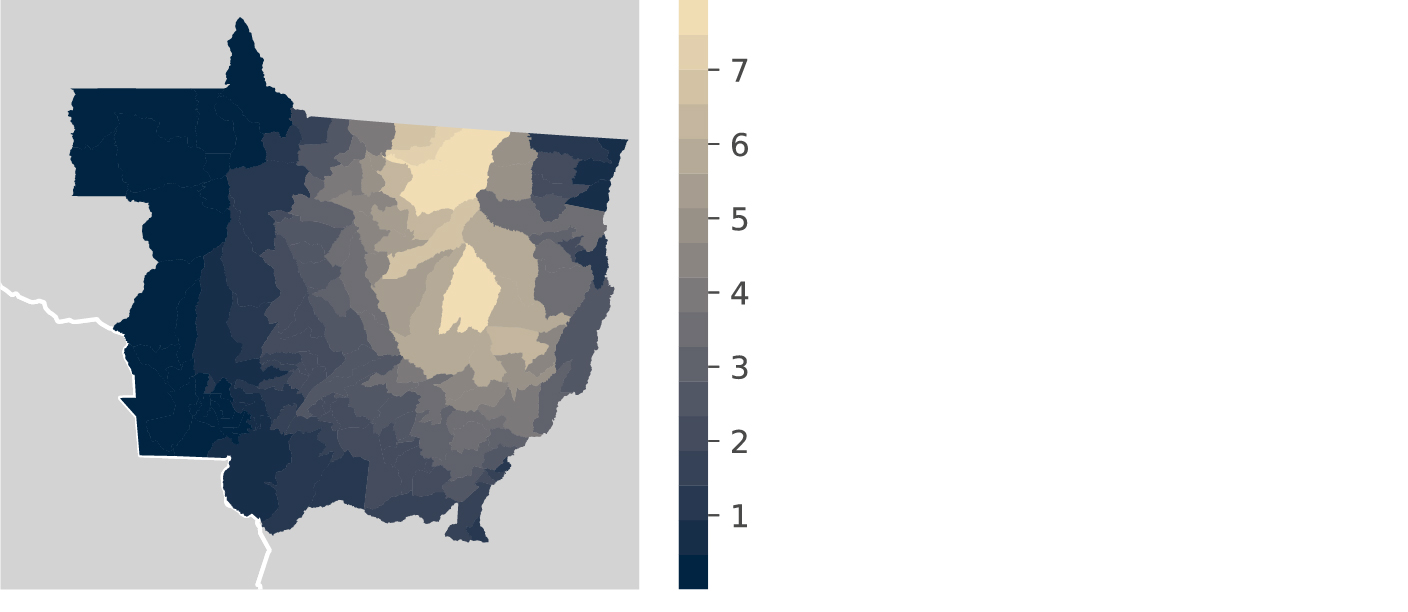
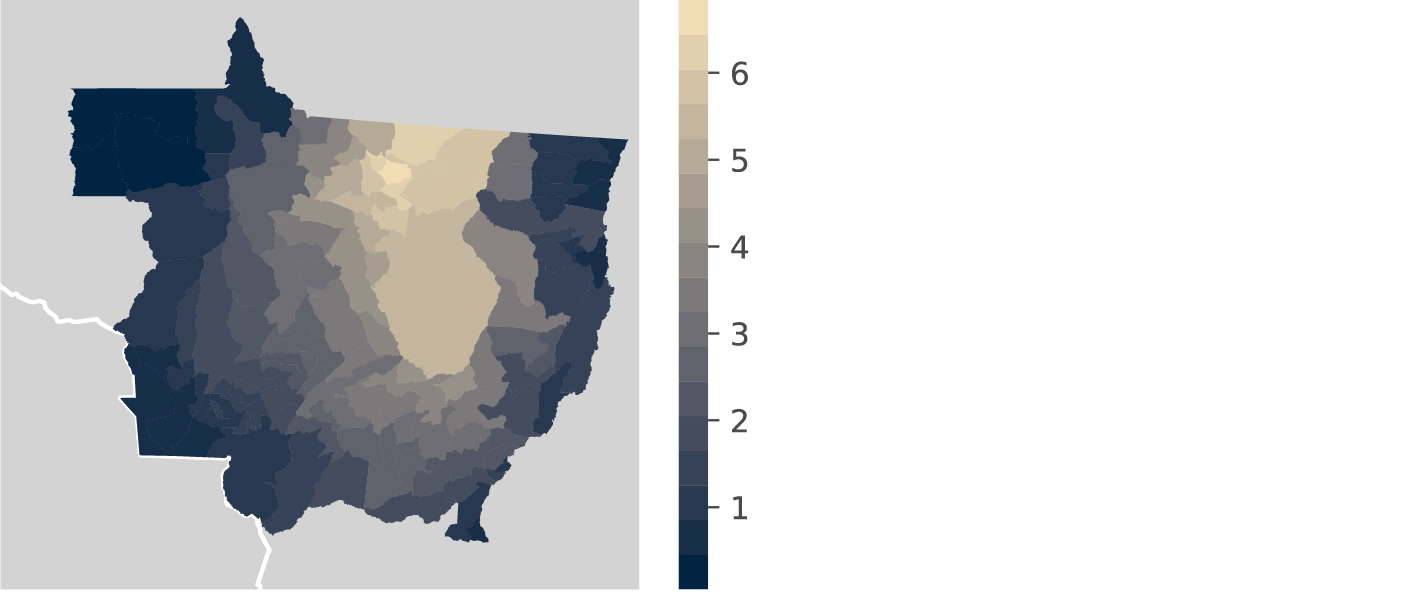
Figure 6. Counterfactual Variation in Rainfall due to Xingu’s River Basin Deforestation Month by Month in the Dry Season
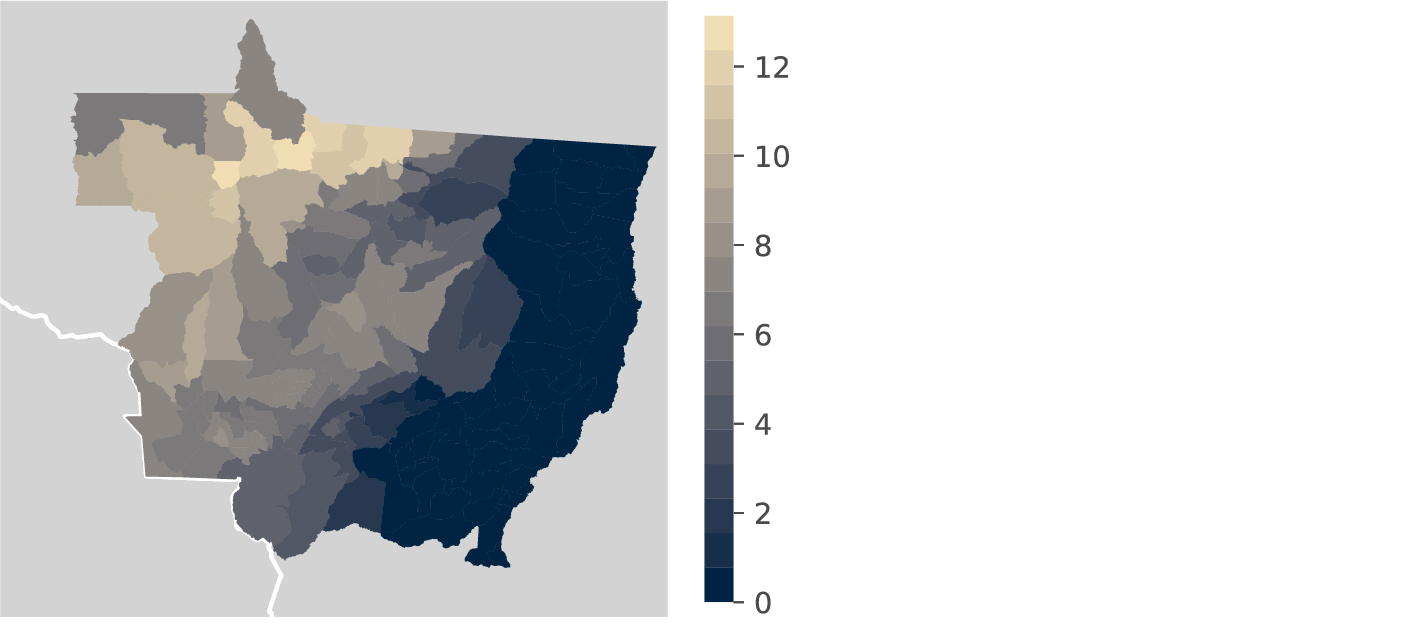
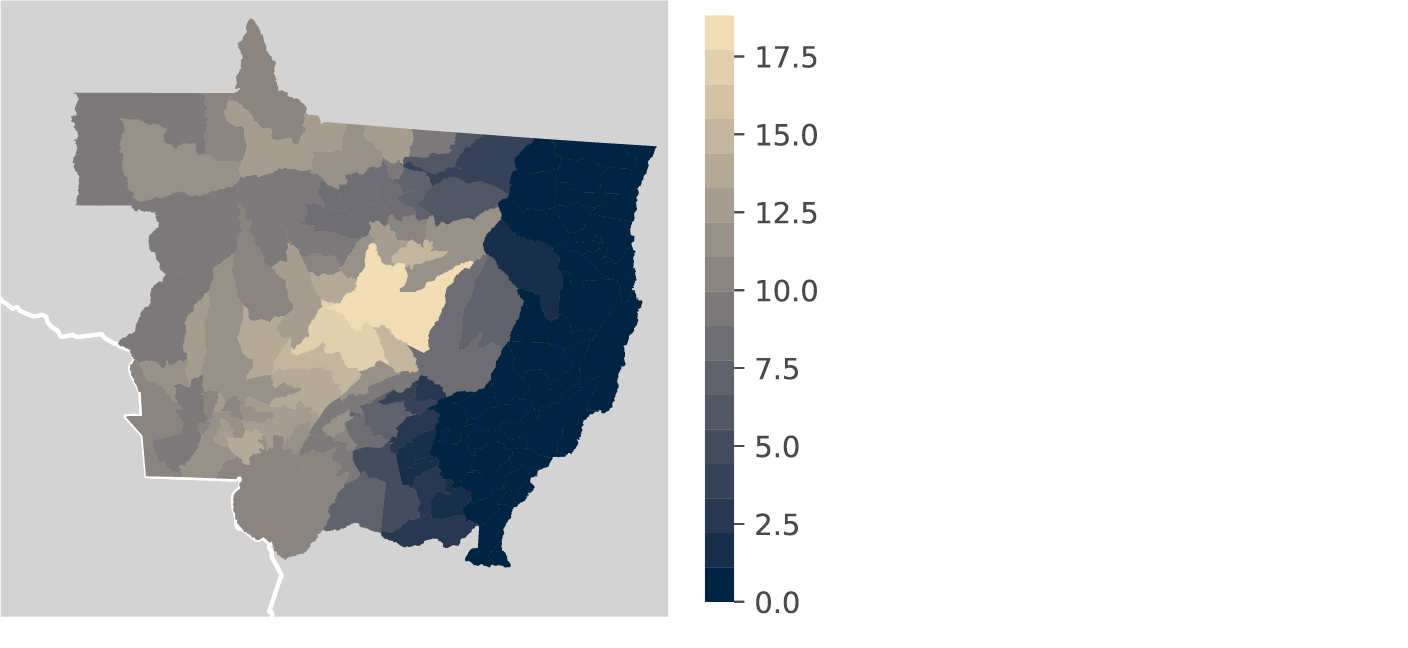
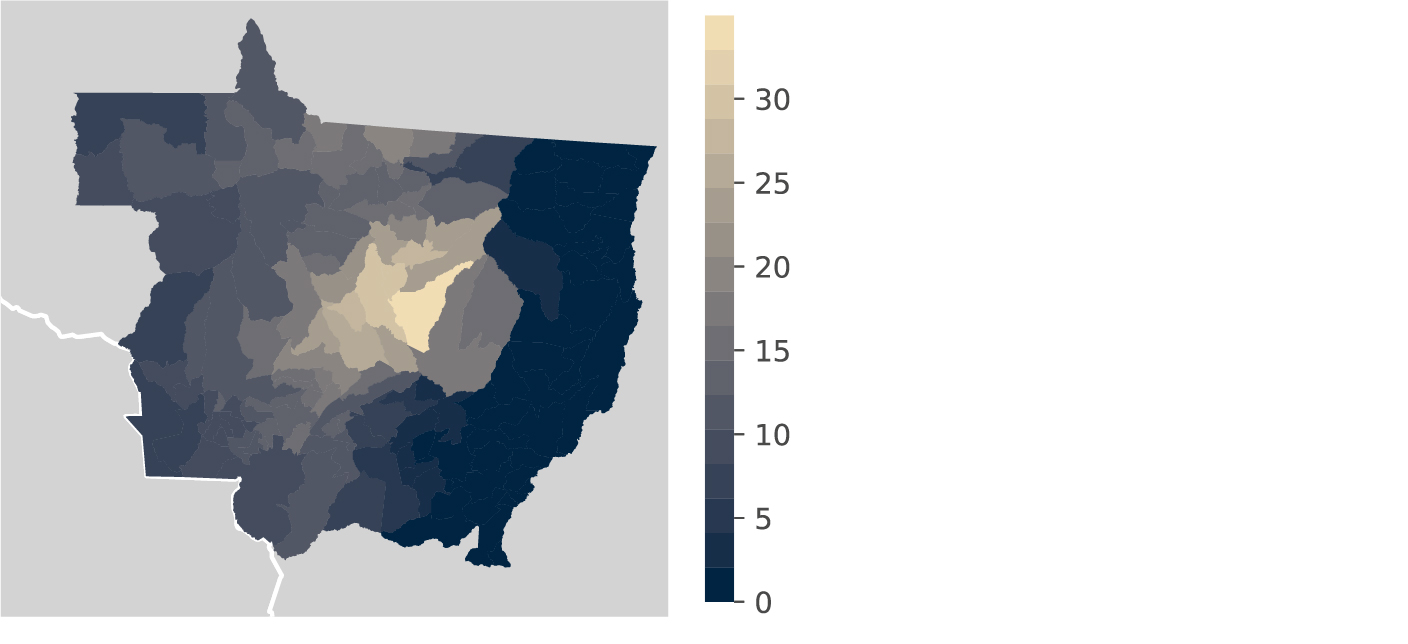

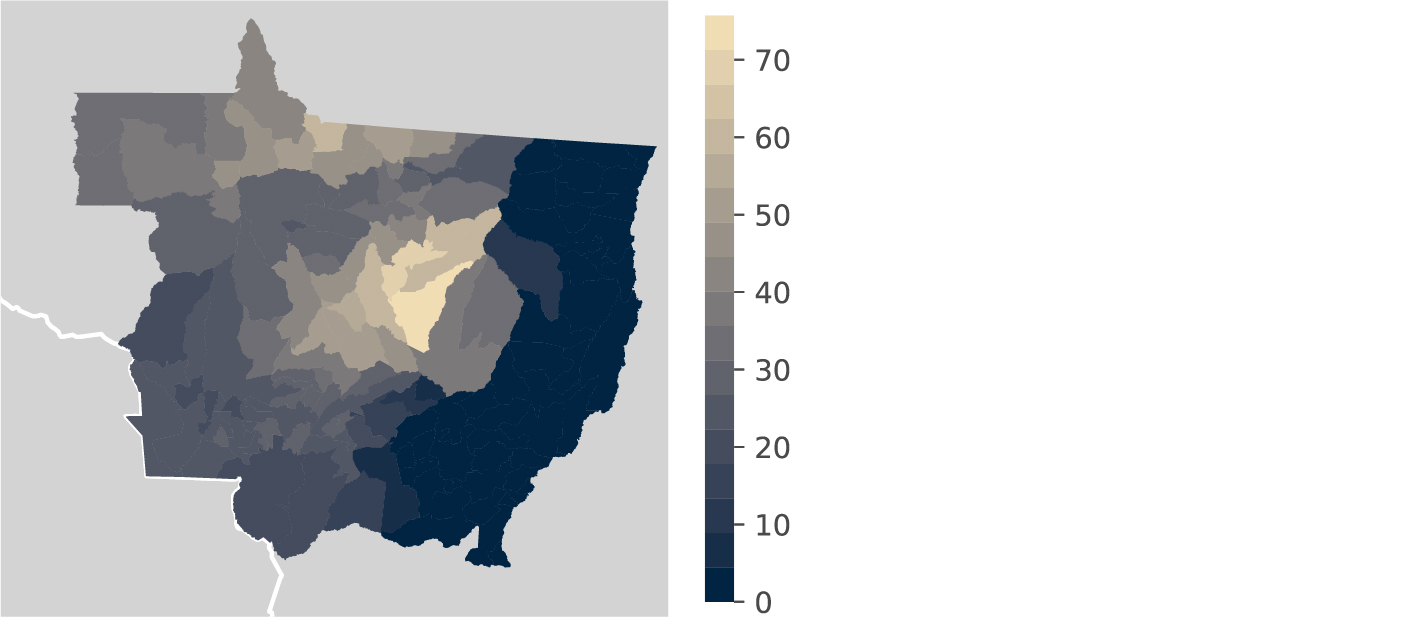
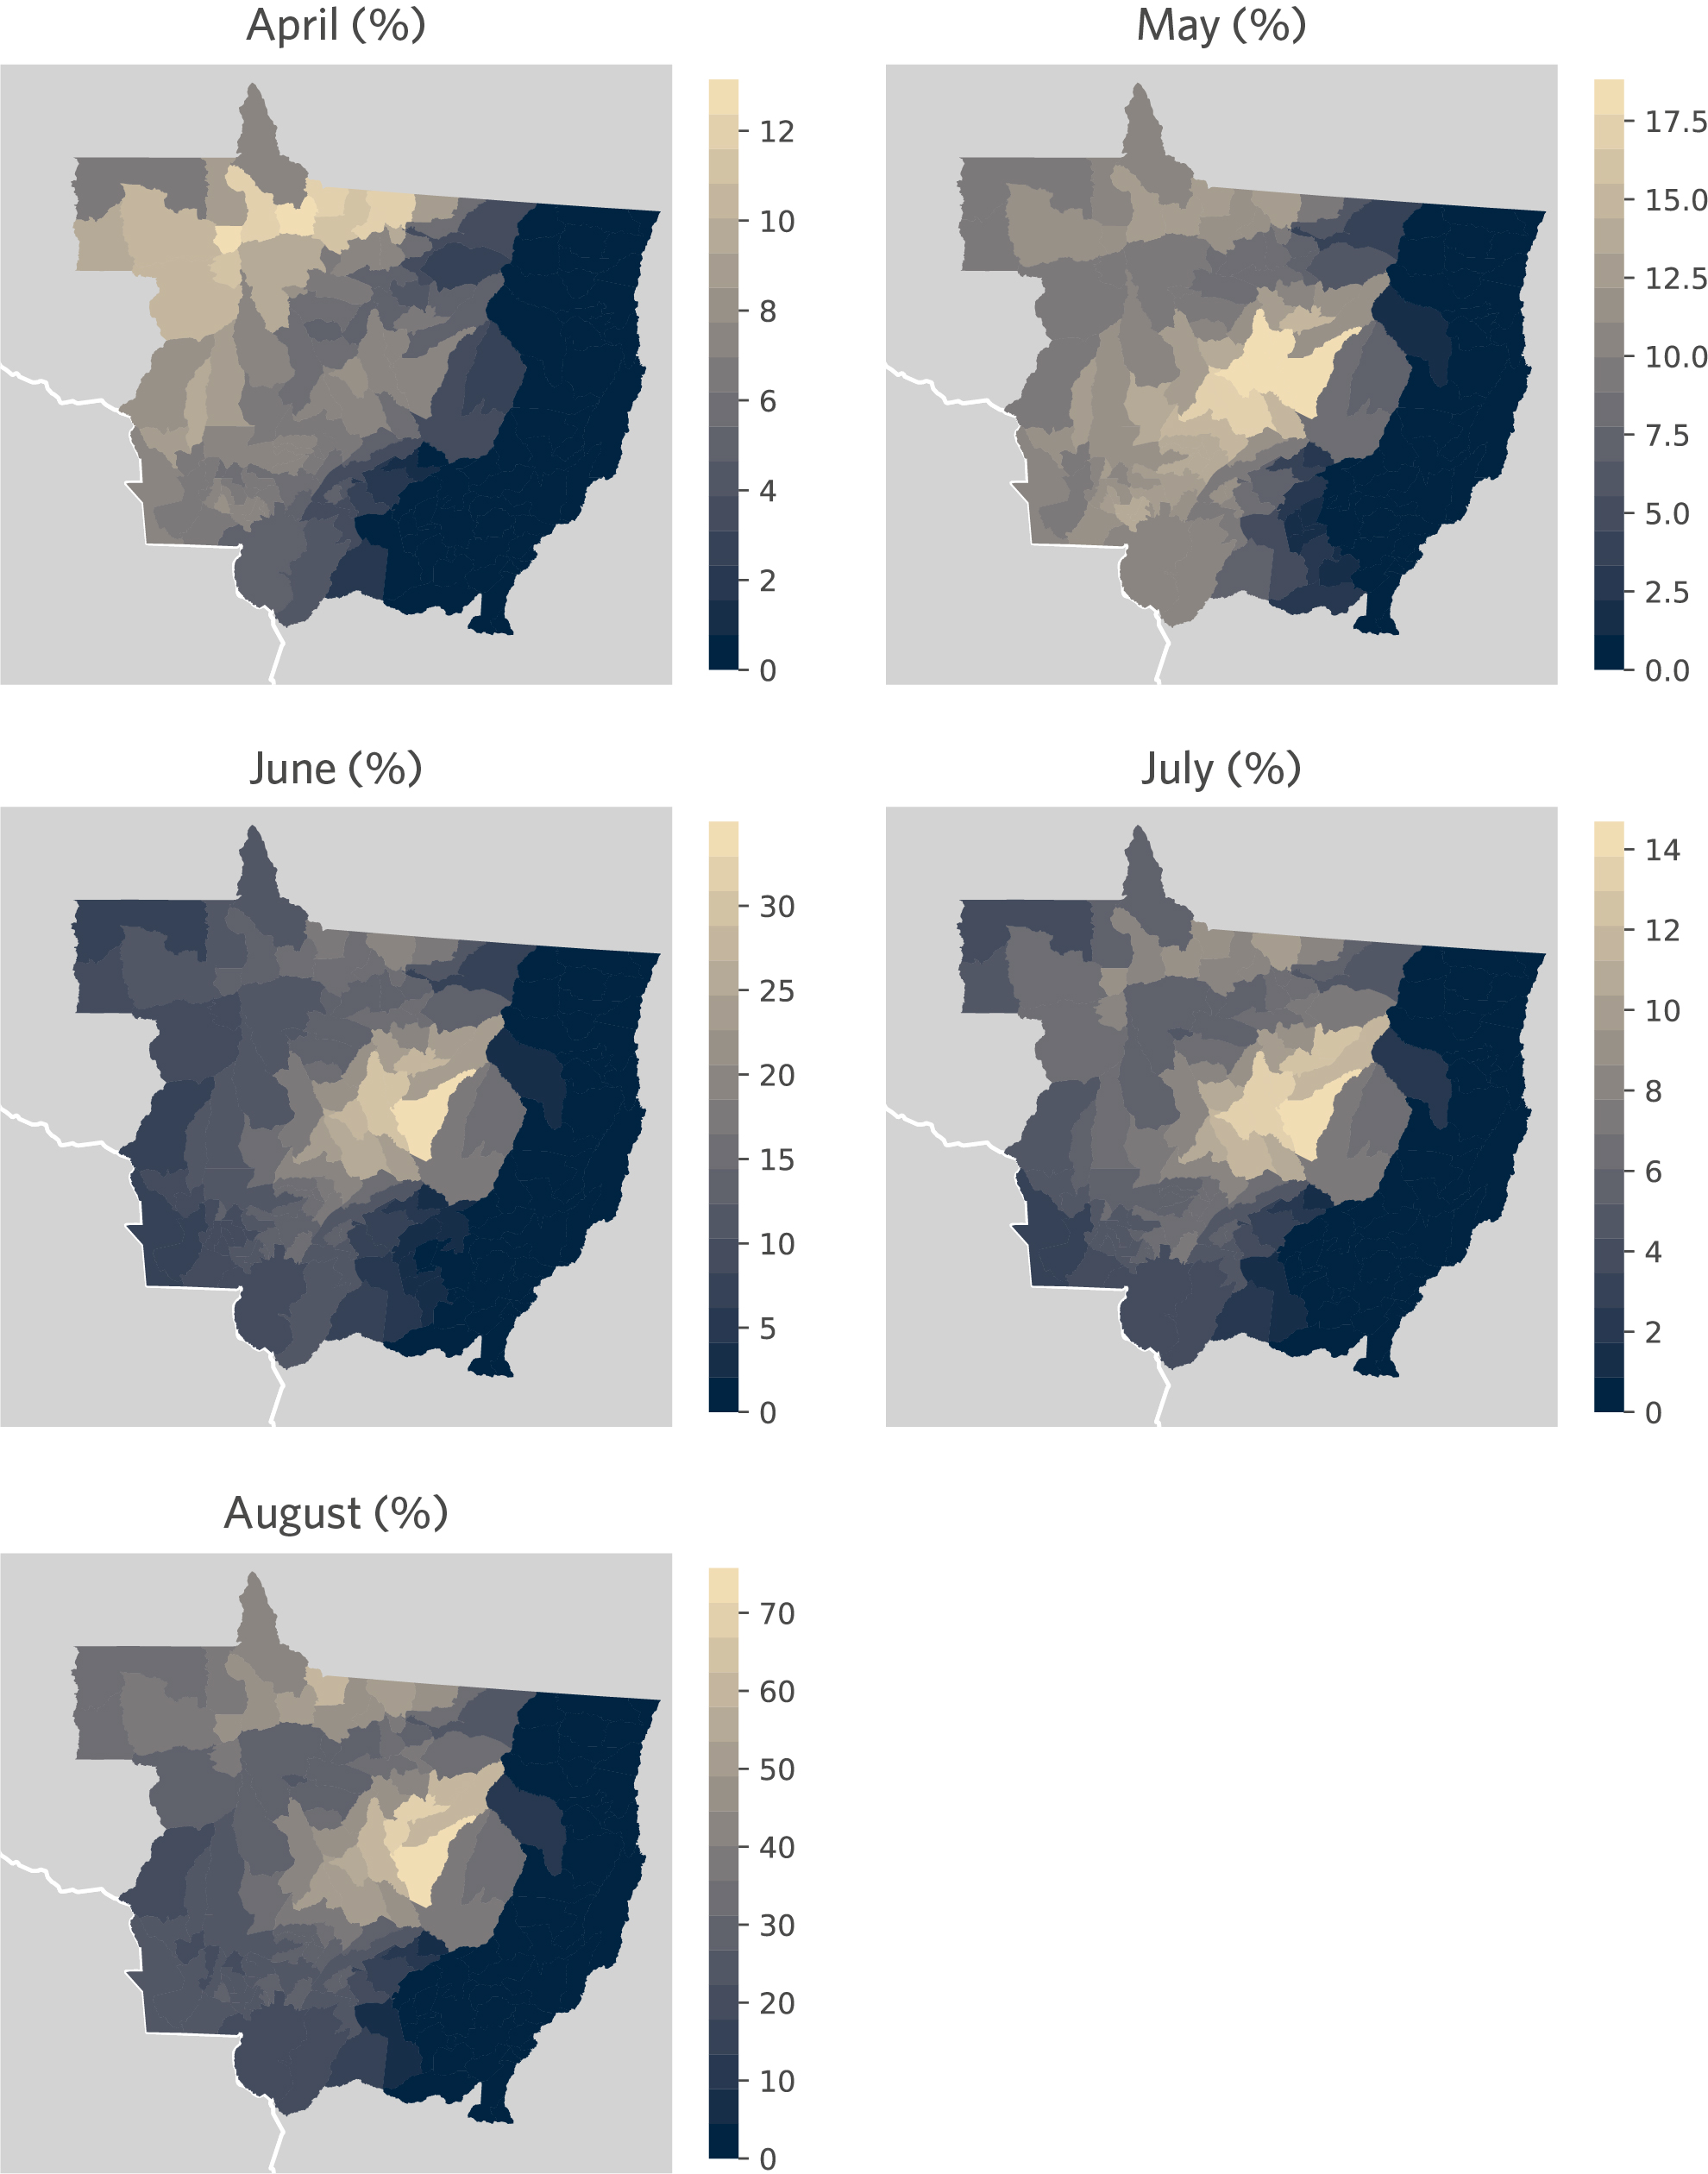
These maps show the impact of the Xingu region deforestation on rainfall for the dry season, as a proportion of the historical average. Higher values (yellow) mean a higher impact of the deforestation on rainfall. Each map shows the deforestation effect on rainfall for that month. For example, the Xingu Region deforestation may decrease rainfall in April up to 12% of the historical average of that month.
Source: CPI/PUC-Rio with data from ERA5, FUNAI and MapBiomas, 2021
Finally, it is important to acknowledge that every study has its caveats. This study does not compound the synergies of climate change and other regions’ deforestation to the effect of the Xingu’s deforestation. Also, hydrological effects of deforestation on Xingu River itself are not considered, even though they are likely to further contribute to the decrease of precipitation and water supply in general. Taken together, this counterfactual exercise offers a lower bound effect of deforestation on rainfall.
Conclusion
Tropical forests provide a range of ecological services that are crucial to socioeconomical activities. This study by CPI/PUC-Rio provides a framework to analyze the effects of deforestation on the rainfall of regions located hundreds or thousands of kilometers away from the deforestation. This tool can give power to local governments and local populations to advocate for stronger conservation efforts in specific policies that are known to generate deforestation. The tool can also be adapted to other regions, both in Brazil and across South America.
The deforestation of the Xingu River Basin is a case that illustrates the broad range of stakeholders who would be impacted by failing to protect the region and the subsequent widespread variation in rainfall and droughts that would occur. Identifying and quantifying the gains and losses associated with deforestation is a necessary step to increase transparency and accountability of public policies in the Amazon Forest.
Methodology: A climate model to measure the Relationship between Deforestation and Rainfall
The same way that one can follow a river upstream to find its source, one can follow the wind direction to find its path from the ocean. This path is called a back trajectory of atmospheric transport. Atmospheric transport models reconstruct the back trajectory of an air parcel that is over a location at the given moment of rainfall. The author used averaged monthly wind speed and direction from ERA5 to build back trajectories for every month from 1985 to 2020.
Figure 7 shows a set of five-day back trajectories from the state of Mato Grosso for two different selected months from 2002 to illustrate what the back trajectories look like. They identify a distinctive pattern across months in the year, with the rainy season receiving winds from the Amazon (north to south) while the dry season receives winds from outside the Amazon (east to west). Each blue line represents a wind trajectory ending in a point in Mato Grosso, with the wind covering different types of terrain. The main explanatory variable of the model is a count of how many pixels (locations) with forest cover the wind has covered. The higher this variable is, the more likely it is that the air parcel can maintain and increase its humidity.
Figure 7. Back Trajectories of Atmospheric Transport, 2002
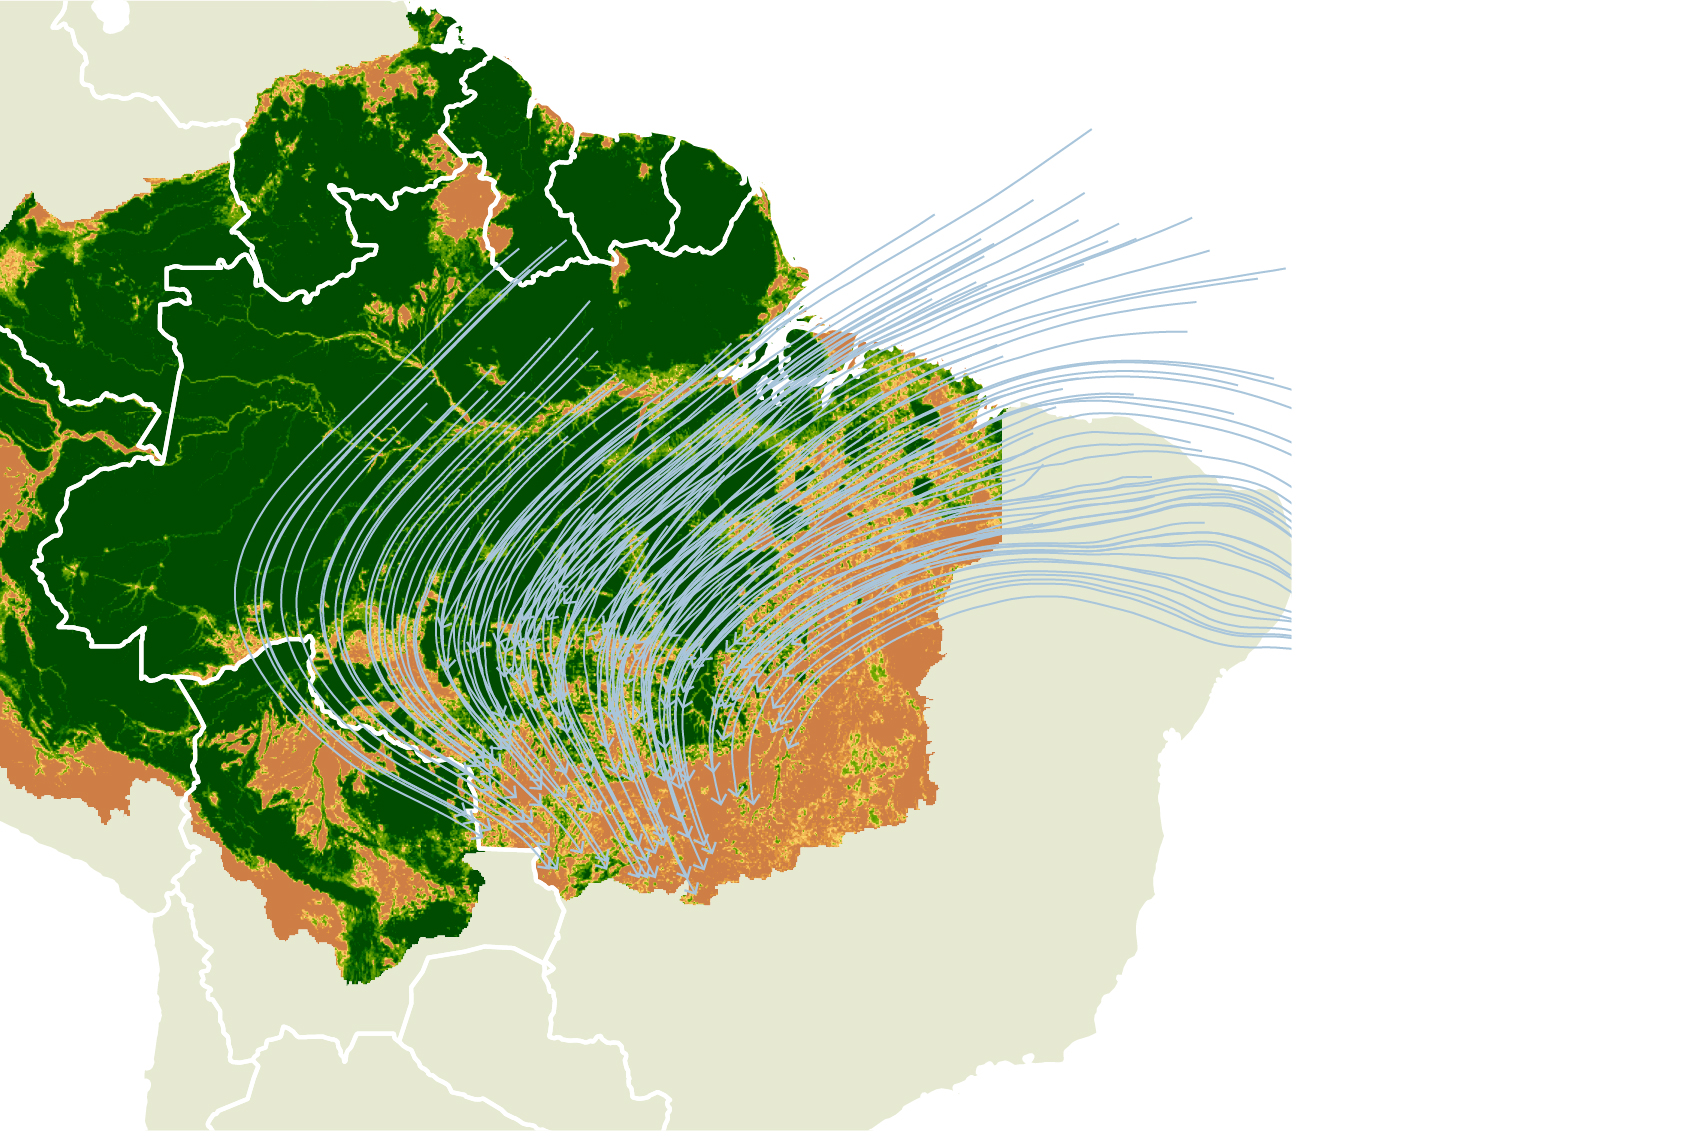
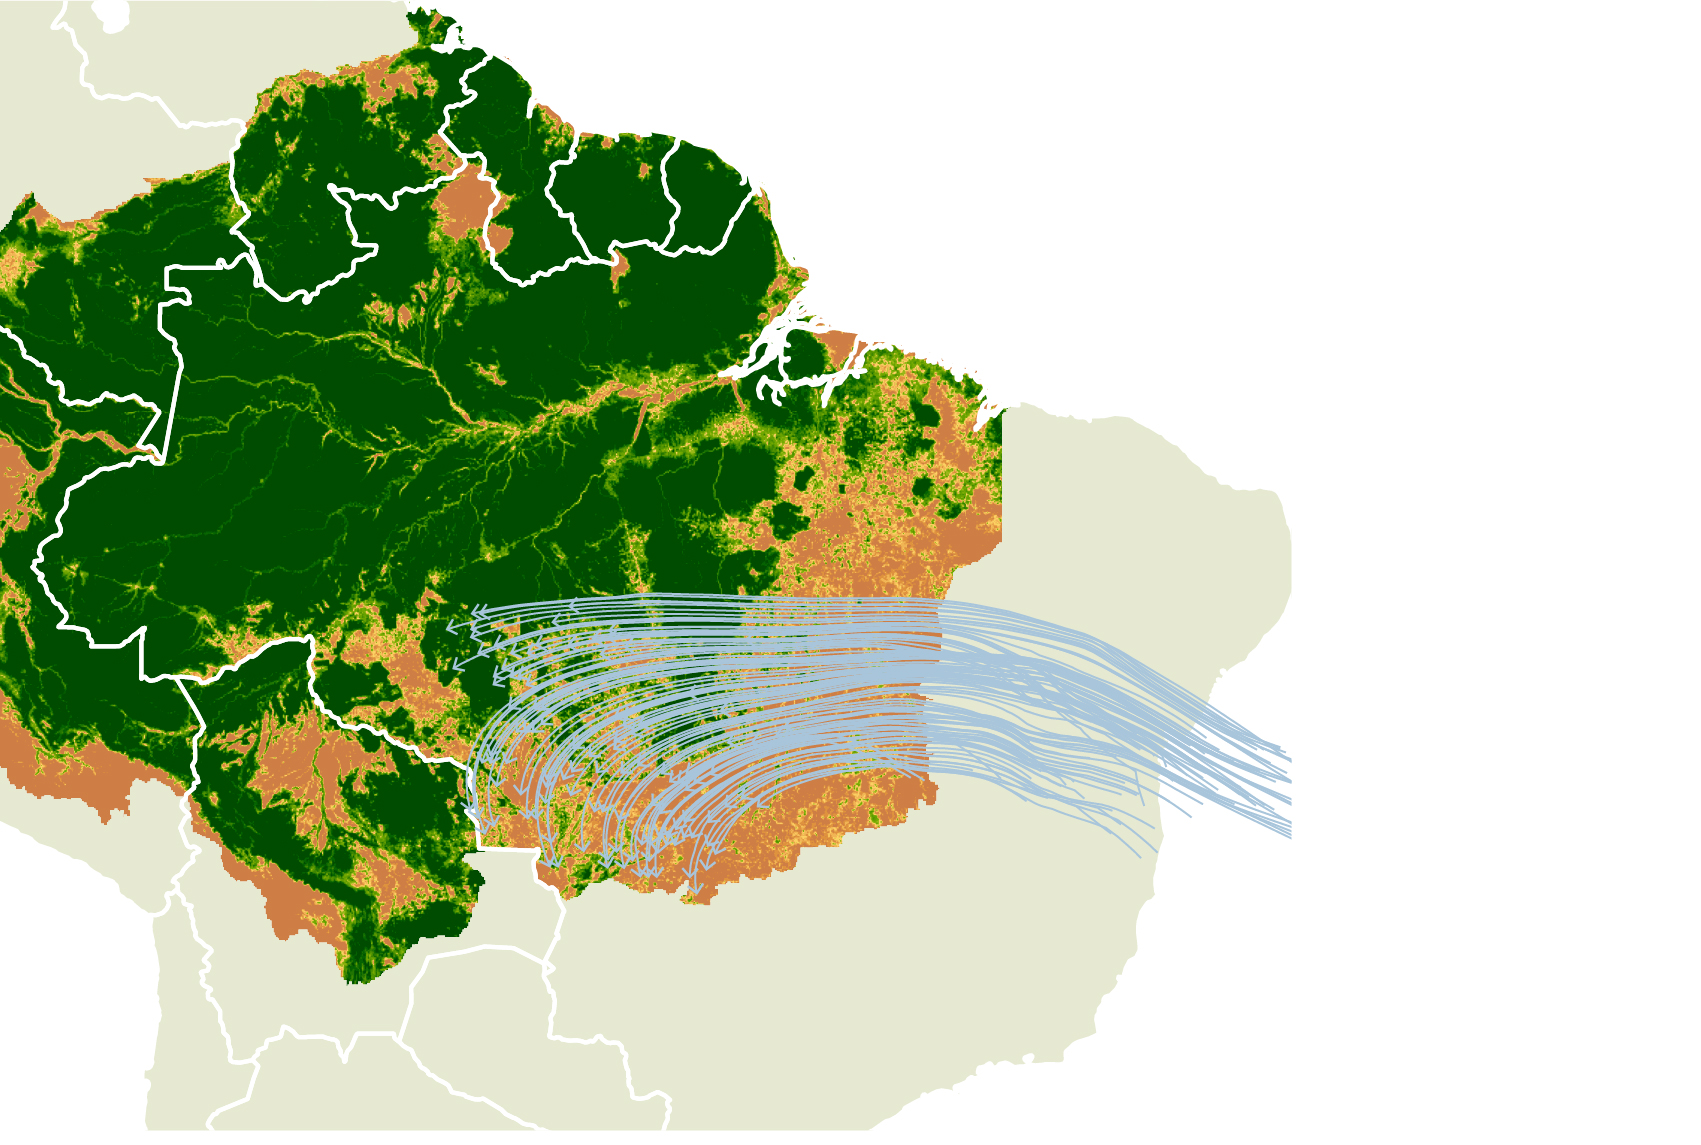

These maps illustrate the back trajectories of atmospheric transport for two specific months (February 2002 and July 2002). A blue line represents the trajectory of the wind from the ocean to a location in the state of Mato Grosso. Note that the trajectories directions are very distinctive for the two months. This is a general pattern, with the wet season being characterized by trajectories moving north to south, and the dry season by trajectories from east to west.
Source: CPI/PUC-Rio with data from ERA5, 2021
In addition to the natural variability of the count of forest pixels across months in a year, the average count along the years has seen a steady decline, due to deforestation, as shown in Figure 8a, where the deviations from the average count of forest pixel per year is shown for each municipality of the state of Mato Grosso. This steady decline results in a drop of average rainfall, year after year.
To count forest pixels across paths, CPI/PUC-Rio uses data from the Pan-Amazon MapBiomas from 1985 to 2018. This data classifies land use for the entire Amazon territory using satellite data. Originally in 30 meters resolution, the data are converted to 0.25 degrees, where each pixel stores the proportion of 30 meters pixels classified as forest.
To formally estimate the effect of forest count on rainfall, a fixed effects estimator is employed, as described in Equation 1:
𝒓𝒍𝒎𝒚= 𝛼 + 𝜷𝒎𝒄𝒍𝒎𝒚 + 𝛄𝒍𝒎 + 𝛄𝒚 + 𝛄𝜲𝒍𝒎𝒚 + 𝝐𝒍𝒎𝒚
The parameters of interest are 𝜷𝒎, which give the effect of forest count (𝒄𝒍𝒎𝒚) on rainfall (𝒓𝒍𝒎𝒚) for each month of the year. Additional variables, such as total distance traveled (𝜲𝒍𝒎𝒚) and fixed effects of location-month and year (𝛄𝒍𝒎,𝛄𝒚) control for a range of potential confounding variables that could offer alternatives explanations for the observed relationship between rainfall and forest count. The main result of this regression is shown in Figure 8b. Each coefficient 𝜷𝒎 shows the effect of an increase of one standard deviation in the forest count variable on rainfall, measured as mm equivalent per day. The standard errors show that, given the model, the uncertainty around the effect is low.
Figure 8. Forest Count and Precipitation, 1985 – 2015
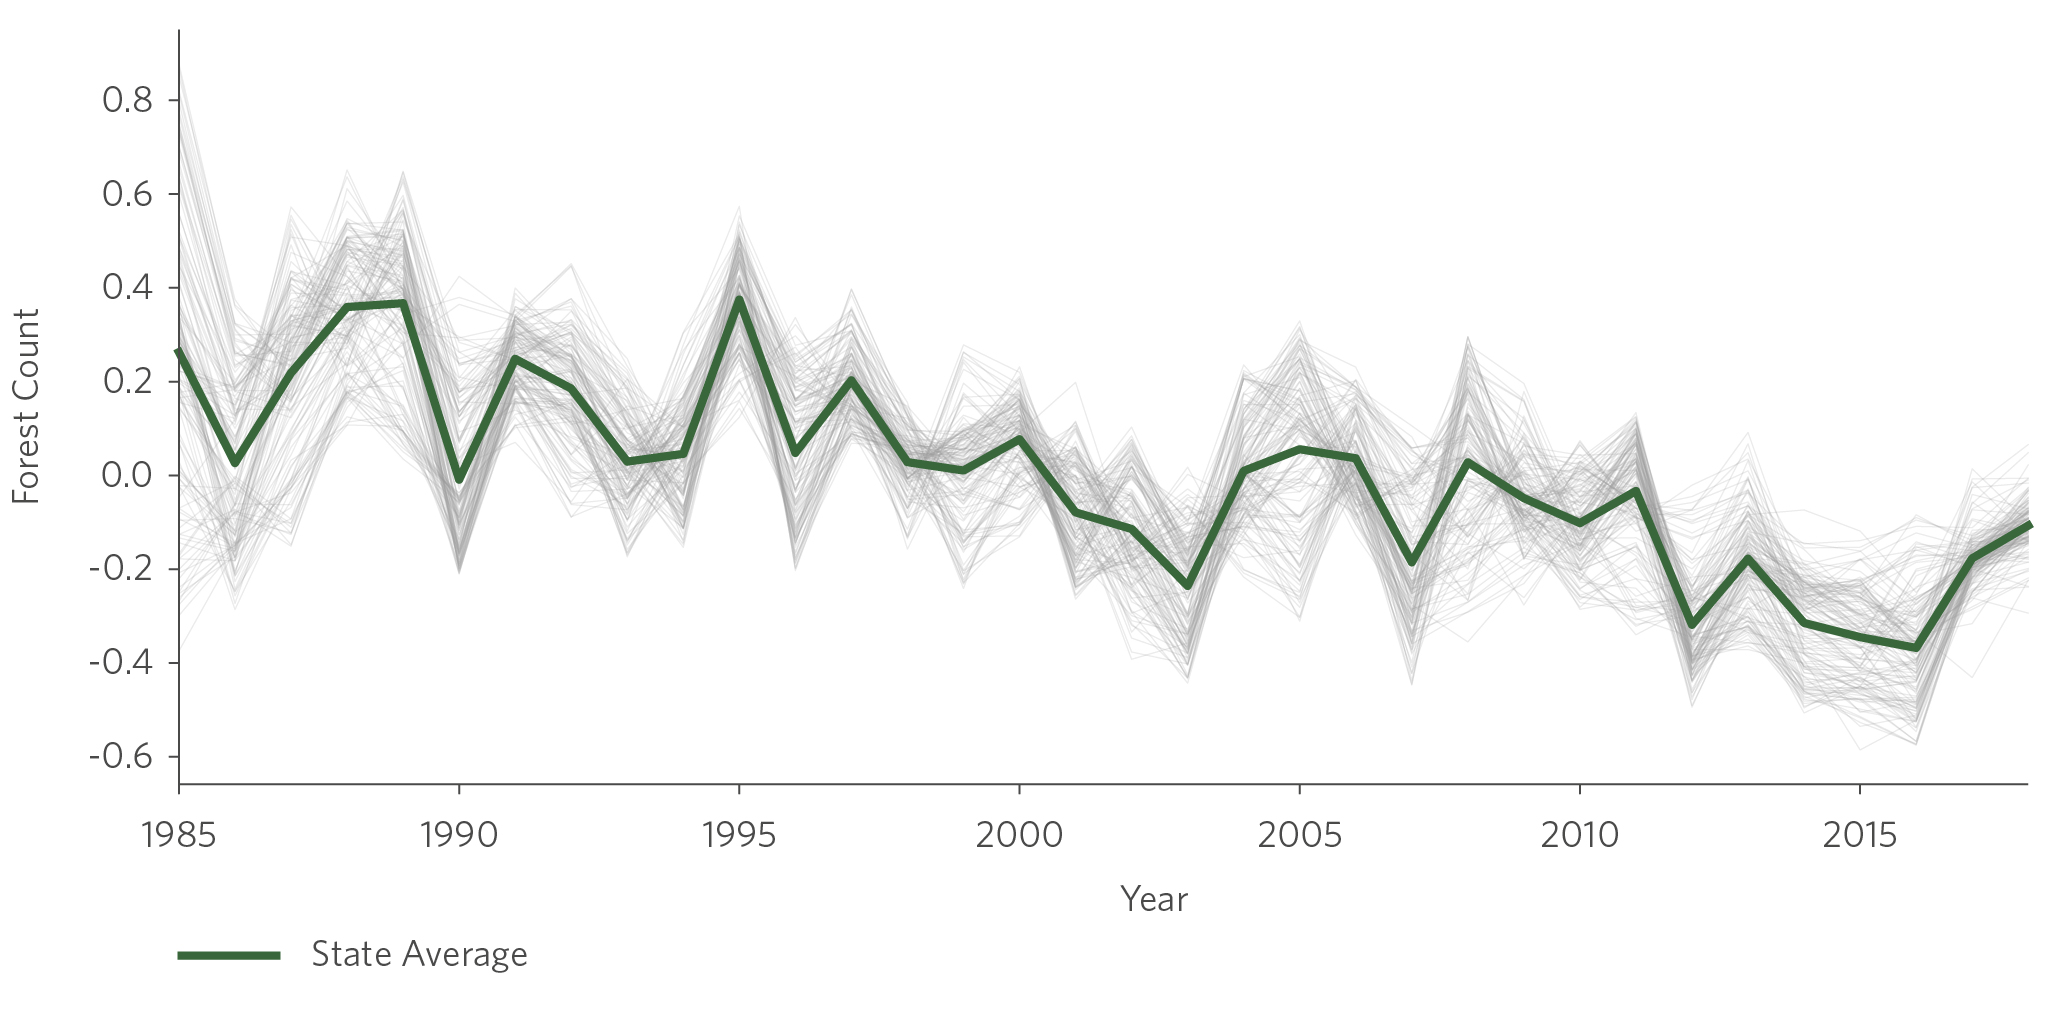
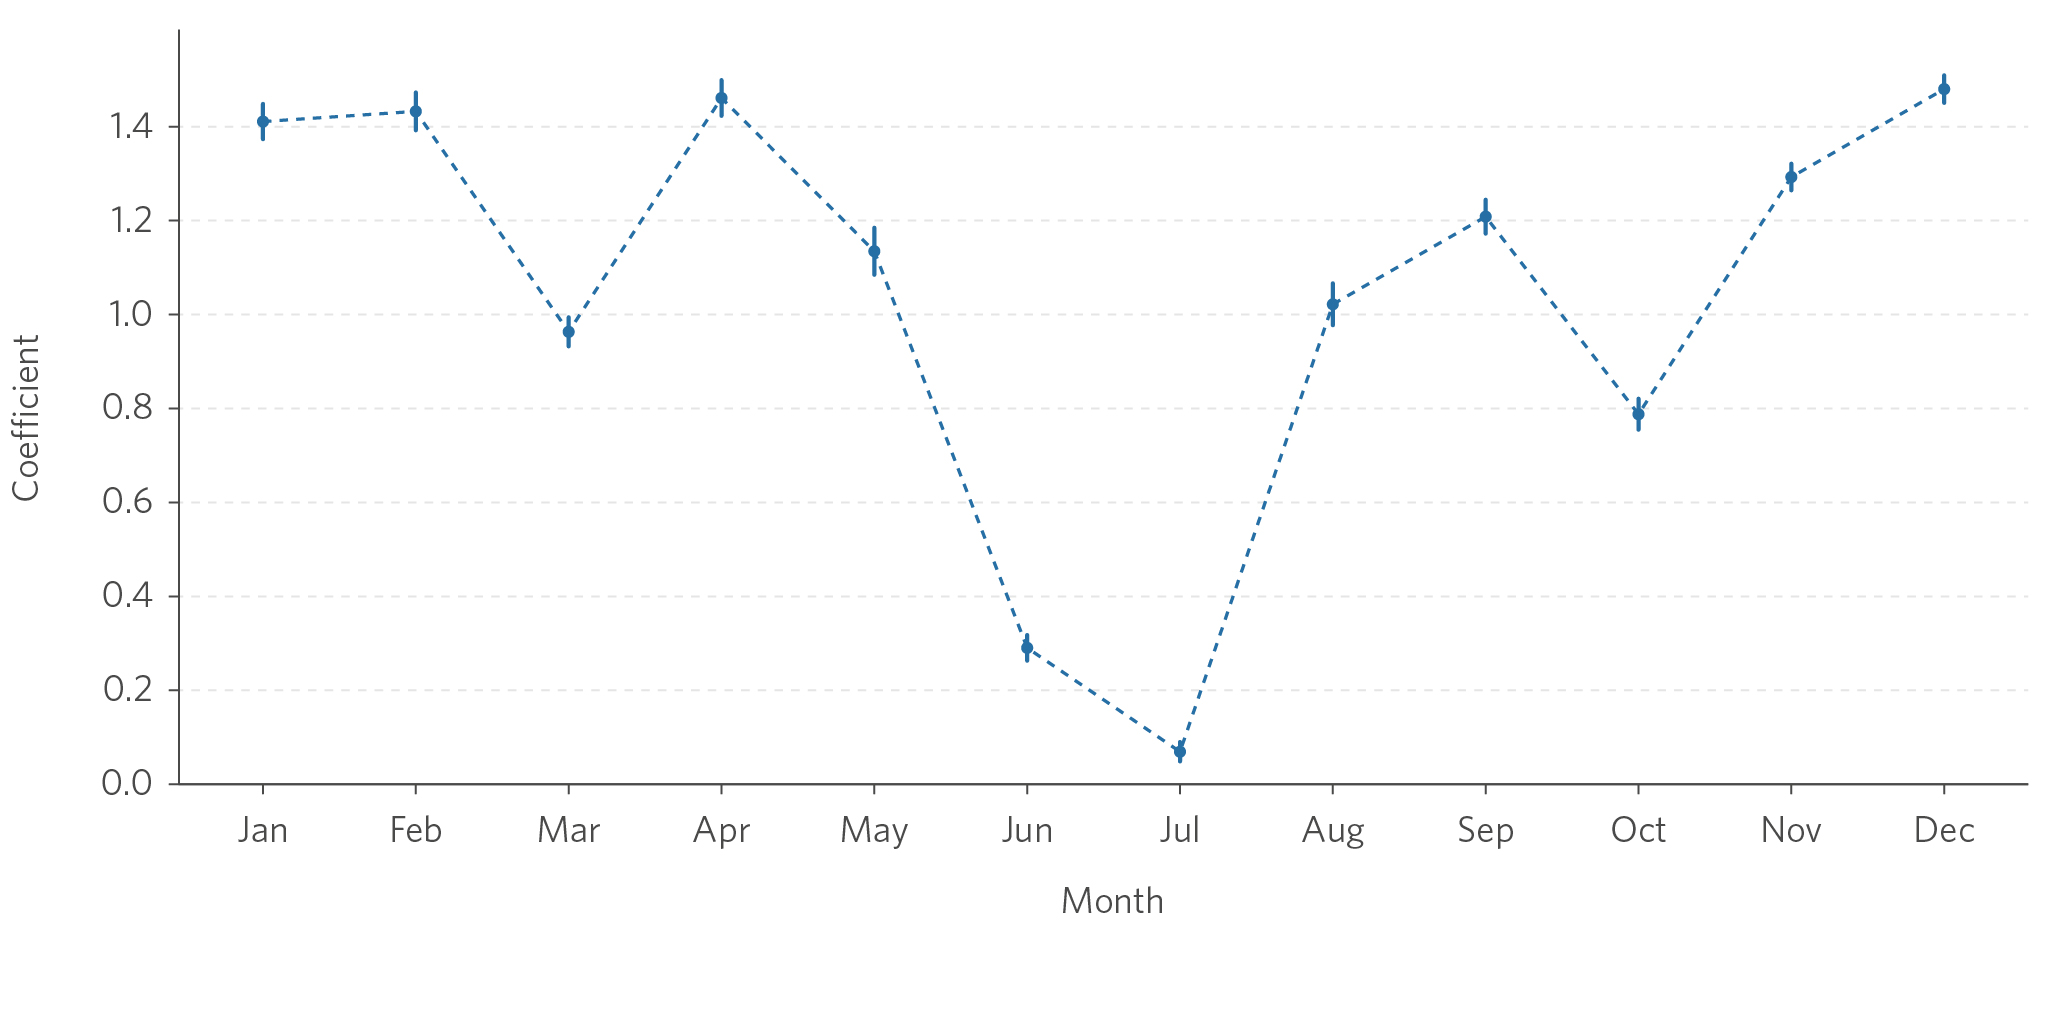
Figure 8a shows evolution of the forest count variable (as deviations from the mean) throughout the years for each municipality of the state of Mato Grosso. Values below zero mean that the forest count is below the historical average. Note the steady decline for all series, due to the increasing deforestation. Figure 8b shows the estimated coefficients of the empirical climate model described in Equation 1. Each month (m) shows the estimated coefficient 𝜷𝒎. The small vertical lines show the estimated standard deviation of the estimative. The magnitude of the effect is stronger in the months of the wet season, even though, proportionally, this effect is stronger for the months of the dry season.
Source: CPI/PUC-Rio with data from ERA5 and MapBiomas, 2021
There are two main differences between the model in Equation 1 and the models that are currently found in the literature. First, the forest count variable (𝒄𝒍𝒎𝒚) could be replaced with a Leaf Area Index (LAI) variable. This would require LAI to be input in counterfactual scenarios of deforestation, a task that is not straightforward, given the variability of LAI across different land uses and times of the year. Second, back trajectories are computed with monthly averaged wind data instead of hourly data. This restriction greatly simplifies data management and computation necessity. The case study for the state of Mato Grosso, for example, can be run on a personal computer. Formally, these two differences may include measurement error in our explanatory variable of forest count. Such measurement error can down bias the estimates, generating a lower bound for the effect of deforestation on rainfall.
The next step is to use this model combined with a counterfactual deforestation scenario to understand the impact of localized deforestation on rainfall. In this study, the author considered a scenario where the entirety of the Xingu’s Indigenous Territories is deforested. This deforestation will impact the forest count variable and, consequently, rainfall. Which locations will be impacted depends on the back trajectories. Even though there is substantial variation across time in the paths of each trajectory, the average path is informative of atmospheric circulation patterns. Therefore, the average effect gives an expected impact of deforestation on rainfall.
The author would like to thank Jennifer Roche, Natalie Hoover El Rashidy, and Giovanna de Miranda for the editing and revision of the text and Meyrele Nascimento and Nina Oswald Vieira for formatting and graphic design.
[1] Spracklen, Dominick, et al. “The Effects of Tropical Vegetation on Rainfall”. Annual Review of Environment and Resources 43 (2018): 193-218. bit.ly/3zPtaXF.
