Global Landscape of Climate Finance: A Decade of Data
It has been more than a decade since CPI started comprehensively assessing global climate finance flows through the Global Landscape of Climate Finance (the Landscape). It monitors global primary investment by public and private actors in activities that reduce emissions and improve adaptation and resilience to climate change.
By setting this baseline, we aim to provide a snapshot of where and how climate mitigation and adaptation finance is flowing globally, based on consistently reported and collected data over the years.
The past decade saw growing momentum, where public and private climate finance almost doubled between 2011 and 2020. However, reaching climate objectives will require climate investment to increase at least seven times by the end of this decade as well as the alignment of all other financial flows with Paris Agreement objectives.
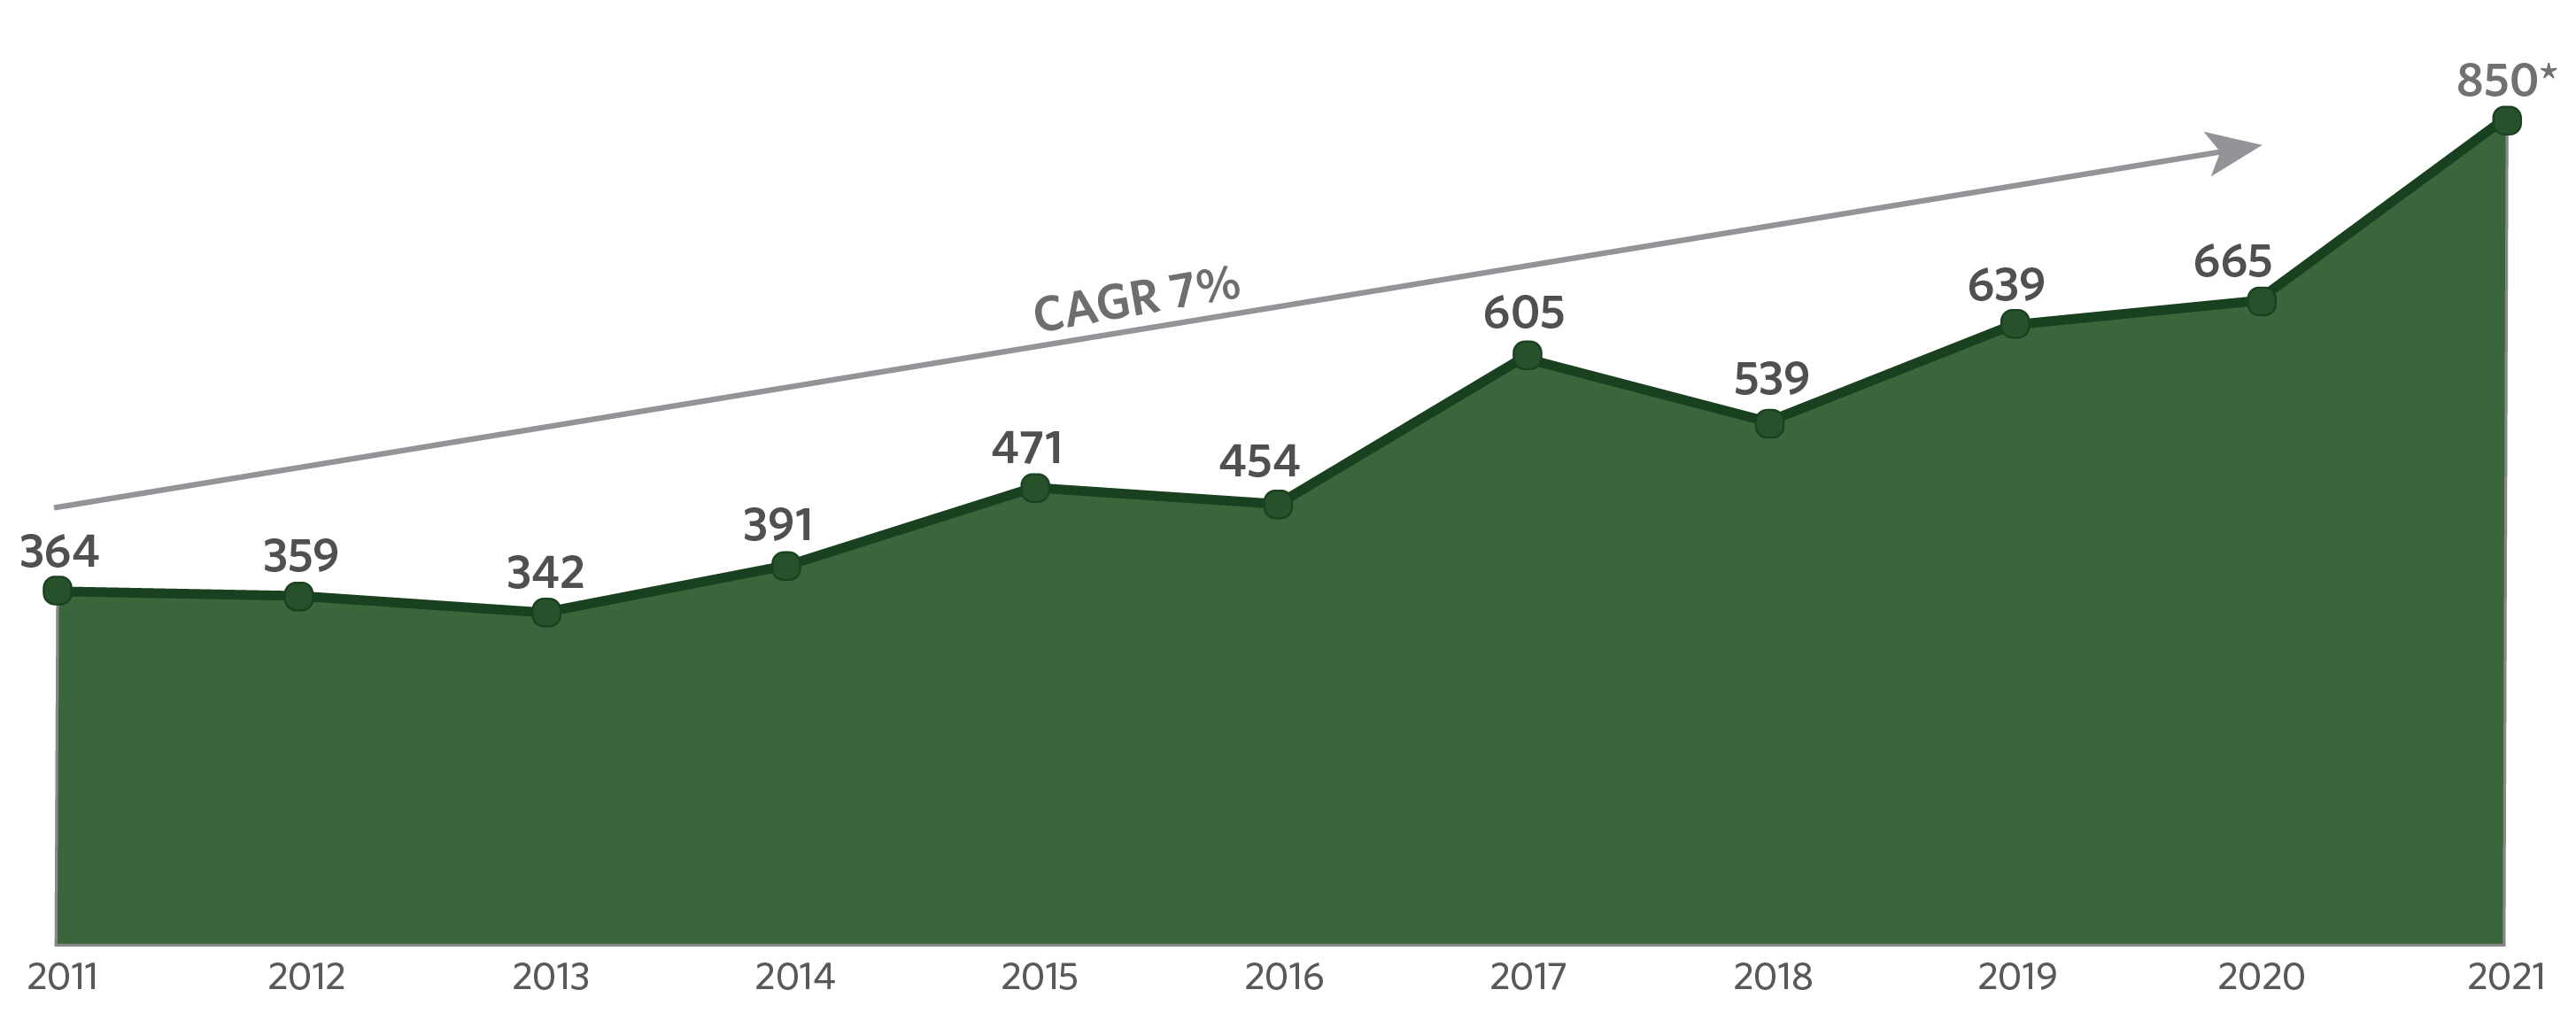
Figure 1: Global climate finance in 2011-2021 (USD bn, nominal)
The report provides a brief overview of sources, instruments, uses, and geographies in the past decade, as well as climate finance needs in the coming years by sectors and geographies. It also offers a preliminary estimate for climate finance in 2021, drawing on data published in 2022.
To inform the United Nations Framework Convention on Climate Change (UNFCCC) fifth Biennial Assessment and Overview of Climate Finance Flows, we leveraged new data to update climate finance flow estimates for the years 2019 and 2020, as previously reported in our 2021 Landscape.
Key insights from our preliminary estimates for 2021
Annual climate finance flows in 2019/20 reached USD 653 billion on average, which was 15% higher than in 2017/18. Our 2019/20 numbers were revised and enhanced following additional data sources on energy efficiency and updated data from OECD-DAC.
Based on currently available information, our preliminary estimates suggest 2021 climate finance flows amount to USD 850 – USD 940 billion, representing a 28% – 42% increase from 2019/20 averages, reaching an all-time high. A more precise analysis of 2021 climate finance flows will be confirmed in the next Landscape (2023) when more primary data becomes available.
The estimated increase is attributable to a significant increase in the transport sector driven by increased demand for electric vehicles and related infrastructure. For example, sales of electric vehicles alone doubled in 2021, reaching a new record.
7 key observations from tracking global climate finance
1: Global climate finance almost doubled in the last decade, with a cumulative USD 4.8 trillion in climate finance committed between 2011-2020 or USD 480 billion annual average. While climate finance increased at a cumulative average annual growth rate (CAGR)2 of 7%, the current levels of increase are not on track to meet a 1.5C global warming scenario. We need at least USD 4.3 trillion in annual finance flows by 2030 (CAGR 21%) to avoid the worst impacts of climate change. There is enough liquidity in global financial markets (USD 200 trillion held by investors in 2020) but barriers impeding deployment exist. Delayed investment will only further increase the cost of action and response. Notably, investments needed to adapt to climate change will increase considerably as global warming progresses.
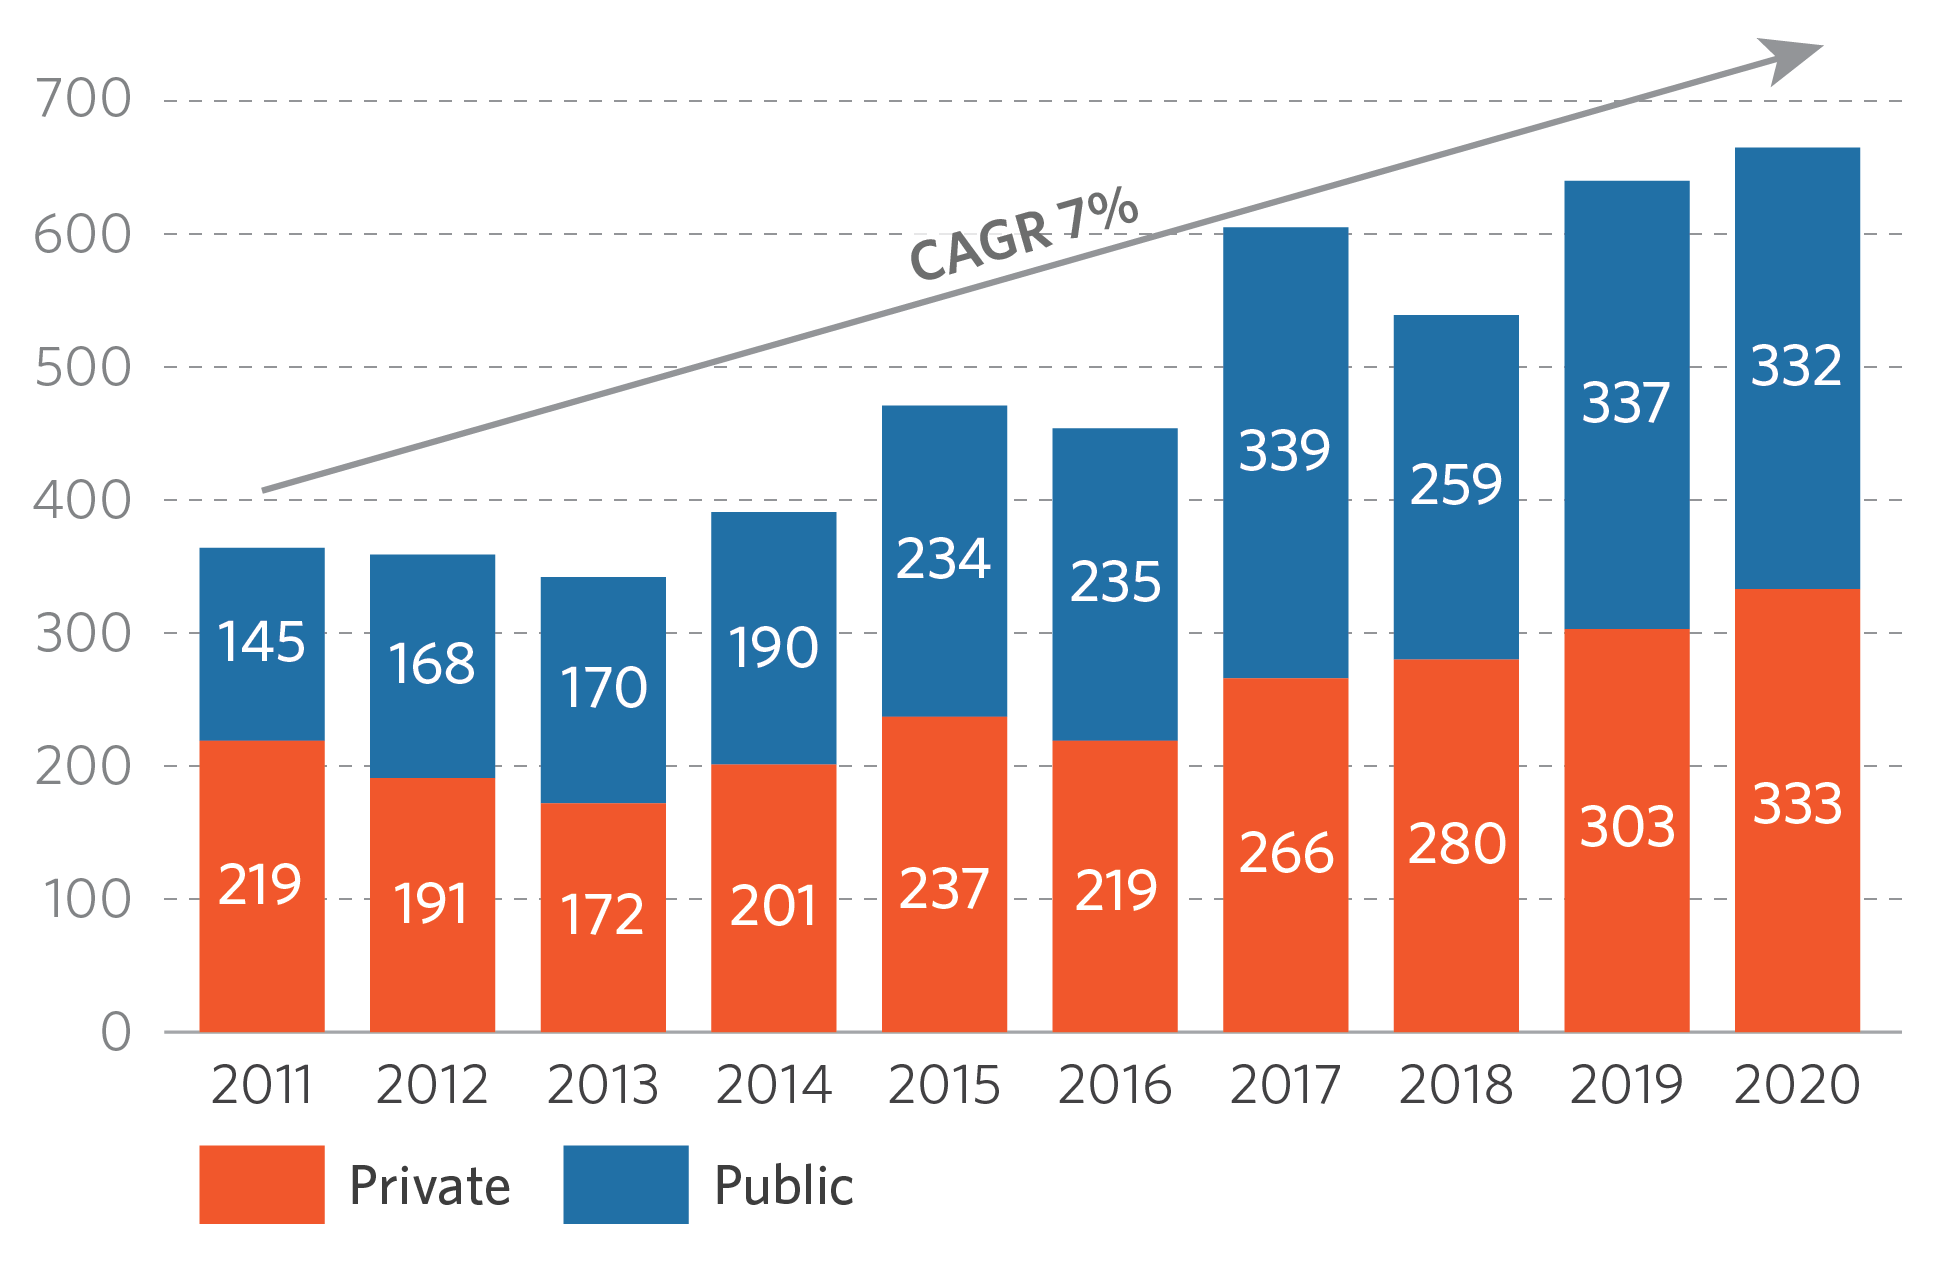
2: Private sector investment is increasing, but not at the scale and speed necessary for the transition. Private sector actors, particularly financial institutions with trillions of asset under management, are committing to net zero and sustainable finance practices. Nonetheless, it is not clear how fast these commitments are translating into changes and investment on the ground. The growth rate of private climate finance was slower (4.8%) than that of the public sector (9.1%) and must increase rapidly at scale. The public sector has been vital in channeling finance to hard-to-invest sectors such as agriculture and adaptation. However, there still a room for public finance to take more risks and to create enabling environments necessary for unlocking further pools of capital.
Figure 3: Climate Finance by public and private sources in 2011-2020 (USD bn)
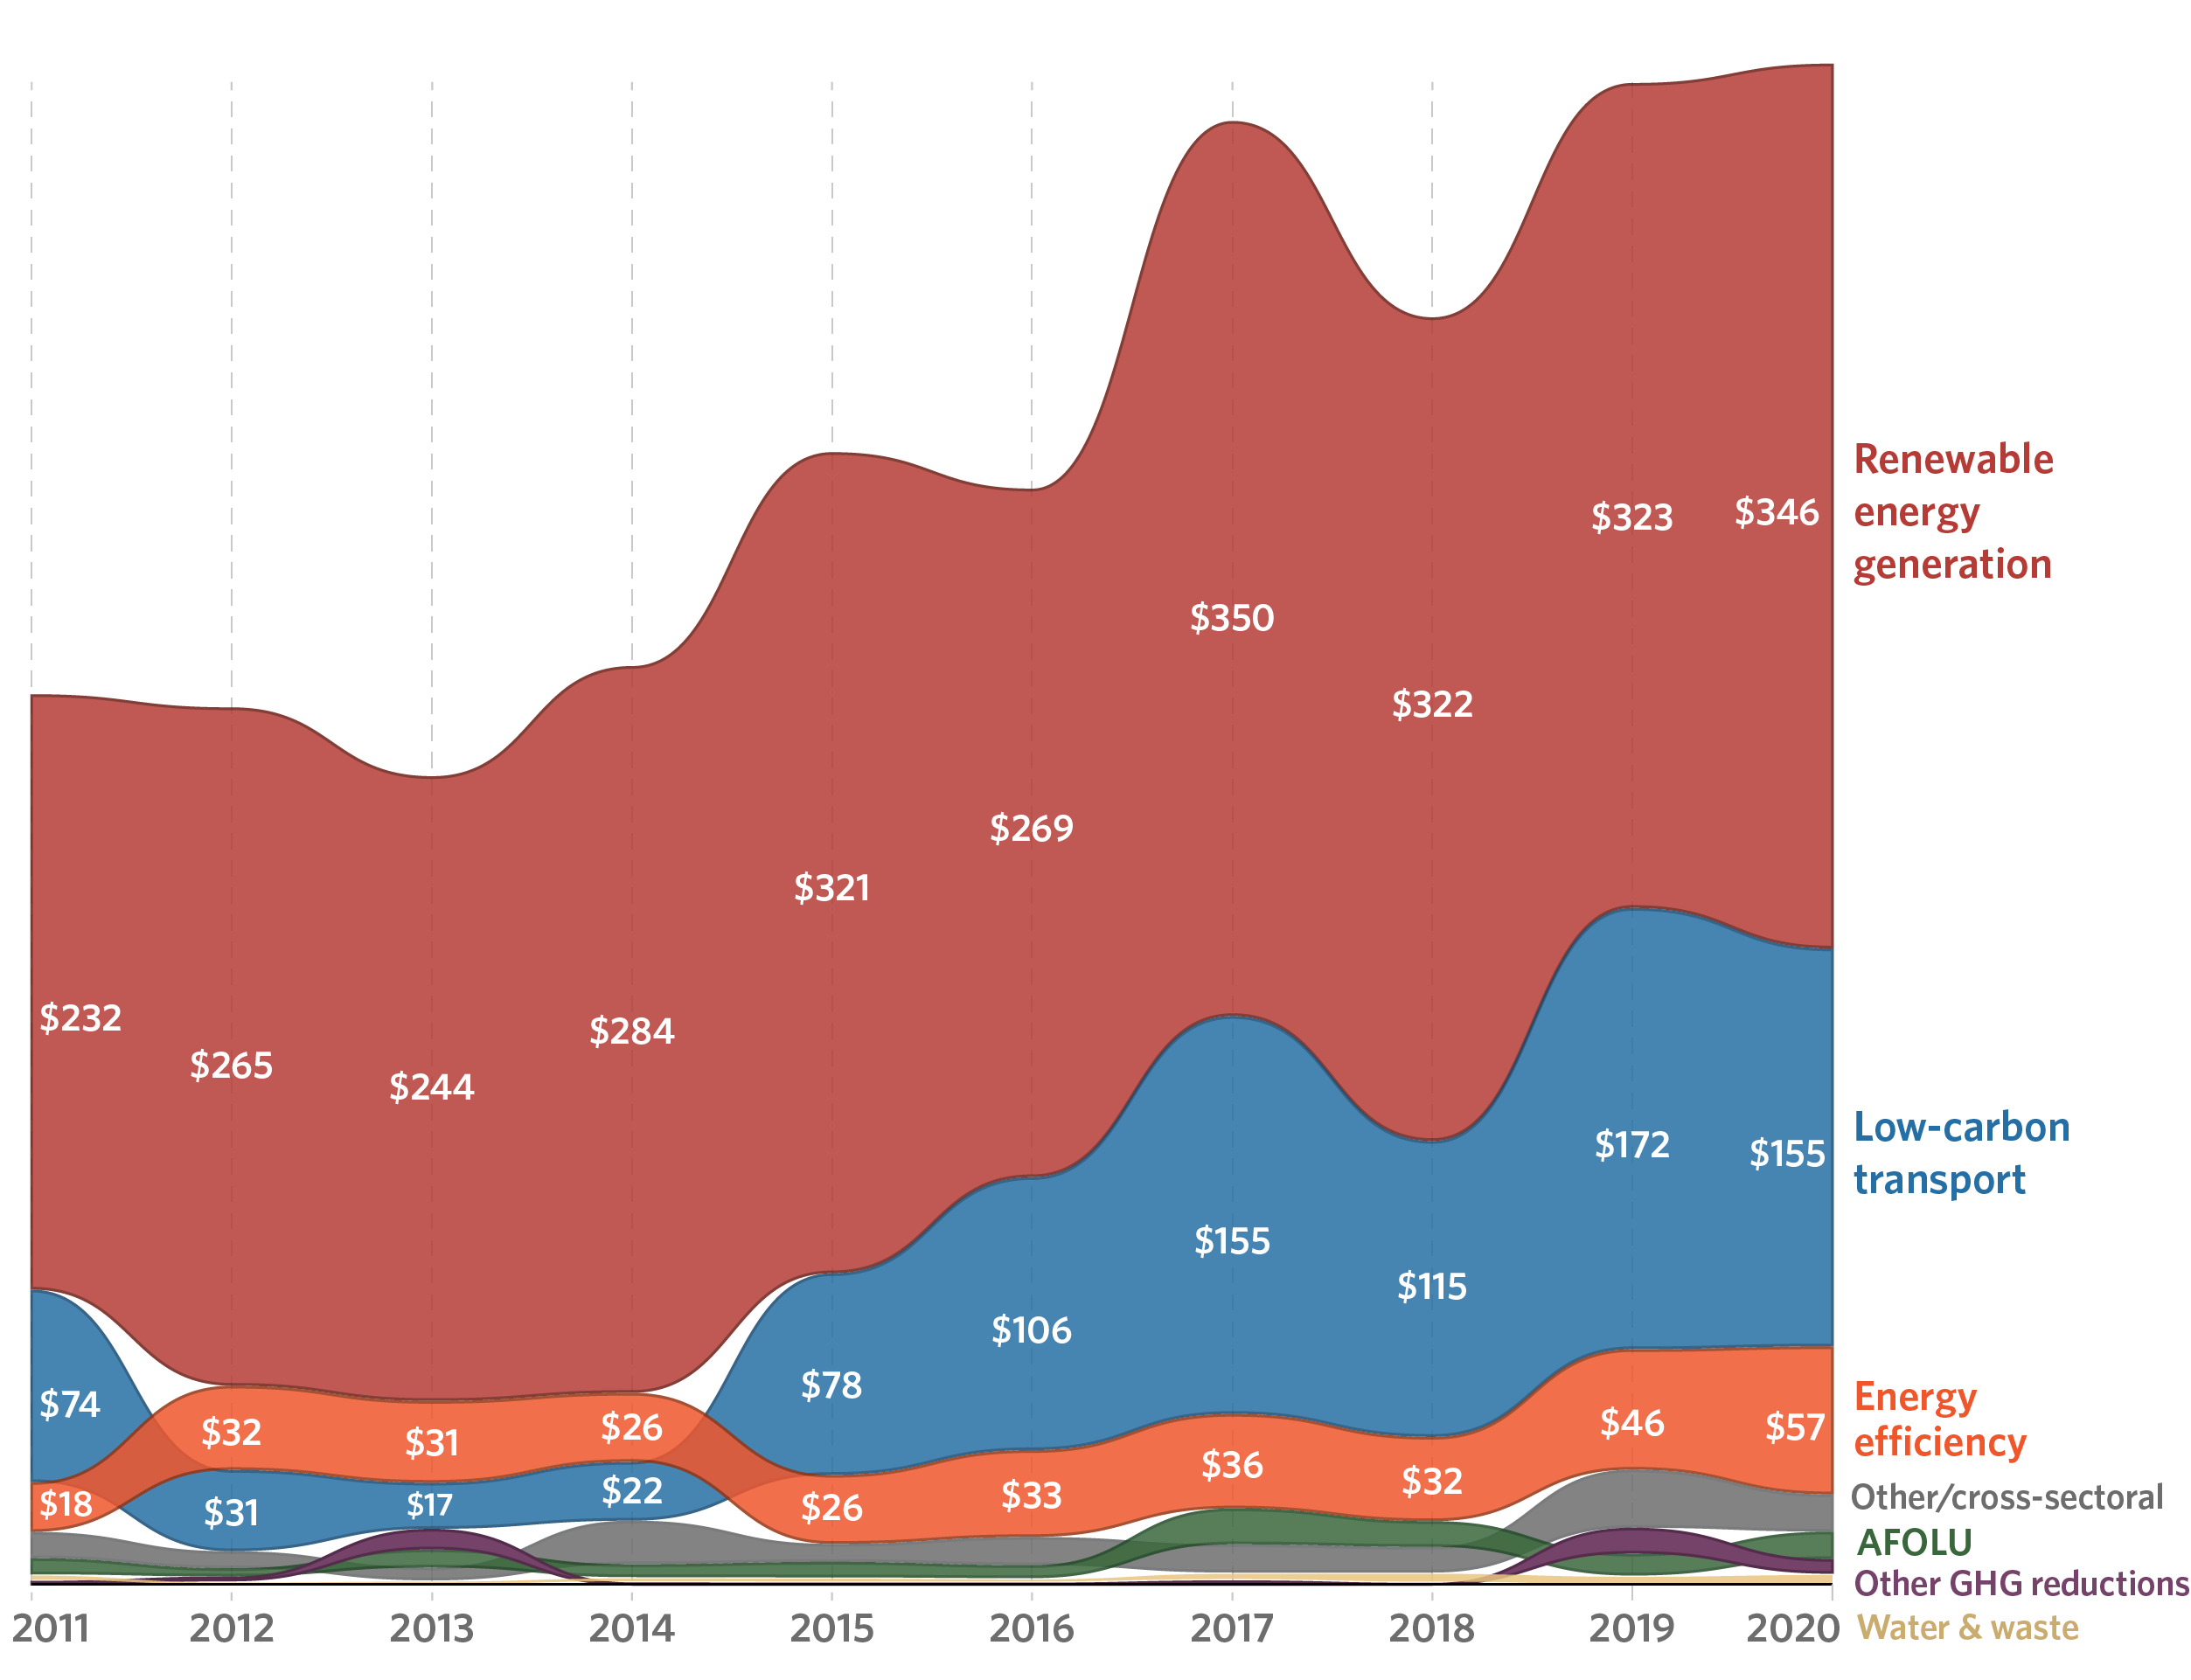
3: Finance towards renewable energy made the most progress, whereas adaptation and resilience finance lags significantly. The renewable energy sector was transformed into an established and competitive sector with a 7x higher return on investment than fossil fuels (IEA, 2021). Public sector support was particularly crucial in scaling renewable energy investment by supporting and enabling technology cost reduction, as well as providing incentives such as time bound subsidy mechanisms as markets became self-sustaining. Transport is the fastest-growing sector, built in part by sustained policy support for the industry. Other critical sectors, including agriculture, forestry, land use, industry, water and wastewater, all of which have potential to mature, are trailing behind. There is a lack of data on adaptation finance from the private sector. Nevertheless, the quantity and quality of adaptation finance fall far short of needs.
Figure 8: Climate mitigation finance by solutions (USD bn)
4: Continued fossil fuel support remains a barrier to achieving global climate goals. For example, the total fossil fuel subsidies in 51 major countries alone were 40% higher than the total global investment in climate finance between 2011 – 2020. This is alarming as fossil fuel subsidies are only a part of the overall funding in high emitting activities. Immediate action to remove dependencies on fossil fuel, including subsidies, will free up resources for more sustainable investments, as well as improve consumer price stability and increase energy independence.
5: Concessional finance was 16% of total climate finance, while debt consistently remained the main instrument for climate finance. Concessional financing is crucial in managing risks and uncertainties related to nascent technologies and markets. Grant finance is increasing, with volumes almost tripling between 2011-2020. However, their relative share in total climate finance remains low at less than 5%. The majority of grants were provided by governments in the forms of subsidies or international climate finance. The private sector relied on balance sheet investments (or investments through its own resources) and the public sector provided concessional or market rate loans. The majority of debt was raised in East Asia Pacific and Western Europe followed by North America, driven by renewable energy growth in those regions.
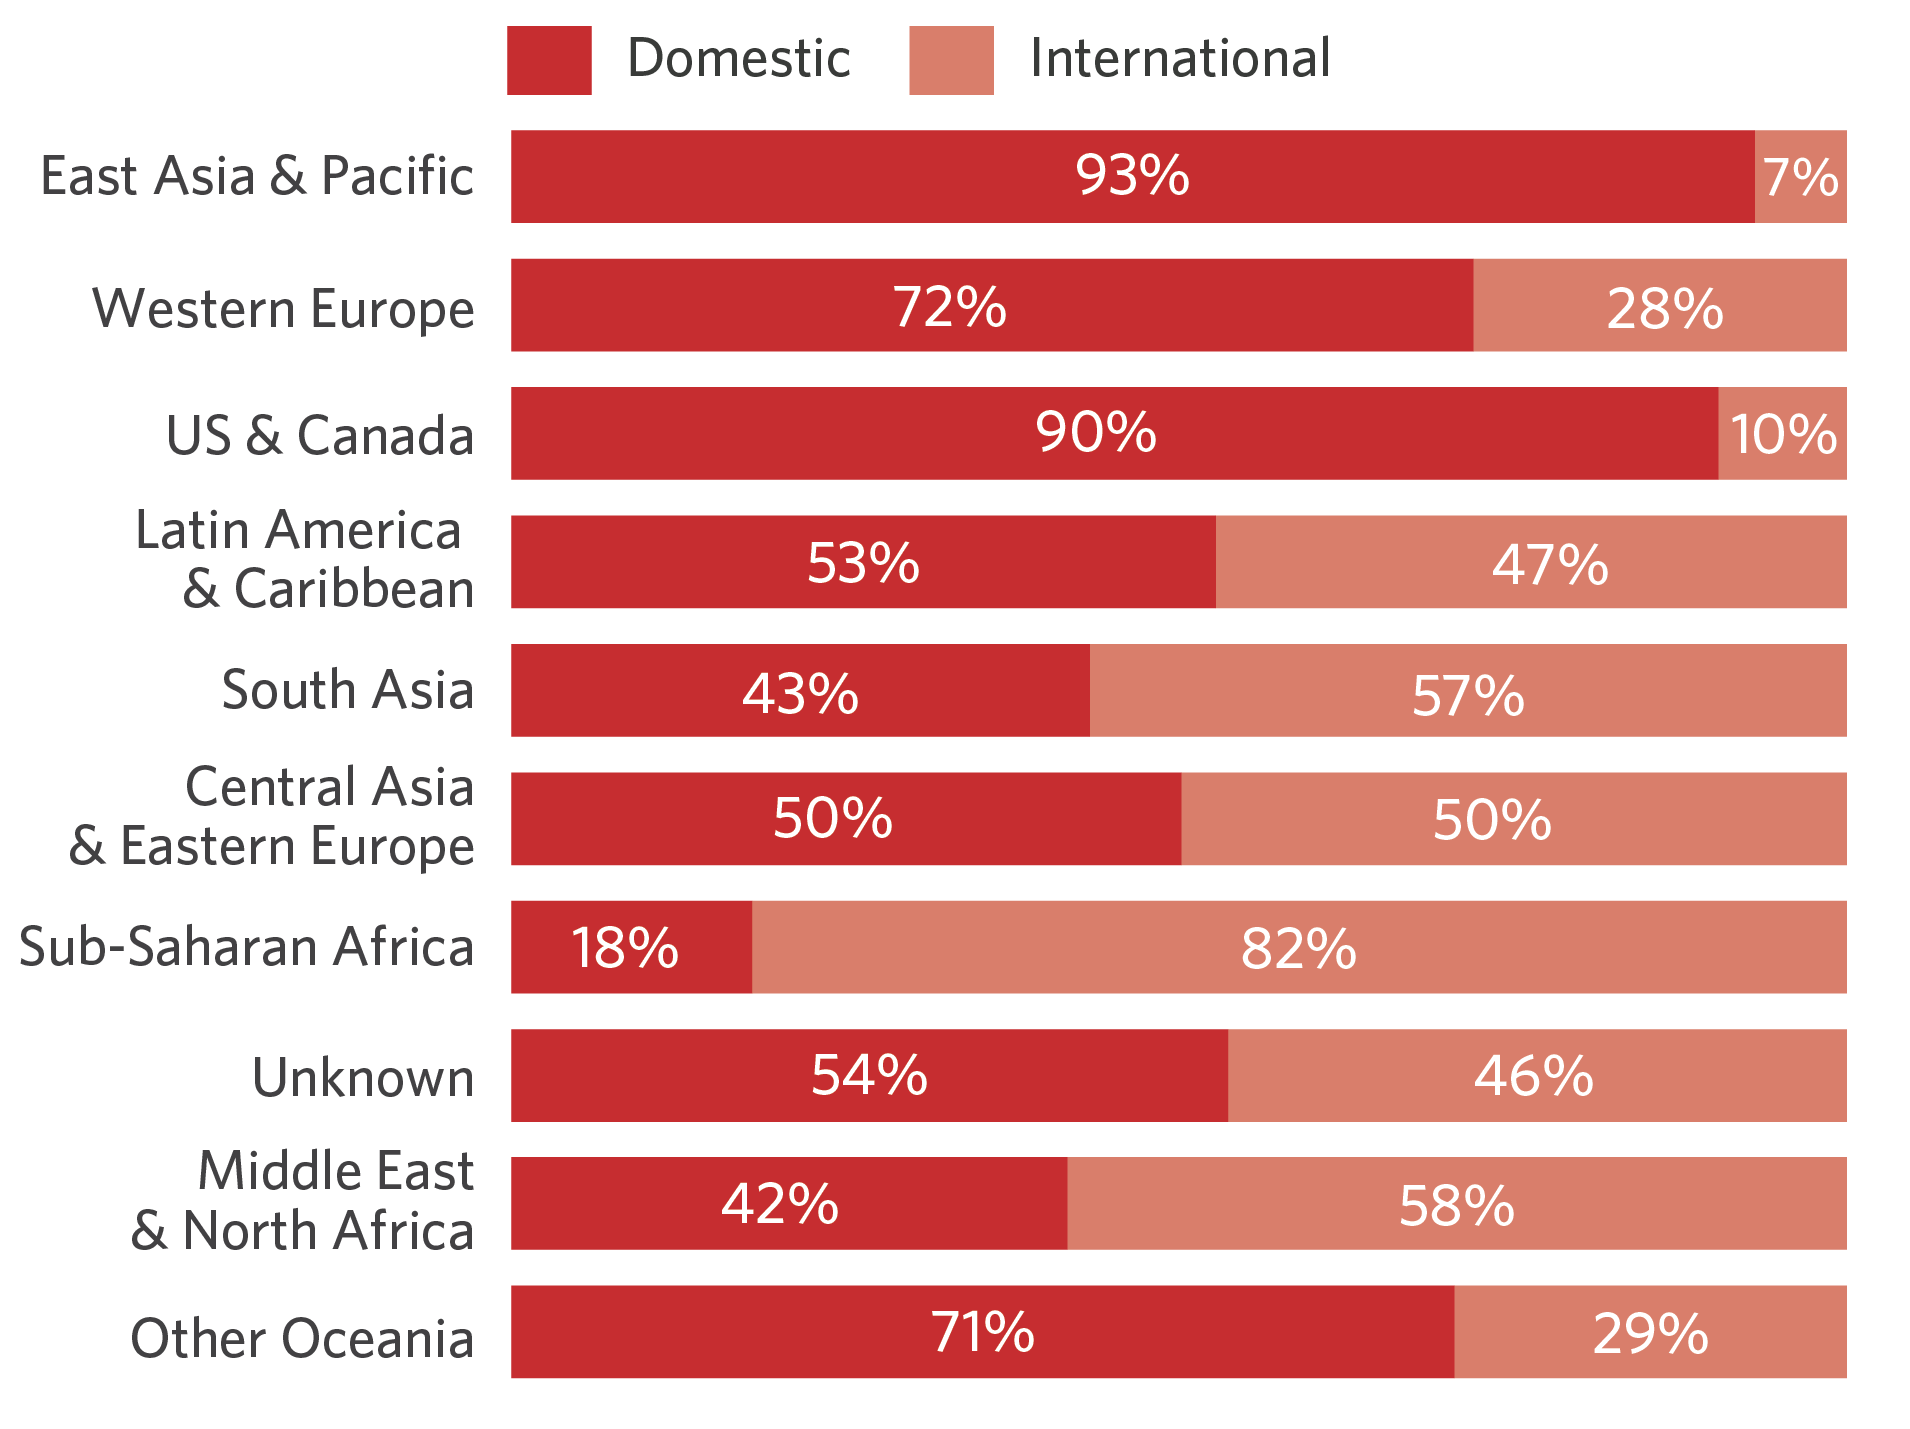
6: 76% of climate finance was raised domestically, primarily concentrated in East Asia & Pacific (dominated by China), North America, and Western Europe, confirming the importance of national regulations and enabling environments. While Central Asia and Eastern Europe attracted both domestic and international climate finance. Across all regions, there is a lack of consistently reported data on domestic public climate finance.
Figure 11: Climate finance regional distribution in 2011-2020 (%)
7: Data on finance flows is improving, but less is known about the impact and outcome of deployed climate finance. Public international climate finance is advancing on its reporting methodologies, which enables providers to better understand and prioritize climate investments. However, the same level of sophistication and consistency in reporting is lacking from the private sector, as well as in public domestic budgets, which leads to data gaps. More broadly, there are knowledge gaps in impact, outcome, and outcome levels of climate finance that are important to assess their effectiveness.
4 key climate finance actions for this decade
Climate transition presents tremendous investment opportunities across a range of sectors and regions. However, the current rate of climate investment increase will fail to secure the low carbon and climate resilient development needed. To match the 20% year-on-year increase in climate finance needed through 2030, four key actions to focus on in this decade are:
1: Adopt holistic sectoral strategies. Current blind spots in our response to climate change must be acknowledged and addressed. This means building sector-wide decarbonization and resilience strategies that spur systemic transformations – from cradle-to-grave – and ensure implemented solutions are well integrated.
2: Shift to a new finance paradigm. To implement holistic sector strategies, further public and private actor coordination is necessary. Every actor should know which part they can play and who they should be working with. But that alone will not be enough. Investors also need to look beyond short-term financial returns, use longer-term and multi-factor informed investment strategies, and explore innovative financial mechanisms that could be deployed at scale.
3: Policies to create enabling environments for private finance mobilization. The successes achieved in the energy sector must be mirrored in other sectors and in emerging economies through a coordinated set of actions and policy decisions around reducing technology costs, promoting innovation in hard-to-abate sectors, scaling proven technologies, redirecting fossil fuel support, and creating predictable environments that accelerate net zero transition.
4: Make decision-critical data on climate finance flows available: The public and private sectors should collaborate on a common definition of climate expenditure. This will help improve disclosure and build a climate investment data platform to channel climate finance to where it will have the most impact.
