What is the Climate Risk for Rural Producers in the Caatinga? Challenges for a Rural Just Transition
Introduction
Recent research predicts an increase in both the number and intensity of severe weather events (Masson-Delmonte et al. 2021; Assad, Magalhães 2014), requiring effective responses from the various sectors of the country. In agriculture, this scenario puts pressure on the transition to low-carbon technologies, capable of reducing the sector’s impact on greenhouse gas emissions, which currently accounts for 25% of Brazil’s emissions (SEEG 2021).
The Northeast region of Brazil, a semi-arid region with historically low levels of agricultural productivity and the worst income conditions for its population, has suffered the most severe impacts of droughts (Marengo et al. 2022). A study on the climate vulnerability of different regions of the world points to the Caatinga, a semi-arid biome in Brazil that predominates in the Northeast region and covers 10% of the nation’s territory, as one of the six areas most vulnerable to climate variability (Seddon et al. 2016). In view of these challenges, this report analyzes the climate risk[1] to which rural producers in the region are exposed.
When assessing agricultural vulnerability to drought events, researchers from the Climate Policy Initiative/Pontifical Catholic University of Rio de Janeiro (CPI/PUC-Rio) found that the producers with the highest level of climate vulnerability are family farmers,[2] who account for 79% of all rural properties in the Caatinga. Based on a productivity assessment of the main activities (cattle and temporary crops), the researchers have found that, in the face of episodes of drought, municipalities with a greater number of family farmers had greater losses in production in the last three decades. The results also indicate that the climate vulnerability to which these producers are exposed has consequences beyond the short term. Severe long-term implications affect agricultural production, as well as education, health, and poverty indicators. To prevent the effect of climate change on the region’s long-term development, social vulnerability needs to be incorporated into the design of public policies for Caatinga producers.
Climate Risk and Agricultural Productivity
Extreme drought events in the Caatinga are more severe than in other biomes. Over the last 60 years, precipitation levels in the Caatinga have been lower than elsewhere in the country, as shown in Figure 1. In addition to precipitation, a region’s agricultural production capacity also depends on other factors, like the soil’s water retention capacity, and characteristics such as vegetation, composition and temperature affect soil humidity. Recent literature on climate has addressed this issue by creating aridity indices, which incorporate other factors (in addition to precipitation) to measure the water balance of a given region (Arora 2002; Dai 2013; Brito et al. 2018).
Rural producers in the Caatinga face major challenges imposed by the semi-arid climate. With an average annual precipitation of 930mm, a volume 39% lower than in other biomes, they need to adapt their production to periods of concentrated rainfall, which occurs during only three to four months of the year. Additionally, erosion processes and loss of soil nutrients are also part of the desertification process in the region, already underway in 12.8% of the semi-arid region according to data from Lapis/UFAL (Domingues 2019). With the increase in the region’s average temperature, climate change increases the dryness of areas with the highest water deficits.
This report presents an aridity index[3] which combines precipitation and evapotranspiration information to assess the water balance of the Caatinga,[4] following Cavalcanti (2018) and Albert, Bustos and Ponticelli (2021) and using data from the National Institute of Meteorology (Instituto Nacional de Meteorologia – INMET). The aridity index calculates the yearly volume of evapotranspired water relative to the total precipitated water. The higher the index, the lower the water retention capacity in the region and, therefore, the greater the aridity of the area. Thus, this index provides a measure of the severity of drought episodes given their intensity and duration.
Figure 1b shows that the average levels of the aridity index are higher for the Caatinga when compared to the other Brazilian biomes. In addition, the index’s variation in this biome is much greater than in other regions. This means that the Caatinga faces not only more frequent, but also more intense drought processes.
Figure 1. Climate Variables in the Caatinga and Other Biomes, 1961-2021
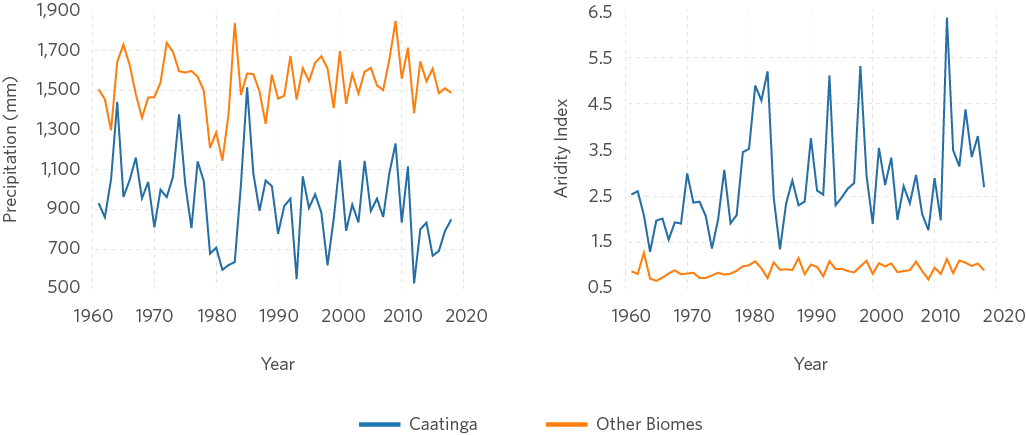
Source: CPI/PUC-Rio with data from INMET and IBGE, 2023
To assess the impact of climate risks on the Caatinga, researchers from CPI/PUC-Rio looked into the productivity of the main activities carried out by family farmers in the biome. Data from the 2017 Agricultural Census that cattle for 51% of all family farming establishments. Temporary crops comprise the second most frequent activity, performed by 38% of family farming establishments (Figure 2a). To assess the effect of drought events on crop productivity, the analysis focuses on the two main crops, beans and corn, in terms of number of establishments and total area (Figure 2b).
Figure 2. Family Farming Establishments by Economic Activity and Agricultural Production in the Caatinga
Figure 2a. Economic Activity
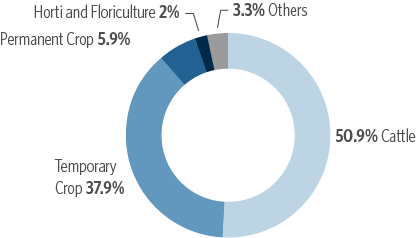
Figure 2b. Agricultural Production
Source: CPI/PUC-Rio based on data from the 2017 Agricultural Census (IBGE), 2023
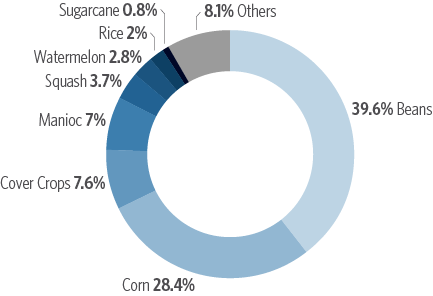
Figure 3 shows the productivity of the main activities carried out by family farmers in the Caatinga compared to other Brazilian biomes, based on data from the Municipal Agricultural Survey (Pesquisa Agrícola Municipal – PAM) and the Municipal Livestock Production Survey (Pesquisa da Pecuária Municipal – PPM), both conducted by the Brazilian Institute of Geography and Statistics (Instituto Brasileiro de Geografia e Estatística – IBGE 2020, 2019). It should be noted that farmers in the Caatinga have historically lower productivity levels, producing less (kg or head of cattle) per hectare.[5] The Caatinga is not only less productive, but has had little to no growth over the past three decades. Contrary to other biomes, the Caatinga has not experienced a productivity growth trend in bean and corn production over the last three decades. was Additionally, a drop in cattle productivity has exacerbated the gap between this biome and the others.
Figure 3. Productivity of the Main Activities carried out by Family Farmers in the Caatinga
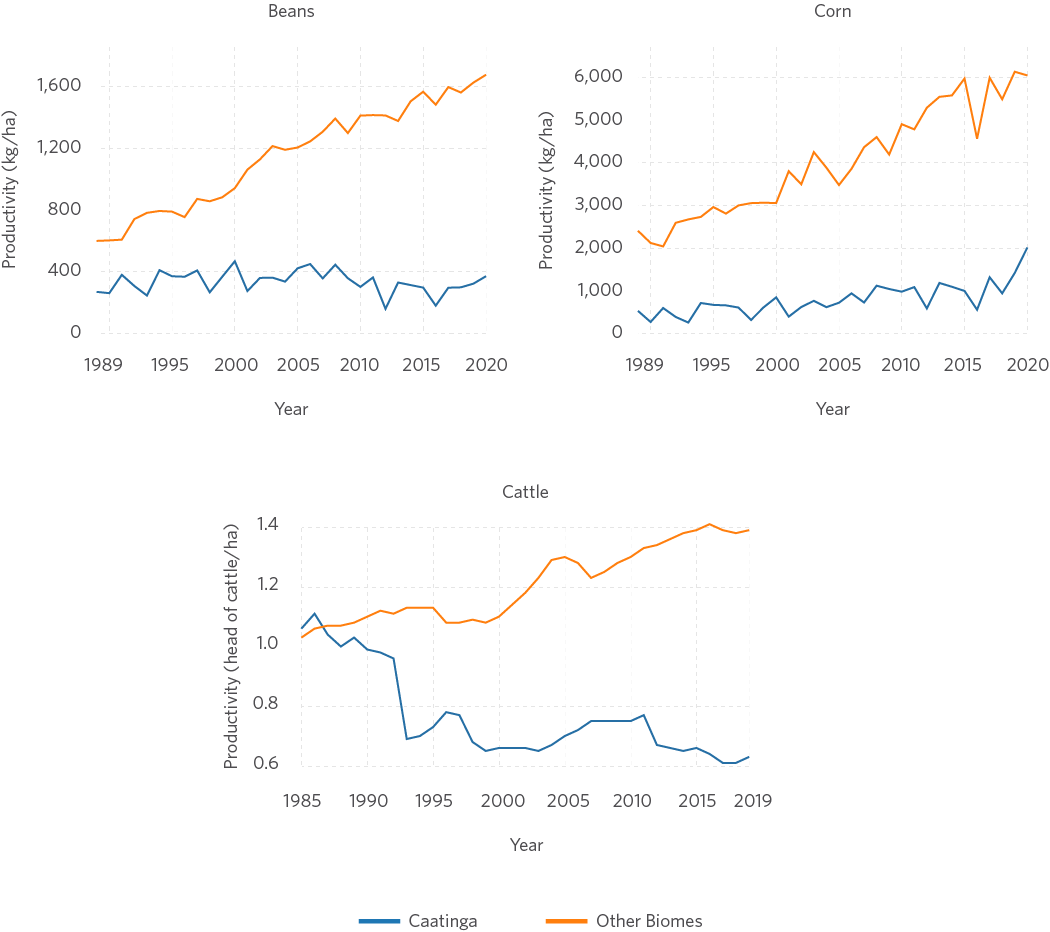
Source: CPI/PUC-Rio with data from PAM, PPM and MAPBIOMAS, 2023
In a scenario of historically low productivity, the sensitivity of agriculture to climate shocks[6] poses an added challenge to Caatinga producers. Figure 4 shows the productivity sensitivity of bean, corn, and cattle production to climate shocks, measured by the aridity index.[7] Municipalities in the Caatinga systematically show lower productivity levels than municipalities in other biomes. Highlighting the sensitivity of bean productivity to increased levels of drought, Figure 4a shows what happens when there is a variation of one unit in the aridity index around the midpoint of each straight line. In absolute value, the Caatinga shows a drop similar to that of other biomes, of about 45 kg/ha, when there is a one-unit increase in the aridity index. However, considering the lowest level of productivity, Caatinga shows a drop of 16%, compared to a drop of 6% in the other biomes.
Figure 4b presents a similar analysis for corn. The difference in the slope of the straight lines shows that, in absolute terms, an increase of one unit in the aridity index leads to a decrease of 155 kg/ha in the Caatinga and of 380 kg/ha in the other biomes. However, considering the low productivity already seen in the Caatinga, this represents a productivity loss of 35% in the Caatinga due to the increase in drought versus a productivity drop of 16% in the other biomes.
Finally, Figure 4c shows the variation in cattle productivity. In absolute terms, the drop in cattle productivity in the Caatinga is 0.1 head/ha, while in the other biomes the ratio is reversed, although it remains low (an increase of 0.02 head/ha). In relative terms, the percentage drop in productivity is significant in the Caatinga: 9% versus 1% increase in other biomes.
Figure 4. Sensitivity of Agricultural Productivity to Increased Aridity
Figure 4a. Beans
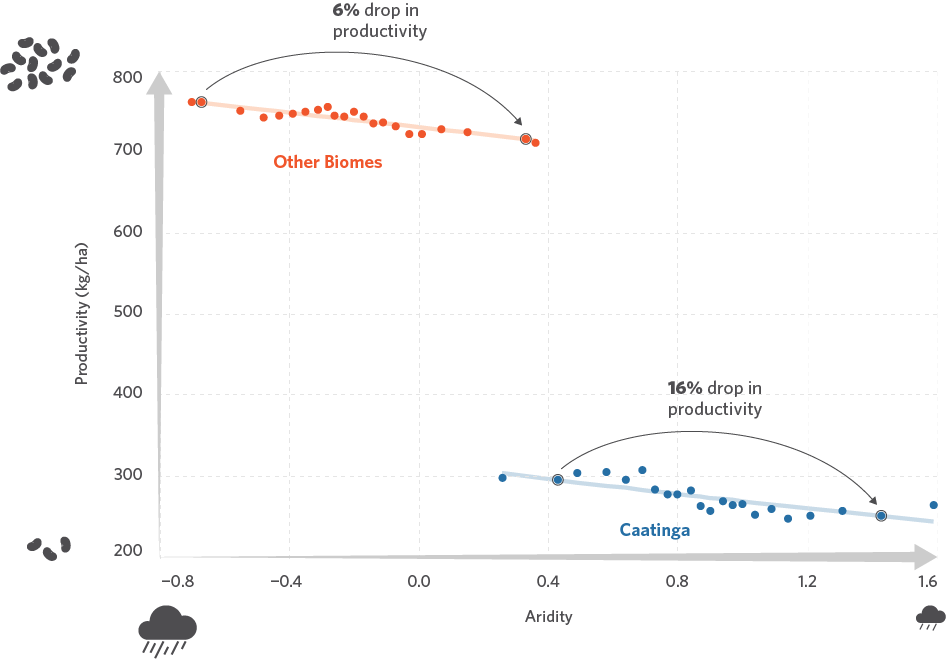
Figure 4b. Corn
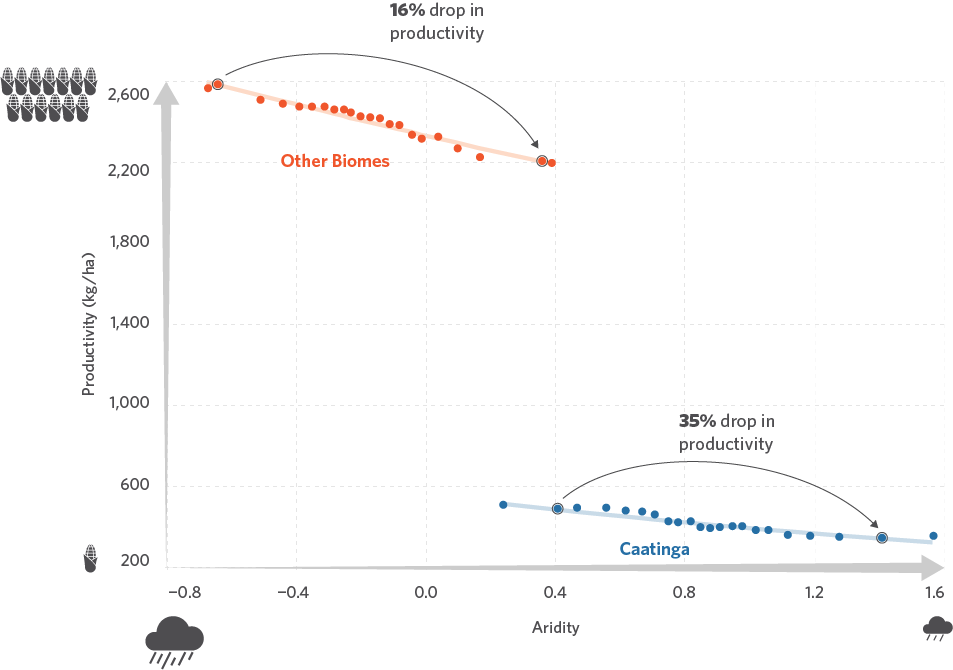
Figure 4c. Cattle
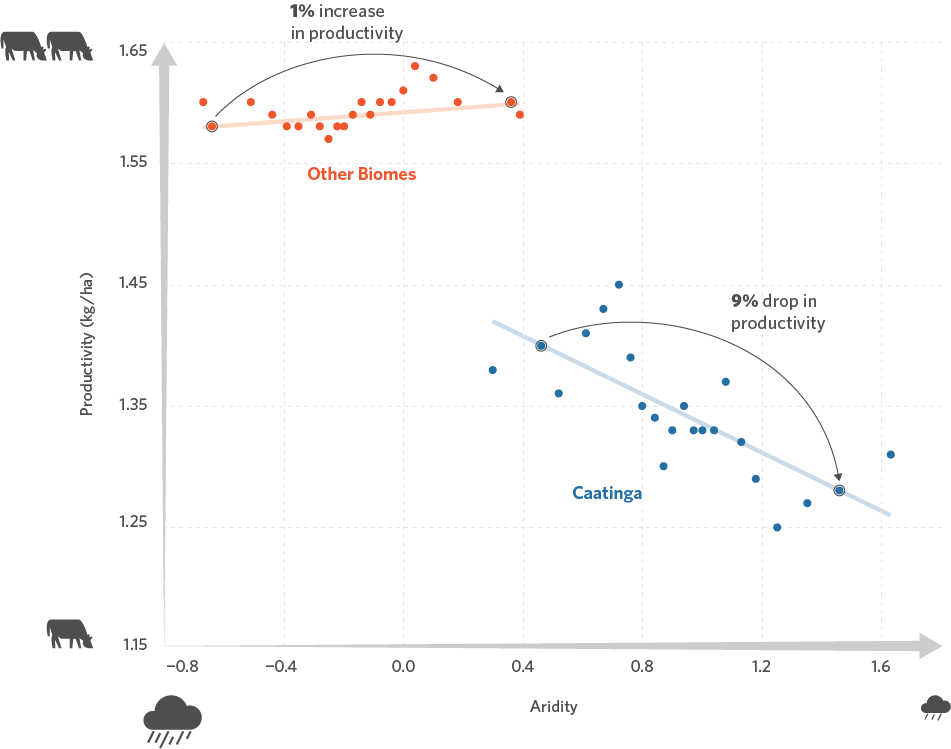
Note: Each point on the graph represents the average of values grouped into intervals of the Aridity Index. Observations are at municipality-year level and cover a period of 29 years (1989-2018). All regressions include year and municipality fixed effects. Standard errors are clustered at the municipal level.
Source: CPI/PUC-Rio with data from INMET, PAM, PPM, MAPBIOMAS and IBGE, 2023
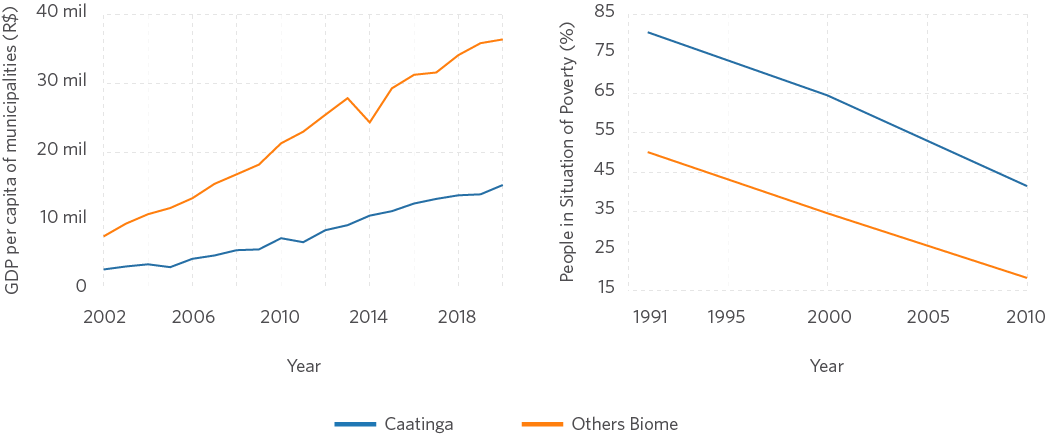
As previously mentioned, the Caatinga biome features lower productivity levels and greater sensitivity to climate shocks. Therefore, increasing the resilience of producers is crucial to achieving sustainable agriculture. When looking at the Gross Domestic Product (GDP) of the agricultural sector per capita in the Caatinga, a discrepancy, similar to that found in productivity, emerges. While other biomes show constant growth and a sharp increase (especially in the last decade), the agricultural GDP per capita of the Caatinga did not follow this trend (Figure 5).
Figure 5. Agricultural GDP per capita, 2002-2020
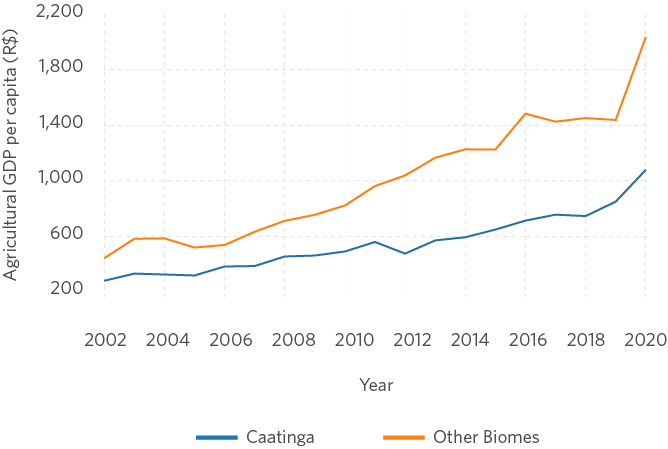
Note: The municipal agricultural GDP per capita was calculated by the ratio of the value added referring to the agricultural activity in the municipal GDP over population calculated in the Census (when available) or inter-census population projections used by the Federal Court of Accounts (TCU).
Source: CPI/PUC-Rio with data from IBGE, 2023
Incorporating 36% of rural properties in Brazil, the Caatinga is heavily dependent on agriculture. In this biome, 44% of the population works in the agricultural sector, compared to 36% nationally (IBGE 2010). However, producers in the Caatinga are in a region of greater social vulnerability than producers in other biomes.
Figure 6 shows the GDP per capita of Caatinga municipalities to be lower than the averages of the other biomes. Furthermore, even though the number of people living in poverty has dropped in Brazil in recent decades,[8] Figure 6 shows that this indicator is systematically higher in the Caatinga, where 54% of households receive cash transfers from the Bolsa Família Program.[9]
Figure 6. Socioeconomic Indicator
Note: The municipal GDP per capita was calculated by the ratio of municipal GDP over population calculated in the Census (when available) or inter-census population projections used by the TCU.
Source: CPI/PUC-Rio with data from IBGE and UNDP, 2023
Who is Most Exposed to Climate Risk?
Family farmers make up the largest group of rural producers in Brazil, with a third of them located in the Caatinga. In this biome, they manage 79% of rural establishments, with a total of 1.36 million properties. They are also the ones with less access to technical assistance (only 8%, compared to the national average of 18%), most of which comes from the government. In terms of scarce access to water, 72% use cisterns as their main source of water. Additionally, low schooling levels can make the adoption of more climate-resilient technologies challenging: 53% are illiterate, and 37% have only primary education (de Albuquerque et al. 2023).
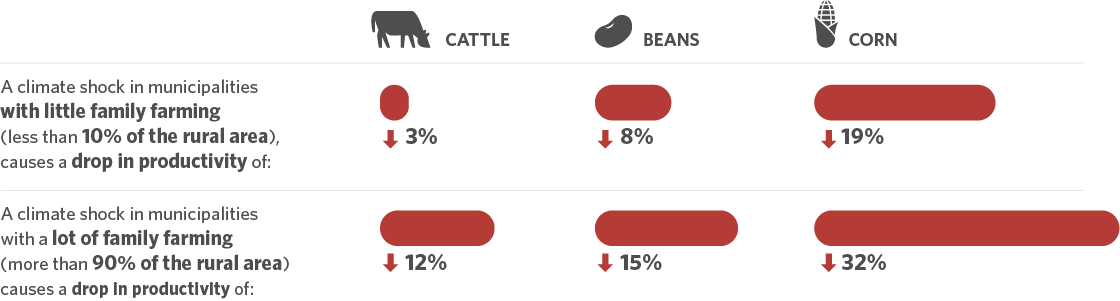
Climate shocks can affect producers in different ways and may pose greater risks for some specific groups. In the case of family farmers, the fact that 68% of them produce for their own consumption suggests that they could be more vulnerable to climate change. Faced with this challenging scenario, Figure 7 illustrates the productivity sensitivity of family farmers in the Caatinga to episodes of drought. An increase of one standard deviation in the biome’s aridity index for municipalities with little family farming (less than 10% of the rural area), results in a drop of 8% productivity for beans, 19% for corn, and 3% for cattle.
Conversely, in municipalities with a large concentration of family farming (more than 90% of the rural area), the productivity drop reaches 15% for beans, 32% for corn, and 12% for cattle. Therefore, the larger the area occupied by family farmers in the municipality is, the greater the productivity loss in a drought event will be.To design effective policies that increase the resilience of these producers, it is important to understand the level of exposure of production to climate vulnerability.
Figure 7. Family Farming and Productivity Loss Due to Increased Aridity
Note: Due to the absence of annual data, data on percentage of the area of family farming were interpolated between the 1989-2005 and 2006-2017 periods, based on data from the Agricultural Census, with the growth rate annualized between 2006 and 2017. Observations are at municipality-year level, spanning a period of 29 years (1989-2018). All regressions include year and municipality fixed effects. Standard errors are clustered at the municipal level.
Source: CPI/PUC-Rio with data from PAM, PPM and MAPBIOMAS, 2023
Exposure to Climate Risk and Social Vulnerability
In addition to assessing how the increase in drought affects agricultural production, it is important to understand the social dimension of the impacts of extreme weather events in the Caatinga. This section presents the relationship between the aridity index and a few socioeconomic variables, while focusing on dimensions that have immediate effects, such as poverty and the labor market, as well as dimensions that entail long-term consequences, such as health and education.
In general, increased drought is correlated with higher levels of poverty. Figure 8 shows how higher aridity indices are associated with lower per capita income,[10] greater income inequality as measured by the Gini index,[11] and a higher proportion of people living in poverty, which supports evidence previously found (Hidalgo et al. 2010). To calculate the size of the challenge, Figure 8 demonstrates the results of increasing the aridity index by one unit: 7% loss in per capita income, 9% increase in the social inequality index, and 13% increase in the number of people living in poverty.
Figure 8. Relationship between Socioeconomic Variables and Aridity Indices in the Caatinga
Figure 8a. Per capita Income
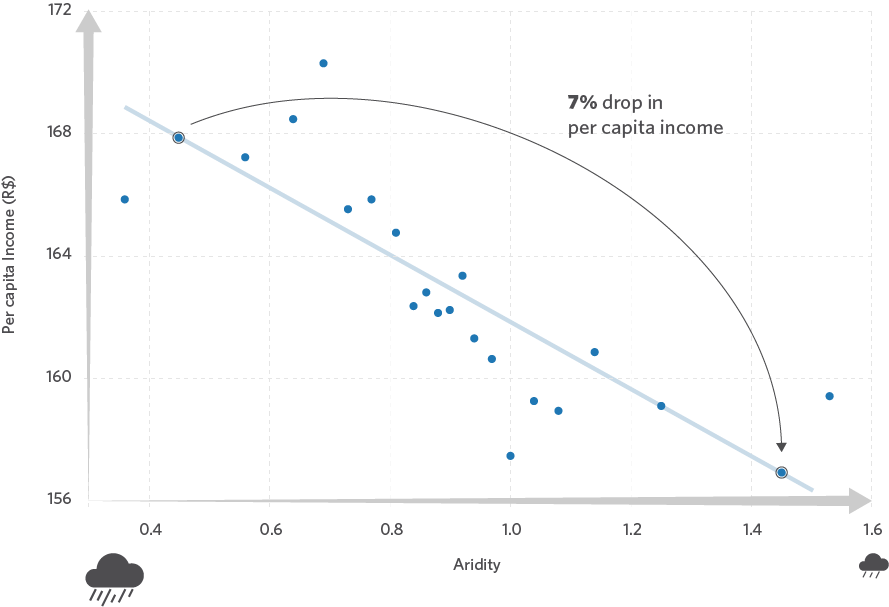
Figure 8b. Gini Indexi
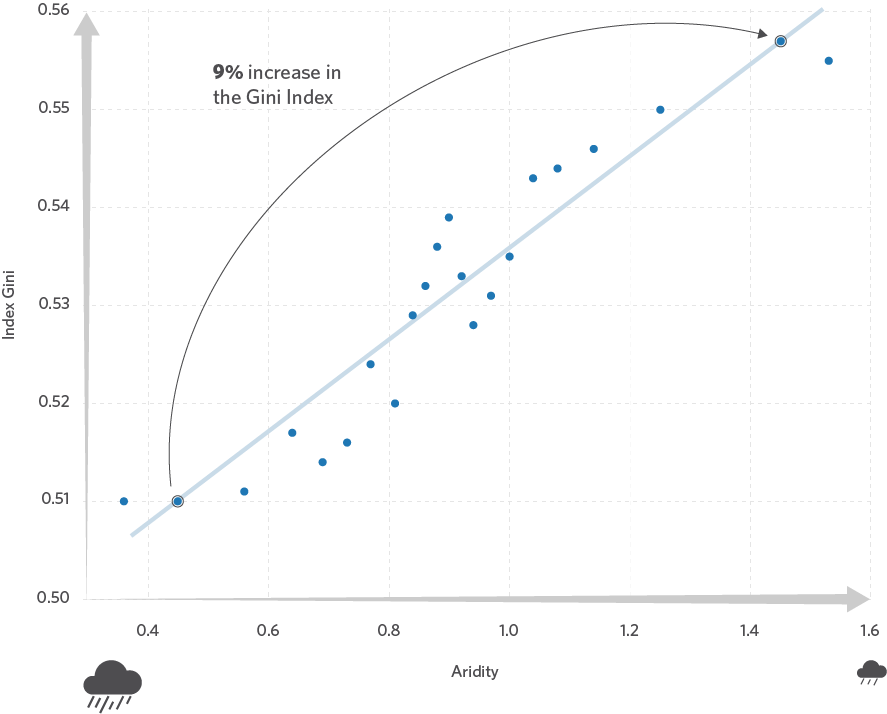
Figure 8c. Proportion of People Living in Poverty
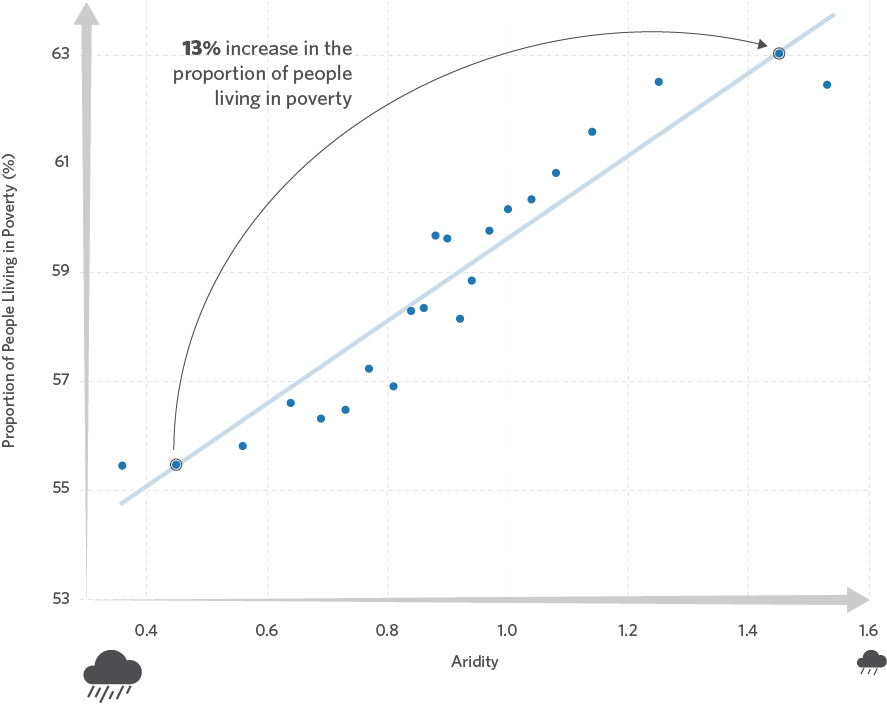
Note: Observations are at county-year level, spanning the years 1991, 2000 and 2010. The aridity data refers to the average of the aridity index for the last three years of each period of analysis. All regressions include year and municipality fixed effects. Standard errors are clustered at the municipal level.
Source: CPI/PUC-Rio with data from INMET and IBGE, 2023
These figures, as well as the others presented so far, show only correlations. Droughts may, in fact, adversely affect income due to the loss of agricultural production and push rural establishments into poverty. However, it is also possible that the poorest people are unable to afford to live in places where the land is more productive, so they precisely concentrate in places more exposed to drought.
Considering the subsistence context of agricultural production in the Caatinga, drought episodes that lead to a loss of production are directly related to food availability and the ability of parents to provide adequate nutrition to children in early childhood, a crucial factor for human development (Glewwe et al. 2001). In order to analyze potential long-term effects of drought on health, Figure 9 shows a positive relationship between the aridity index and child mortality rates in the Caatinga, in line with previous evidence for the Brazilian semi-arid region (Rocha, Soares 2015). An increase of one unit in the aridity index is correlated with a 10% increase in mortality rate.
Figure 9. Relationship between Child Mortality and Aridity Index
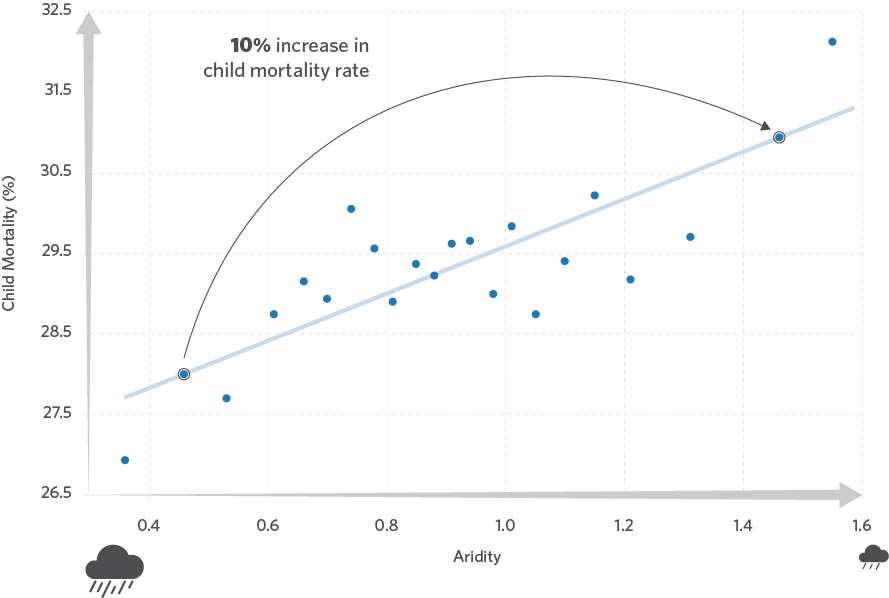
Note: Observations are at county-year level and cover a period of 24 years (1996 to 2020). All regressions include year and municipality fixed effects. Standard errors are clustered at the municipal level.
Source: CPI/PUC-Rio with INMET and SIM data, 2023
These effects of drought on health are magnified over time, as they can directly affect other dimensions related to long-term well-being, such as educational level and income generation (Maccini Yang 2009). For example, literature contains solid evidence on how poor nutrition leads to low school enrollment rates (Alderman et al. 2001). In the Caatinga context, Figure 10 shows a correlation between climate shocks and school delay rates, with higher levels of drought related to higher school delay rates in primary education.[12] A one-unit increase in the aridity index correlates with a 19% increase in the school delay rate. The relative effect of the increase in the index is even greater than the growth seen in the child mortality rate.
Figure 10. Relationship between School Delay and Aridity Index
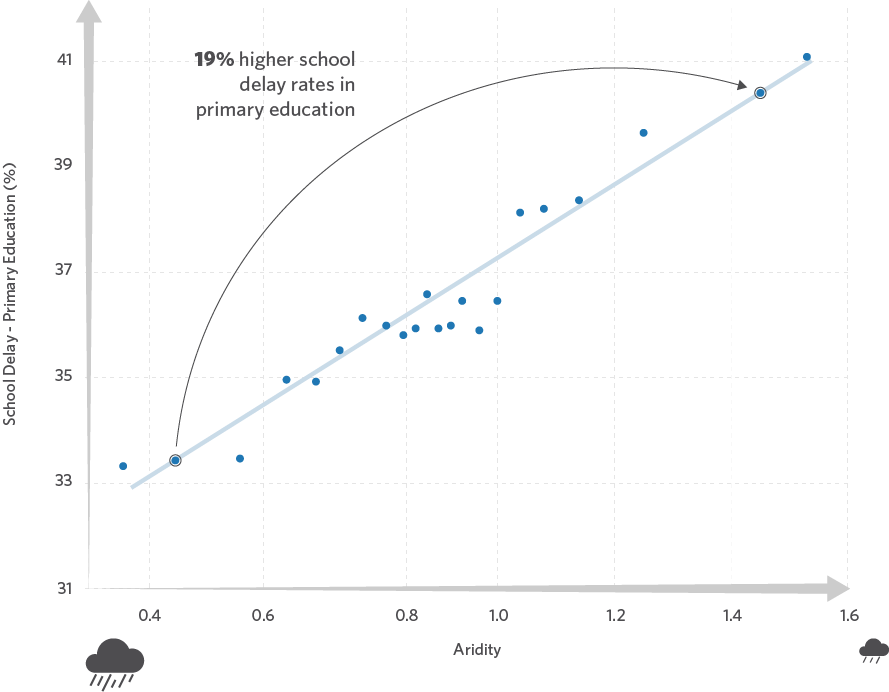
Note: Observations are at county-year level and cover the years 1991, 2000, and 2010. The aridity data refer to the average aridity index for the last three years of each period under analysis. All regressions include year and municipality fixed effects. Standard errors are clustered at the municipal level.
Source: CPI/PUC-Rio with data from INMET and IBGE, 2023
Finally, Figure 11 shows the relationship between climate shocks and the total unemployment rate[13] among the population aged 18 years or over.[14] It shows that increased drought is associated with higher unemployment in the Caatinga municipalities. Again, the graph shows that the increase in the index is tied to a 20% increase in the unemployment rate.
As such, considering the relationship between climate shocks and the different life dimensions of family farmers, this analysis identifies that a social dimension is key to designing policies aimed at increasing the resilience of Caatinga producers. Social policy turns out to be an essential complementary component, considering the economic barriers to accessing resilient inputs and techniques, as well as the short- and long-term impacts on farmers’ quality of life.
Figure 11. Relationship between Unemployment Rate and Aridity Index
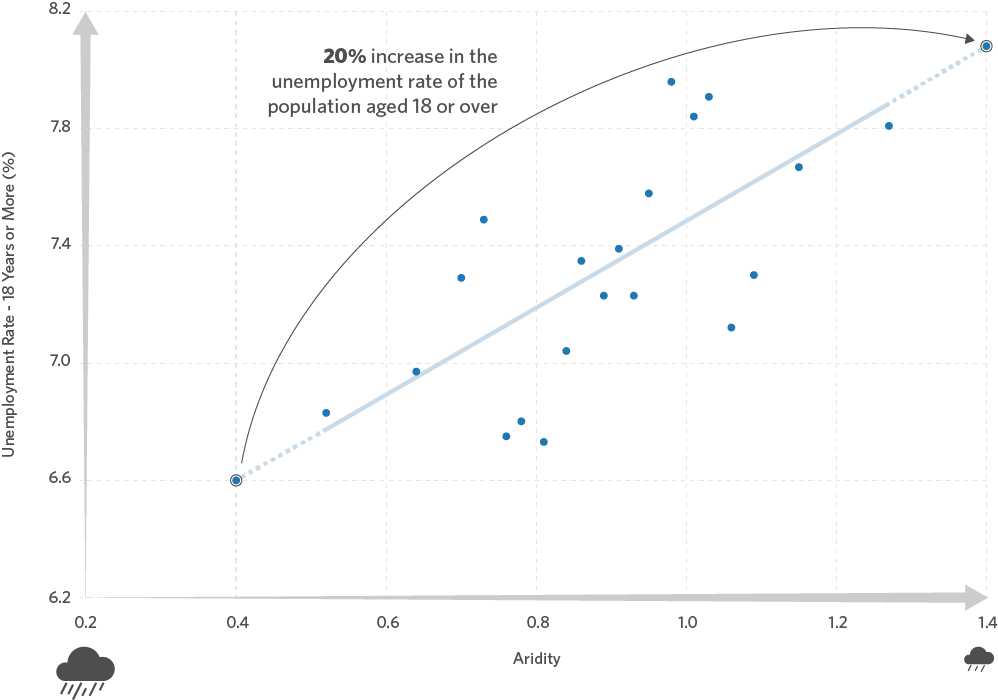
Note: Observations are at county-year level and cover the years 2000 and 2010. Aridity data refer to the log of the average aridity index for the last three years of each period under analysis. All regressions include year and municipality fixed effects. Standard errors are clustered at the municipal level.
Source: CPI/PUC-Rio with data from INMET and Census/IBGE, 2023
Conclusion
With low agricultural productivity and high socioeconomic vulnerability, the Caatinga is a region highly vulnerable to the impacts of climate change. By assessing the climate risk to which rural producers in the region are exposed, this report recommends that special attention be paid to family farmers, the group whose livelihoods are most vulnerable in the face of extreme weather events. The municipalities with the highest numbers of family farmers have experienced the greatest productivity losses in cattle and temporary crop production in the last three decades following episodes of severe drought.
In addition to production vulnerability, the Caatinga’s socioeconomic vulnerability adds an important dimension to the debate. Analyses highlights that extreme weather events not only affect agricultural production in the short term but can also generate long-term effects, lowering levels of education and health and driving up poverty rates.
Advancing a rural just transition agenda in the Caatinga involves the promotion of policies that encourage and facilitate the adoption of technologies that boost the transition to low-carbon agriculture. However, given the challenges outlined in this report, the agenda must also incorporate policies focused on increasing the resilience and adaptability of producers who are more exposed to climate shocks –— particularly family farmers. This approach must also include a social component in the design of public policies aimed at producers in the region. The failure to incorporate policies that promote social development in the face of climate change could have grave consequences, generating severe long-term consequences and further exacerbating social inequalities.
References
Albert, Christoph, Paula Bustos, and Jacopo Ponticelli. “The Effects of Climate Change on Labor and Capital Reallocation”. National Bureau of Economic Research (2021). bit.ly/3N0SiVh.
Alderman, Harold, Jere R. Behrman, Victor Lavy, and Rekha Menon. “Child Health and School Enrollment: A Longitudinal Analysis”. The Journal of Human Resources 36, no. 1 (2001): 185-205. bit.ly/46uUBYm.
Alderman, Harold, John Hoddinott, and Bill Kinsey. “Long term consequences of early childhood malnutrition”. Oxford Economic Papers 58, no. 3 (2006): 450–474. bit.ly/3PpSbUE.
Arora, Vivek K. “The use of the aridity index to assess climate change effect on annual runoff”. Journal of Hydrology 265, no. 1-4 (2002): 164-177. bit.ly/3opJMpm.
Assad, E.D., and Magalhães, A. R. (eds.). PBMC: Impactos, vulnerabilidades e adaptação às mudanças climáticas. Contribuição do Grupo de Trabalho 2 do Painel Brasileiro de Mudanças Climáticas ao Primeiro Relatório da Avaliação Nacional sobre Mudanças Climáticas. Rio de Janeiro: COPPE, 2014. bit.ly/3oSqZTF.
Brito, S. S. B., A. P. M. A. Cunha, C. C. Cunningham, R. C. Alvalá, J. A. Marengo, and M. A. Carvalho. “Frequency, duration, and severity of drought in the semiarid Northeast Brazil region”. International Journal of Climatology 38, no. 2 (2018): 517-529. bit.ly/3NdiNXt.
Cavalcanti, Francisco. “Voters Sometimes Provide the Wrong Incentives: The Lesson of the Brazilian Drought Industry”. Munich Personal RePEc Archive, 2018. bit.ly/3oVJxCp.
Dai, Aiguo. “Increasing drought under global warming in observations and models”. Nature Climate Change 3 (2013): 52-58. bit.ly/43lhSK8.
de Albuquerque, Amanda, Juliano Assunção, Pablo Castro, Natalie Hoover El Rashidy, and Giovanna de Miranda. Agricultores Familiares da Caatinga e do Cerrado: Mapeamento para a Promoção de uma Transição Rural Justa no Brasil. Rio de Janeiro: Climate Policy Initiative, 2023. bit.ly/TransicaoJustaRural.
Do, Truong Lam, Trung Thanh Nguyen, and Ulrike Grote. ‘Livestock Production, Rural Poverty, and Perceived Shocks: Evidence from Panel Data for Vietnam”. The Journal of Development Studies 55, no. 1 (2017): 99-119. bit.ly/3PQBke7.
Domingues, Filipe. Desertificação atinge 13% do semiárido brasileiro e ameaça conservação da caatinga. G1. 2019. Access date: May 10, 2023. bit.ly/4347DsG.
Glewwe, Paul, Hanan Jacoby, and Elizabeth King. “Early Childhood Nutrition and Academic Achievement: A Longitudinal Analysis.” Journal of Public Economics 81, no. 3 (2001): 345-368. bit.ly/42VefcI.
Hidalgo, F. Daniel, Suresh Naidu, Simeon Nichter, and Neal Richardson. “Economic Determinants of Land Invasions”. The Review of Economics and Statistics 92, no. 3 (2010): 505-523. bit.ly/3NnFqax.
Instituto Brasileiro de Geografia e Estatística (IBGE). 2010 Census. 2010. Access date: March 10, 2023. bit.ly/3sqhZTl.
Instituto Brasileiro de Geografia e Estatística (IBGE). PAM – Produção Agrícola Municipal. 2020. Access date: March 10, 2023. bit.ly/3NEZkz7.
Instituto Brasileiro de Geografia e Estatística (IBGE). PPM – Pesquisa da Pecuária Municipal. 2019. Access date: March 10, 2023. bit.ly/3Pmd2s0.
Instituto Brasileiro de Geografia e Estatística (IBGE). Desemprego. 2023. Access date: June 20, 2023. bit.ly/3NqBki2.
Maccini, Sharon, and Dean Yang. “Under the Weather: Health, Schooling, and Economic Consequences of Early-Life Rainfall”. American Economic Review 99, no. 3 (2009): 1006-1026. bit.ly/46gQTRX.
Marengo, Jose A., Marcelo V. Galdos, Andrew Challinor, Ana Paula Cunha, Fabio R. Marin et al. “Drought in Northeast Brazil: A review of agricultural and policy adaptation options for food security”. Climate Resilience and Sustainability 1, no. 1 (2022). bit.ly/3NbiE6W.
Masson-Delmotte, Valérie et al. (eds). IPCC: Climate Change 2021: The Physical Science Basis. Contribution of Working Group I to the Sixth Assessment Report of the Intergovernmental Panel on Climate Change. Cambridge, New York: Cambridge University Press, 2021. bit.ly/42pPYLR.
MAPBIOMAS v. 5.0. Sistema de Validação e Refinamento de Alertas de Desmatamento com Imagens de Alta Resolução. 2020. Access date: January 15, 2023. bit.ly/mapbiomas.
Ministério da Mulher, Família e dos Direitos Humanos. Fatos e Números: Famílias e Filhos no Brasil. Observatório Nacional da Família, 2021. bit.ly/3CcHY6d.
Rocha, Rudi, and Rodrigo Soares. “Water scarcity and birth outcomes in the Brazilian semiarid.” Journal of Development Economics 112 (2015): 72-91. bit.ly/42rTQvZ.
Seddon, Alistair W. R., Marc Macias-Fauria, Peter R. Long, David Benz, and Kathy J. Willis. “Sensitivity of global terrestrial ecosystems to climate variability”. Nature 531 (2016): 229-232. bit.ly/42jBltu.
Sistema de Estimativa de Emissão de Gases (SEEG). Emissões Totais. 2021. Access date: February 10, 2023. bit.ly/3JneYh3.
The authors would like to thank Priscila Souza for methodological supervision, Natalie Hoover El Rashidi, Giovanna de Miranda and Camila Calado for the editing and revision of the text and Meyrele Nascimento for formatting and graphic design.
[1] The notion of climate risk comprises the possible negative impacts of climate events on people’s lives. In this study, the concept is used to identify levels of vulnerability and exposure of rural producers in the Caatinga to the negative impacts of climate change.
[2] This report identifies family farmers as family producers who practice activities in rural areas, simultaneously meeting the following requirements: do not hold, in any capacity, an area larger than four fiscal modules; predominantly use the family’s own labor for economic activities; and have a minimum percentage of family income originated from farm activities.
[3] The aridity index is calculated by the equation: AIm,t =  where t indexes the year, j indexes the month of the year, t and m indexes in the municipality.
[4] For more information on calculating the index, see: SPEI. About the SPEI. nd. Access date: February 10, 2023. bit.ly/3BZuTx2.
[5] Pasture area data from MAPBIOMAS v.5.0. (2020) were used to calculate cattle productivity.
[6] The notion of climate shocks includes various adverse weather-related events, such as droughts, excessive rainfall, floods and storms (Do, Nguyen, and Grote 2017). Climate change increases exposure to climate shocks.
[7] In this study, the sensitivity graphs show the result of an econometric regression where the dependent variable is the productivity log and the independent variable is the aridity index log, with fixed-effect controls for municipality and year. In order to facilitate the graphic’s understanding, the municipalities were aggregated into a total of 20 bins of equal size, and the Y axis was turned back into its absolute value via an exponential function.
[8] The “people in poverty” classification refers to the proportion of individuals with per capita household income equal to or less than R$ 140,00 a month, considering values for August 2010. The universe of individuals is limited to those who live in permanent private households (IBGE 2010).
[9] The total number of families was estimated based on the total population of the Caatinga divided by 3.07, which is the average size of a Brazilian family according to the 2017-2018 Consumer Expenditure Survey (Pesquisa de Orçamentos Familiares – POF/IBGE) ( Ministério da Mulher, Família e dos Direitos Humanos 2021).
[10] Per capita household income data refer to individuals living in private households, considering values from August 1, 2010 (IBGE 2010).
[11] The Gini index measures the existing degree of inequality in the distribution of individuals, according to per capita household income. Its value ranges from zero, when there is no inequality (i.e., the per capita household income of all individuals has the same value), to one, when there is maximum inequality (only one individual has all the income). The universe of individuals is limited to those living in permanent private households.
[12] The “delay rate for primary education” classification refers to the percentage of the population aged between six and 14 who attend primary school with an age-grade gap of one year (IBGE 2010).
[13] The IBGE defines the unemployment rate as the percentage of people in the workforce who are unemployed (IBGE 2023).
[14] The data refer to the percentage of the economically active population (EAP) in this age group that was unemployed, i.e., not employed in the week prior to the date of the Census, but who had looked for work during the month prior to the date of this survey (IBGE 2010).
