Introduction
In order to mobilize international resources to further Brazil’s climate agenda, the Brazilian government has adopted a series of initiatives. These include the Brazil Climate and Ecological Transformation Investment Platform (Plataforma Brasil de Investimentos Climáticos e para Transformação Ecológica – BIP), the Foreign Private Capital Mobilization and Currency Hedging Programme (Programa de Mobilização de Capital Privado Externo e de Proteção Cambial – Eco Invest Brasil).[1],[2] The country has also issued sustainable sovereign bonds and resumed the Amazon Fund.[3],[4] The common objective of these initiatives is to leverage international resources for financing climate projects and to create favorable investment conditions to drive foreign private capital to projects aligned with the national climate agenda.
Foreign capital plays a crucial role in complementing domestic financial sources, both public and private, necessary for the transition to a low-carbon economy. It can help, for example, to reduce the cost of capital needed to implement climate projects, catalyze private domestic investment by reducing risks, as well as finance the development of capacities to create more favorable conditions for local climate investment and establish investment benchmarks for Brazilian financial institutions.[5]
Quantifying the international climate finance flowing into Brazil can establish a baseline to track trends in climate finance over time. It can also shed light on the impact of government initiatives on these finance flows and identify areas to which it is desirable to attract investment and better target existing resources, including scarce public and concessional finance. This exercise can also inform ways to improve economic incentives and enabling conditions that will facilitate the mobilization of international capital for the country’s climate transition.
This report aims to establish this baseline of international climate finance flows to Brazil. Researchers from Climate Policy Initiative/Pontifical Catholic University of Rio de Janeiro (CPI/PUC-RIO) analyzed and quantified the financial flows of international origin destined for climate action in Brazil between 2021 and 2022, comparing them with figures from 2019 and 2020, to identify growth trends. The work identifies the region of origin of the financial flows, the type of institution that allocated them, the financing instruments used, the sectors benefiting, and the climate objectives.
The years 2021 and 2022 were marked by the economic shifts following the COVID-19 pandemic, which led to increased inflation and financial costs worldwide. At the same time, President Jair Bolsonaro’s administration distanced the country from international climate policy discussions.[6] Despite this scenario, the figures outlined in this report indicate positive signs for the trajectory of international climate finance in Brazil.
When comparing Brazil’s growth in international climate finance flows with global trends during the same period, it becomes apparent that Brazil’s trajectory aligns with the global growth trend, albeit with greater intensity. While international climate finance grew by 28% in all regions of the globe (from US$ 158 billion to US$ 203 billion) between the 2019–2020 and 2021–2022 biennia, international climate finance for Brazil grew by 84% in the same period, reaching US$ 5.1 billion per year in 2021–2022 (Naran et al. 2024).
This growth was led by the energy sector, with a focus on financing solar and wind energy generation projects. While global climate finance for energy systems increased by 53% during the period (from US$ 335.5 billion to US$ 514.5 billion), international clean energy finance in Brazil rose by 165%.
Understanding the current landscape of international climate finance is a fundamental step toward increasing its scale and effectiveness. By establishing this baseline, this report aims to provide concrete insights to guide, adjust, and enhance the effectiveness of domestic measures and initiatives, calibrate the actions of public and private actors, and improve the conditions that attract foreign investment. However, to have a complete picture of climate finance in Brazil, it is essential to also consider domestic flows, which represent the main source of finance in many emerging countries. Moving in this direction will be the focus of the next stage of CPI/PUC-RIO’s climate finance research agenda.
Key Findings
International climate finance for Brazil reached US$ 5.1 billion per year in 2021–2022, an increase of 84% (US$ 2.2 billion/year) compared to 2019–2020.
Western Europe, led by France, was the main provider of international climate finance for Brazil in 2021–2022, with the region accounting for 50% of the tracked resources (US$ 2.6 billion/year). Public sources provided 52% of Europe’s total, and private sources provided 48%.
In 2021–2022, 58% of international climate finance came from public institutions (US$ 2.9 billion/year). Multilateral Development Finance Institutions (DFIs) mobilized 71% of international public finance (US$ 2.1 billion/year), 97% of which was through credit provided at commercial rates.
International private climate finance mobilized 42% of the total tracked in 2021–2022 (US$ 2.1 billion/year), more than four times the amount registered in 2019–2020. Commercial Financial Institutions (FIs) led this growth, providing 55% of private finance (US$ 1.2 billion) in 2021–2022, followed by corporations with 41% (US$ 875 million).
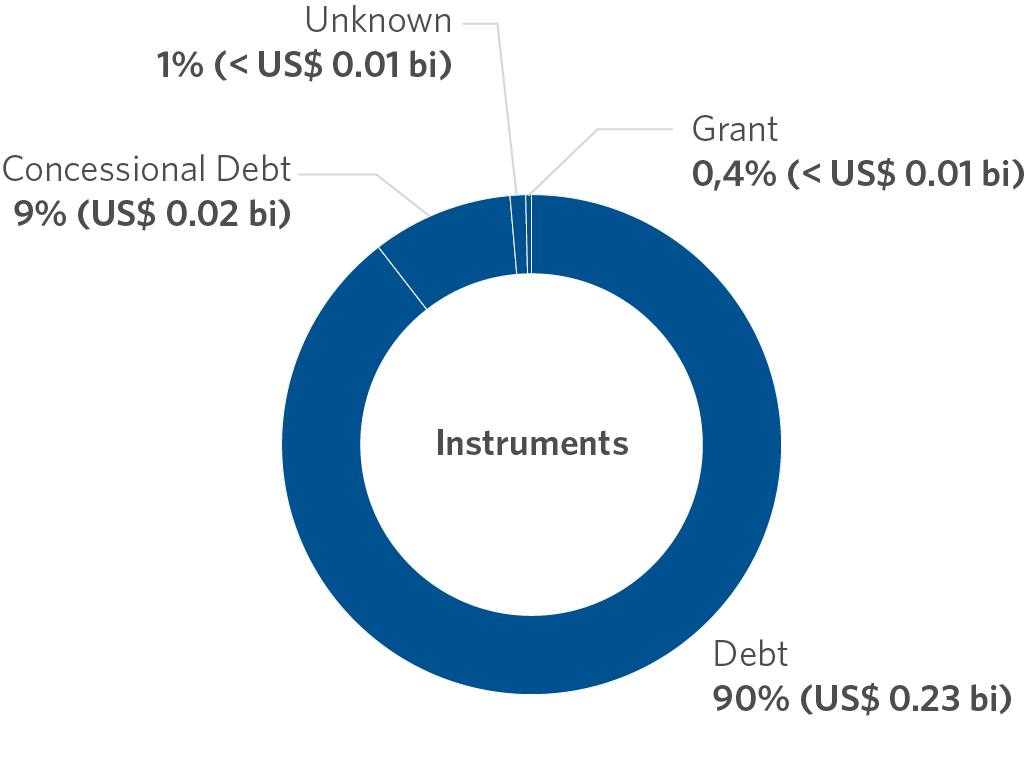
Commercial financing instruments represented 89% of the flows tracked in 2021–2022 (US$ 4.5 billion/year), including debt (65%) and equity (24%) increased by 168% compared to the 2019–2020 period. During the same period, funding from grants and concessional debt decreased by 43%.
Finance with an exclusive climate mitigation objective made up 80% of the total tracked in 2021–2022 (US$ 4.1 billion/year). Projects with some adaptation component (including multiple objectives) accounted for the remaining 20% (US$ 992 million/year). Adaptation finance had a greater concentration in the Agriculture, Forestry, Other Land Uses, and Fisheries (AFOLU), where 79% of finance included an adaptation component, as well as water and sanitation (65%).
The energy sector accounted for 53% (US$ 2.7 billion/year) of the resources tracked in 2021–2022 and was responsible for 72% of the total growth in international finance (US$ 1.6 billion/year) between 2019–2020 and 2021–2022. Investments in solar generation accounted for 57% (US$ 1.5 billion/year) of energy climate finance, and wind generation for 24% (US$ 638 million/year).
The AFOLU sector, which is responsible for almost three-quarters of Brazil’s Greenhouse Gas (GHG) emissions, received only 11% of international climate finance (US$ 559 million/year). The forestry subsector represented only 2% (US$ 119 million/year) of international finance, but 41% (US$ 63 million/year) of all tracked international grants in 2021–2022.
Methodology
This report quantified financial flows from international sources to Brazil with climate action components in 2021–2022. This methodology builds on CPI’s institutional experience in tracking global, regional, and national climate finance, which has been developed over more than ten years through the Global Landscape of Climate Finance (GLCF) and is continually being refined (Naran et al., 2024).
Climate finance refers to capital flows that have direct or indirect effects on GHG mitigation, or that support adaptation to climate change (Chiavari et al. 2024). Flows can also be directed toward activities that offer dual benefits, contributing to both mitigation and adaptation (UNFCCC nd). In this report, “international finance” refers to climate finance flows originating outside Brazil or from international institutions.[7]
This tracking exercise is limited to quantifying primary capital flows of international origin directed toward interventions that bring direct or indirect benefits for GHG mitigation or climate adaptation. These flows include support for capacity-building measures as well as policy development and implementation. This exercise does not include: (i) secondary market transactions; (ii) economic subsidies or public grants whose main function is to reimburse investment costs; (iii) investments in manufacturing, sales, and Research and Development (R&D); (iv) fossil fuel-based energy generation; and (v) energy efficiency, when based on improving the performance of fossil fuels.
This publication tracked international climate finance to Brazil for the years 2021 and 2022, comparing these flows with figures from 2019 and 2020, in order to identify trends. The results are presented as two-year averages—2021–2022 and 2019–2020—to mitigate the impact of short-term fluctuations and variation in data availability. This enables a more comprehensive assessment of financial flows, including activities with irregular data disclosure schedules.
The values presented are corrected for inflation against the US dollar. The financial flows analyzed are adjusted by the Consumer Price Index, with reference to December 2022 (FRED 2025).
Appendix I details the databases used to track international climate flows to Brazil, expanded from the dataset used in CPI’s GLCF 2024 (Naran et al. 2024). The selected financial flows were originated in other countries and designated for Brazil — including those that were transregional.[8] In line with CPI’s climate finance tracking methodology, measures were taken to maximize the granularity of the data and to avoid double-counting.
Figure 1 illustrates the organization of international financial flows in this report. Data is presented according to origins of funds, sources of funds, financial instruments used, climate objectives, and sectors. Appendix II presents a detailed list of sectors, subsectors, and solutions considered in this analysis.[9] Appendix III lists the countries included in each of the origin regions. The definitions of each category and subcategory shown in Figure 1 are provided in Appendix IV. Appendix V details the methodology used for data processing.
Figure 1. International Climate Finance Ecosystem for Brazil, 2021–2022
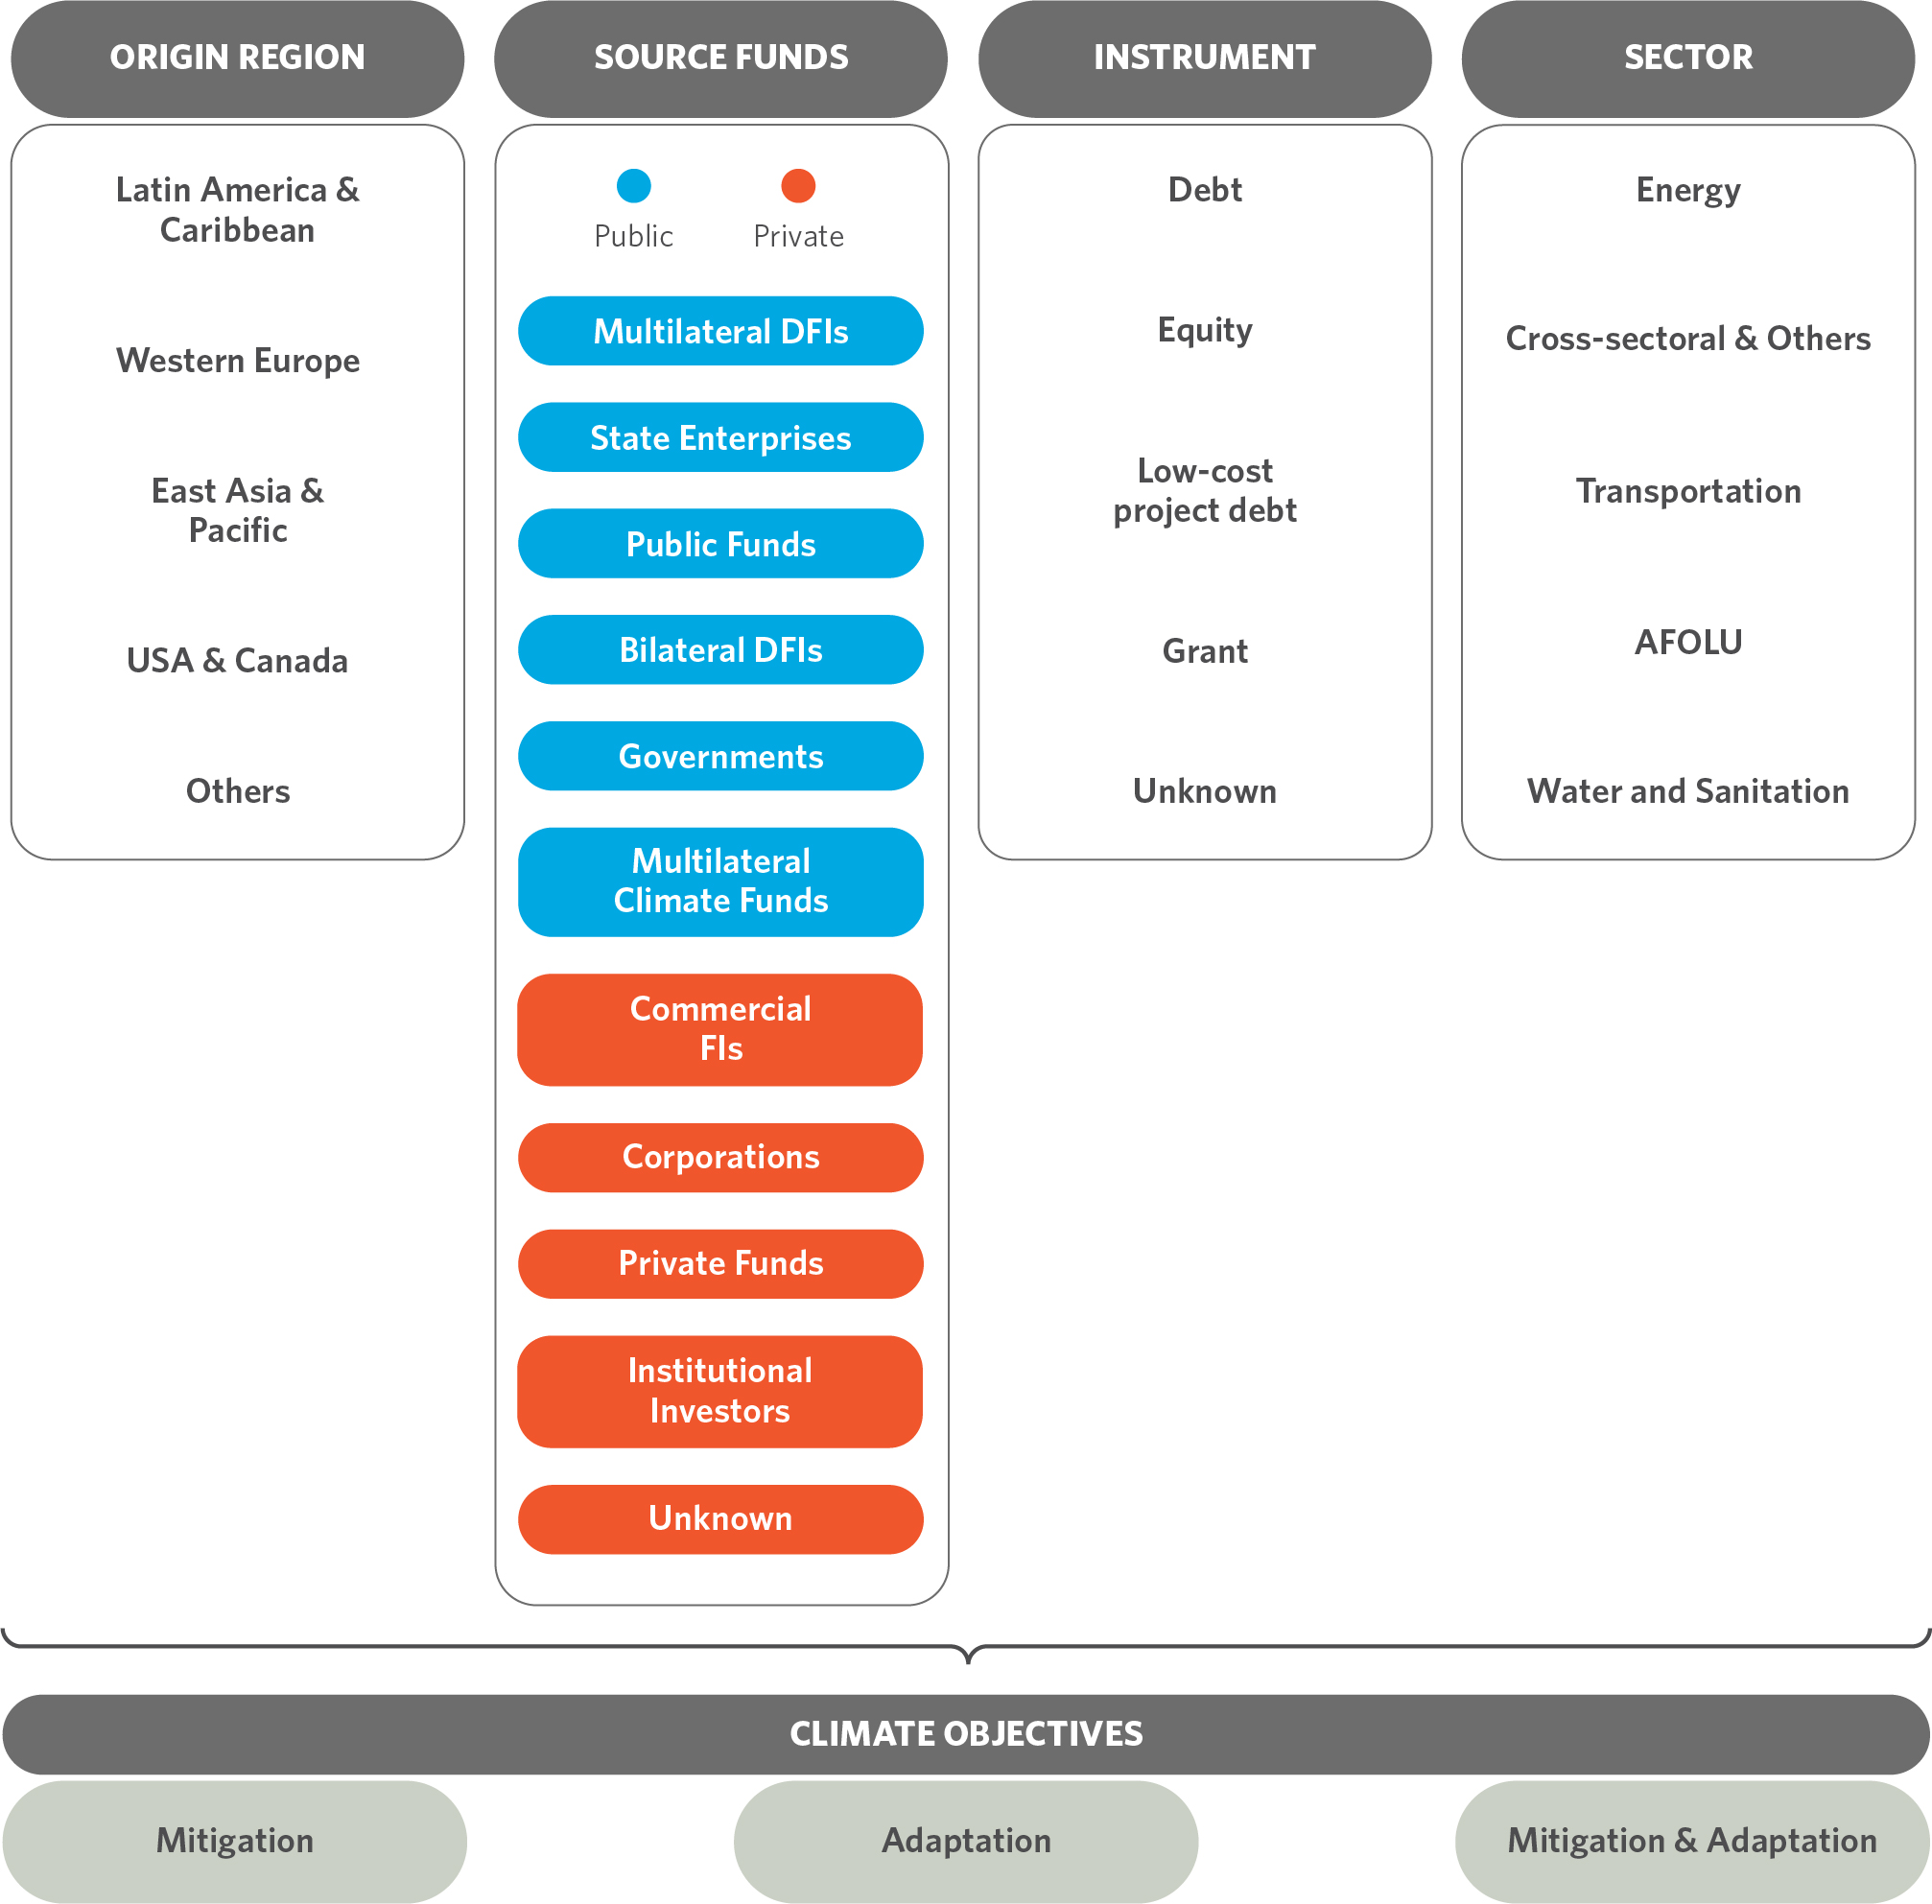
Note: The values classified as “Unknown” refer to financial flows for which it was not possible to identify the financial actor responsible and/or the financial instrument used, due to limitations or absence of available data.
Source: CPI/PUC-RIO, 2025
International Climate Finance for Brazil
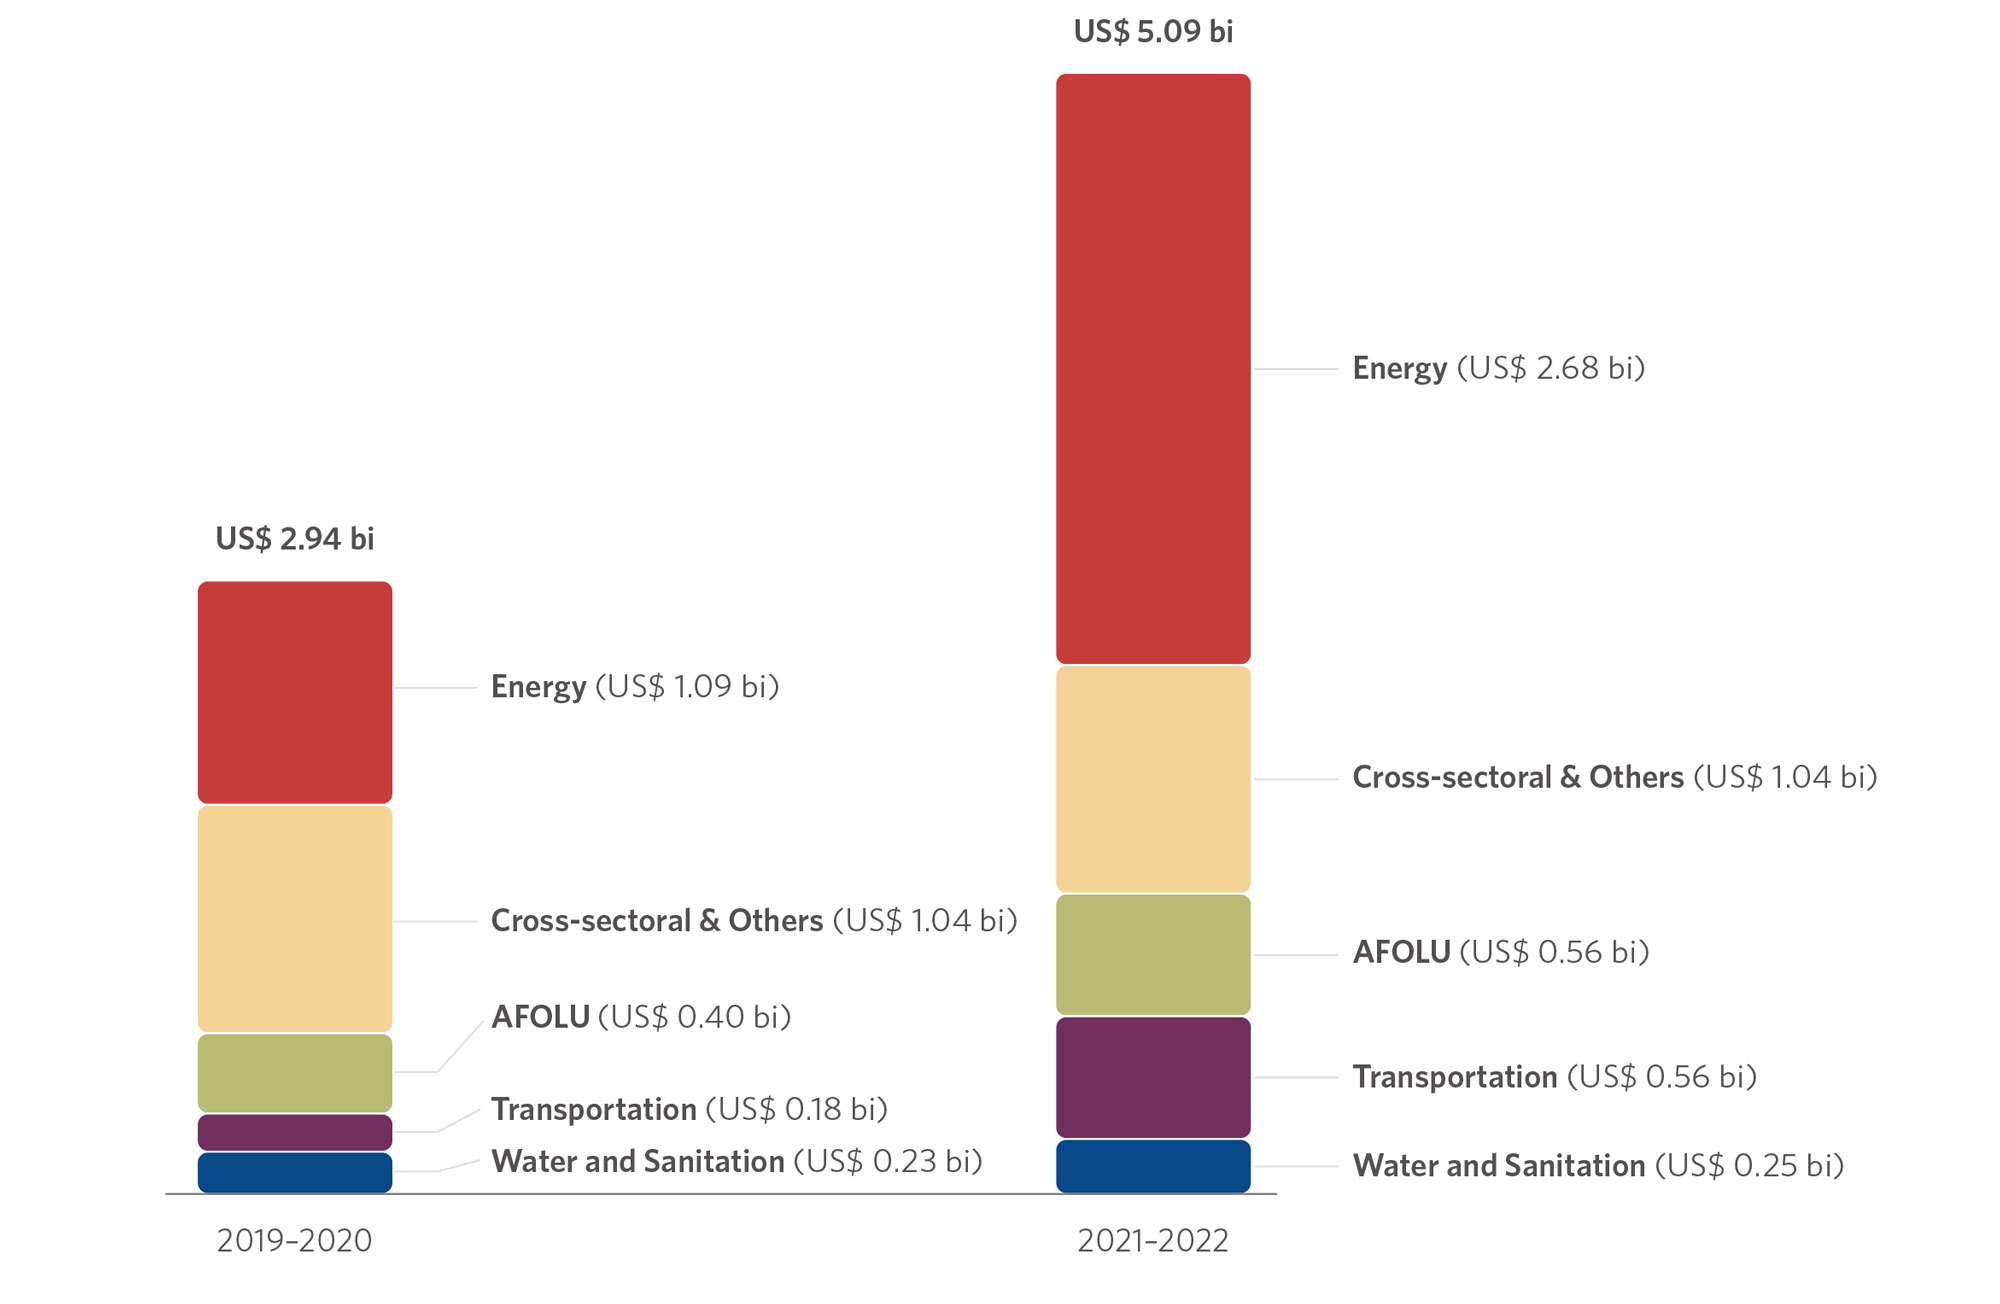
International climate finance for Brazil reached an average of US$ 5.1 billion per year in 2021–2022, as detailed in Figure 2, which shows the regions of origin, sources of funds, financial instruments used, the sectors benefiting, and the climate objectives.[10],[11]
The tracked value of international climate finance for Brazil in 2021–2022 saw an increase of 84% compared to 2019–2020, when investments totaled US$ 2.9 billion/year. Over the same period, international climate finance increased by 28% in all regions of the globe, from US$ 158 billion/year to US$ 203 billion/year (Buchner et al. 2023). Other emerging economies experienced growth closer to the global average: in India, international finance for mitigation increased by 36%, and for adaptation by 19% (Chakravarty et al. 2024).
Region of Origin
Figure 3 shows the top ten countries that allocated international climate finance to Brazil in 2021–2022. Western Europe was the largest regional contributor of international climate finance for Brazil, providing 50% (US$ 2.6 billion/year) of tracked resources. Of this amount, public actors in the region provided 52% (US$ 1.3 billion/year), and private actors provided 48% (US$ 1.2 billion/year).
France was the single largest source of international climate finance earmarked for Brazil in 2021–2022, accounting for 13% (US$ 674 million/year) of the total tracked. Of this amount, 47% came from French bilateral DFIs (US$ 317 million/year) and 26% from commercial FIs (US$ 179 million/year).
Spain and the United Kingdom were the third and fourth most important countries, accounting for 10% and 9% each of total international finance (respectively, US$ 511 million/year and US$ 487 million/year). Private funding accounted for most of the resources originating in these countries (74% and 91%, respectively), which provided a significant portion of total private finance (17% and 21%).
Figure 2. International Climate Finance for Brazil
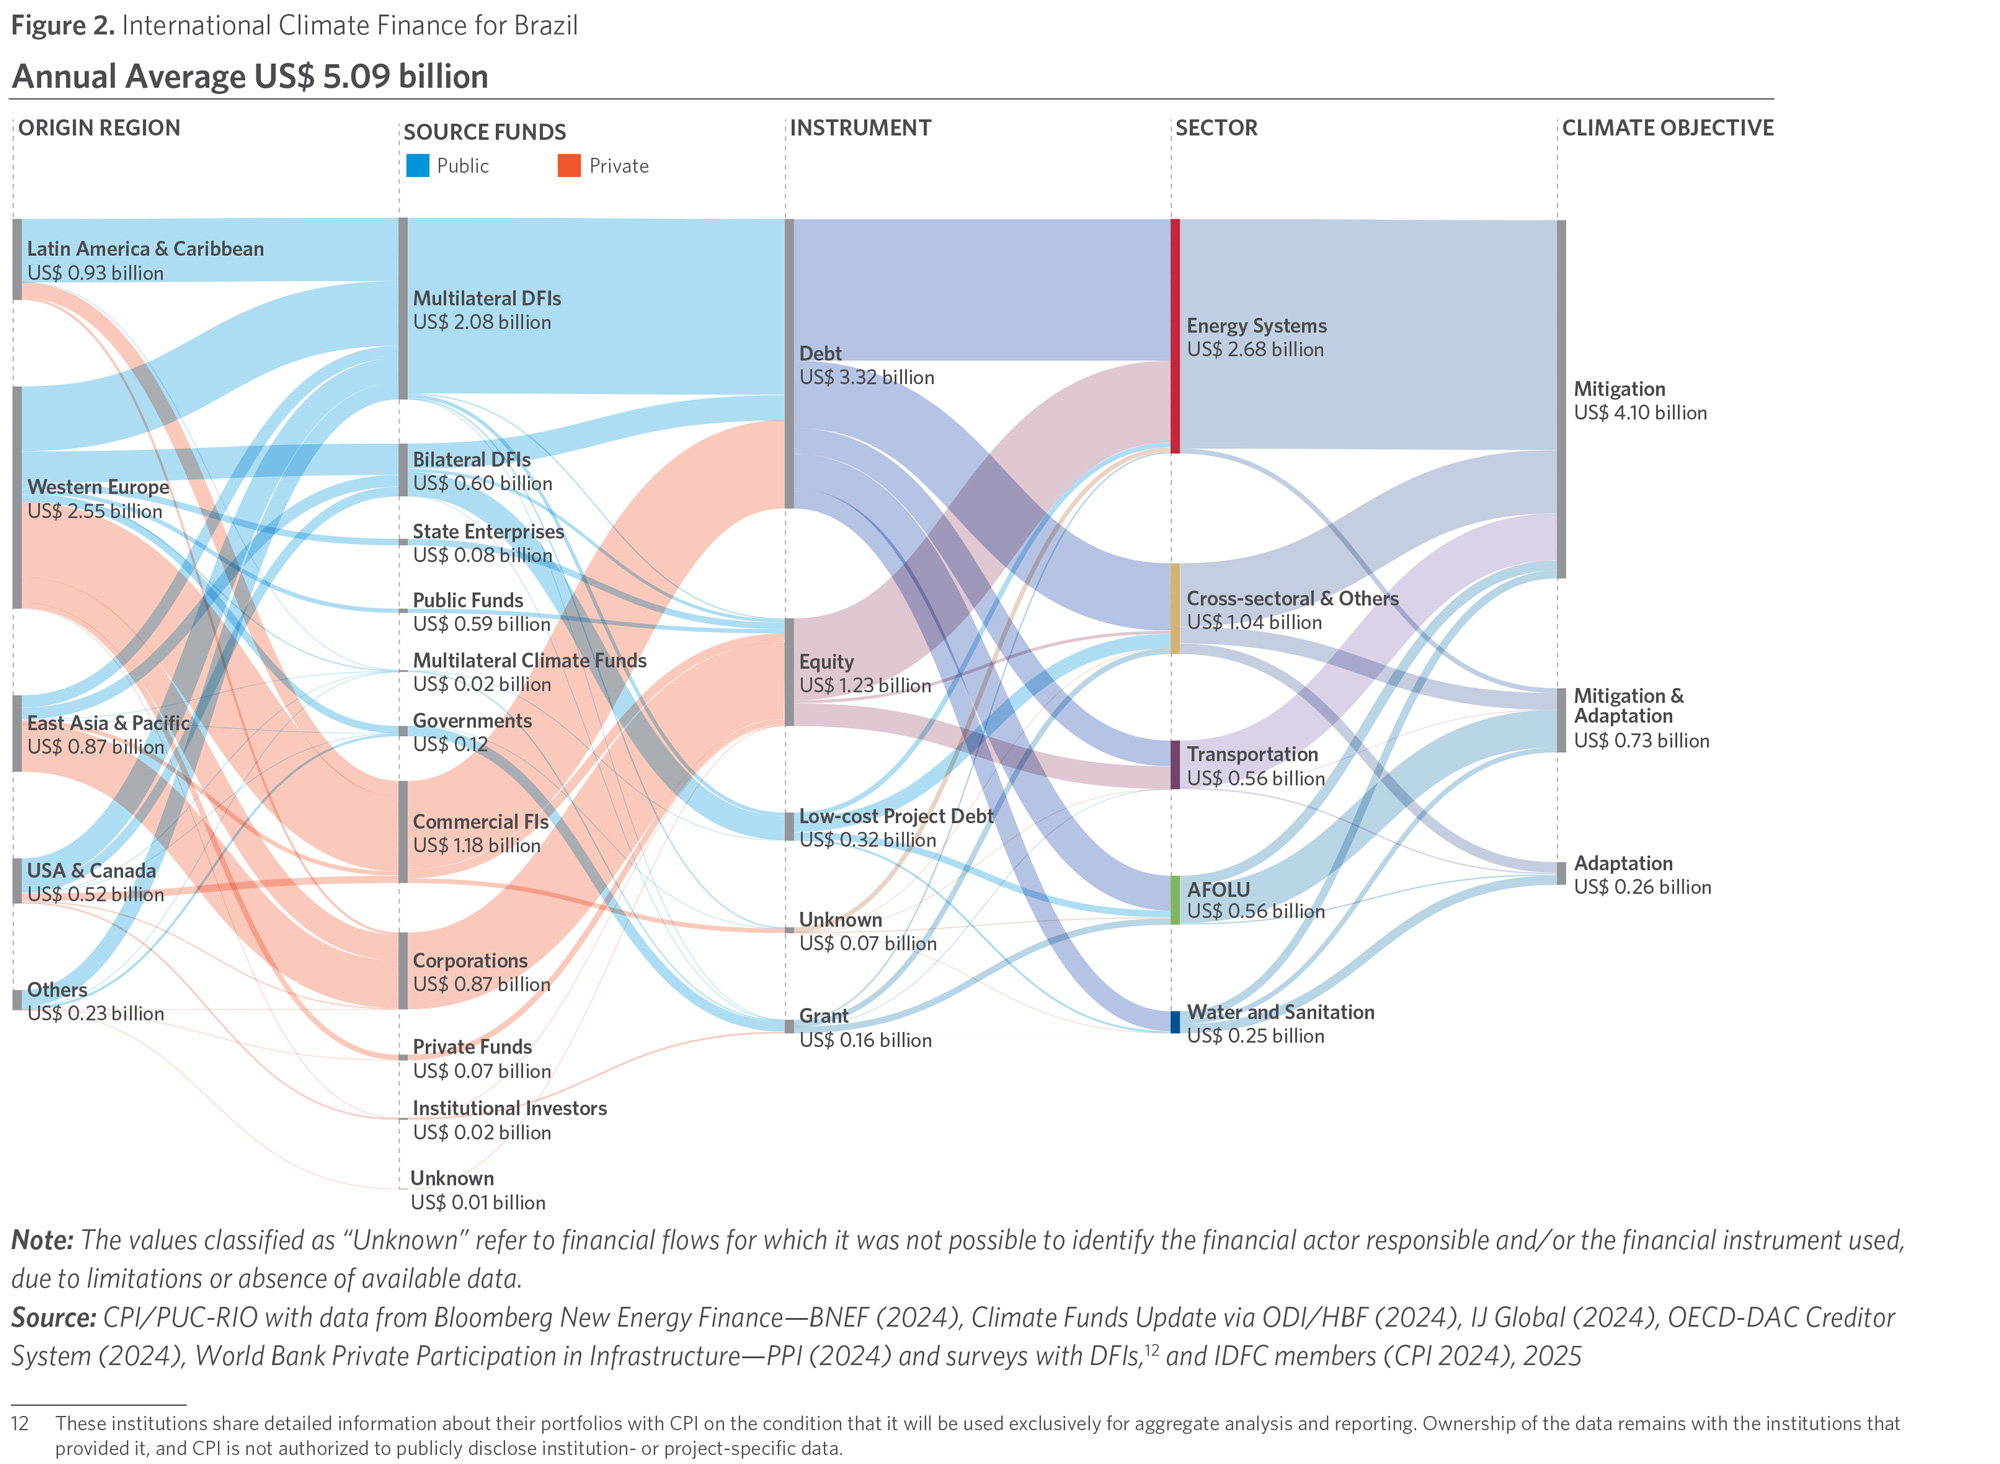
Note: The values classified as “Unknown” refer to financial flows for which it was not possible to identify the financial actor responsible and/or the financial instrument used, due to limitations or absence of available data.
Source: CPI/PUC-RIO with data from Bloomberg New Energy Finance—BNEF (2024), Climate Funds Update via ODI/HBF (2024), IJ Global (2024), OECD-DAC Creditor System (2024), World Bank Private Participation in Infrastructure—PPI (2024) and surveys with DFIs,[12] and IDFC members (CPI 2024), 2025
Figure 3. Top Ten Origins of International Flows to Brazil by Country and Region, 2021–2022
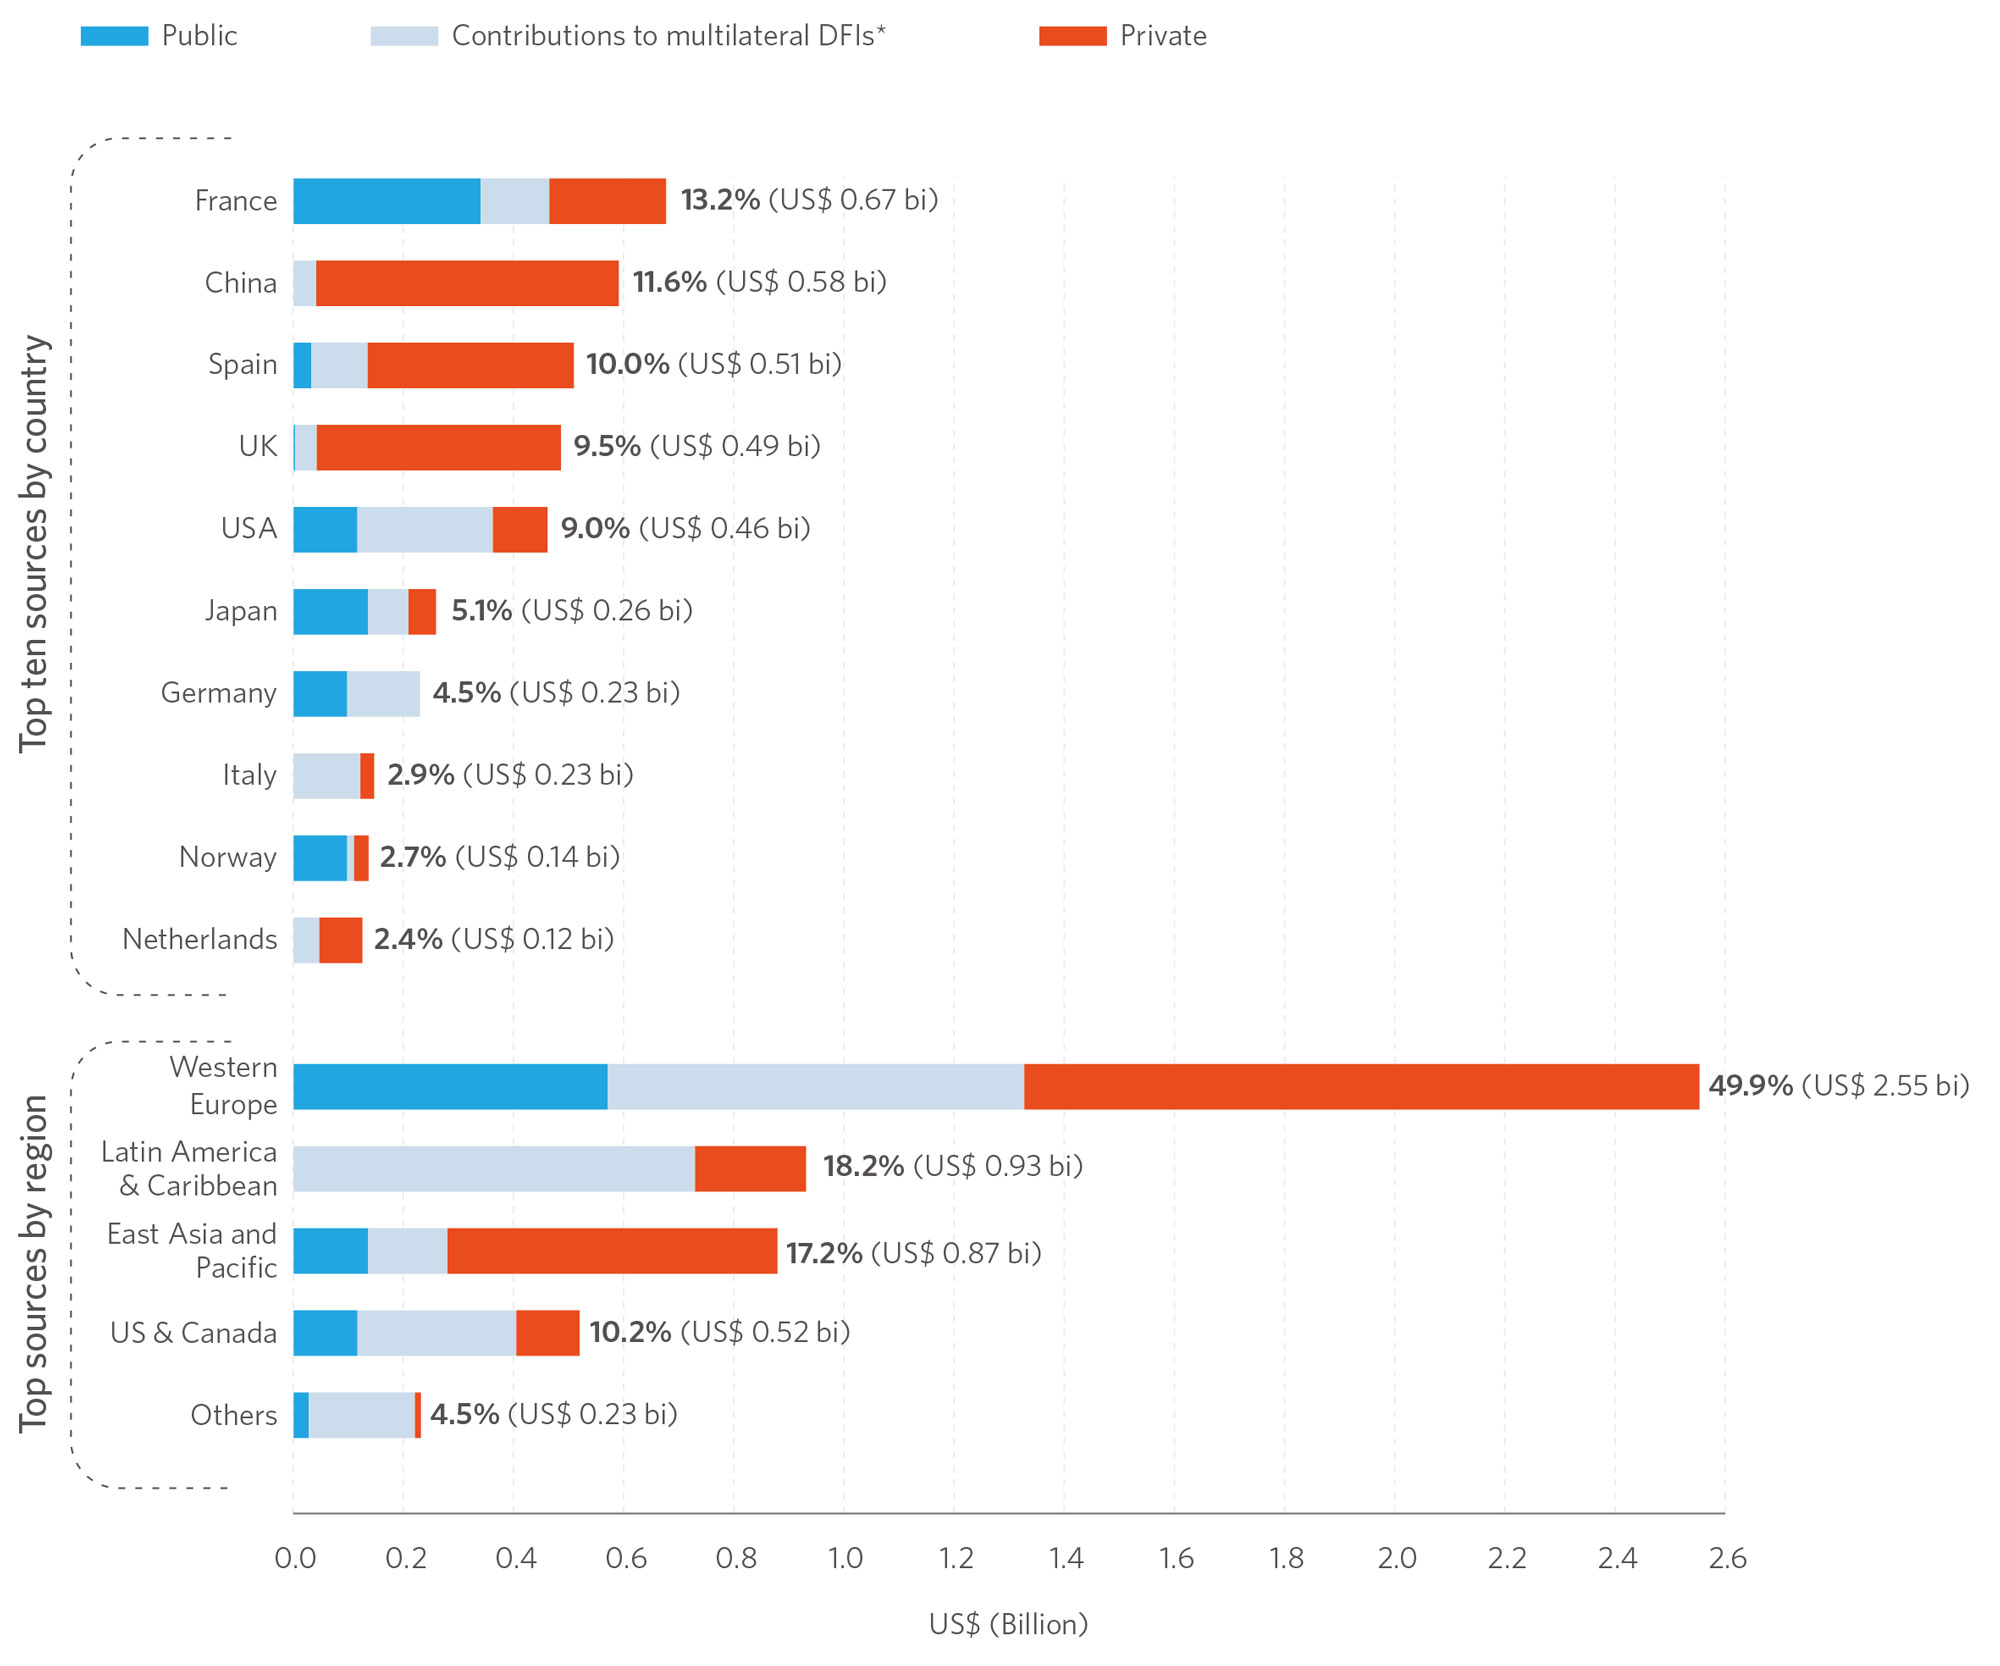
Source: CPI/PUC-RIO with data from BNEF (2024), Climate Funds Update via ODI/HBF (2024), IJ Global (2024), OECD-DAC Creditor System (2024), World Bank PPI (2024) and surveys with DFIs and IDFC members (CPI 2024), 2025
Climate finance from the United States accounted for 9% (US$ 458 million/year) of the total tracked, 78% of which came from public sources, with 52% channeled through contributions to multilateral DFIs.
The region of Latin America and Caribbean was responsible for 18% (US$ 926 million/year) of regional flows tracked in 2021–2022. Of the total, 78% (US$ 725 million/year) was mobilized by multilateral DFIs, such as the Development Bank of Latin America and the Caribbean (CAF) and the Inter-American Development Bank (IADB), with resources allocated to countries in the region according to their shareholding in these institutions. Commercial FIs mobilized 19% of the resources coming from the region (US$ 174 million/year), which were allocated exclusively to the energy sector.
Countries in East Asia and the Pacific collectively accounted for 17% (US$ 867 million/year) of the tracked flows in 2021–2022, with China accounting for 12% (US$ 581 million/year) of the total. The primary destination for Chinese funds was a project to install a 1,100 MW solar plant at the Port of Açu in Rio de Janeiro, financed by a private corporation based in Hong Kong and undertaken with a public Chinese engineering company. Japan, on the other hand, was responsible for 5% (US$ 256 million/year) of the flows tracked for Brazil, 81% of which was public funding.
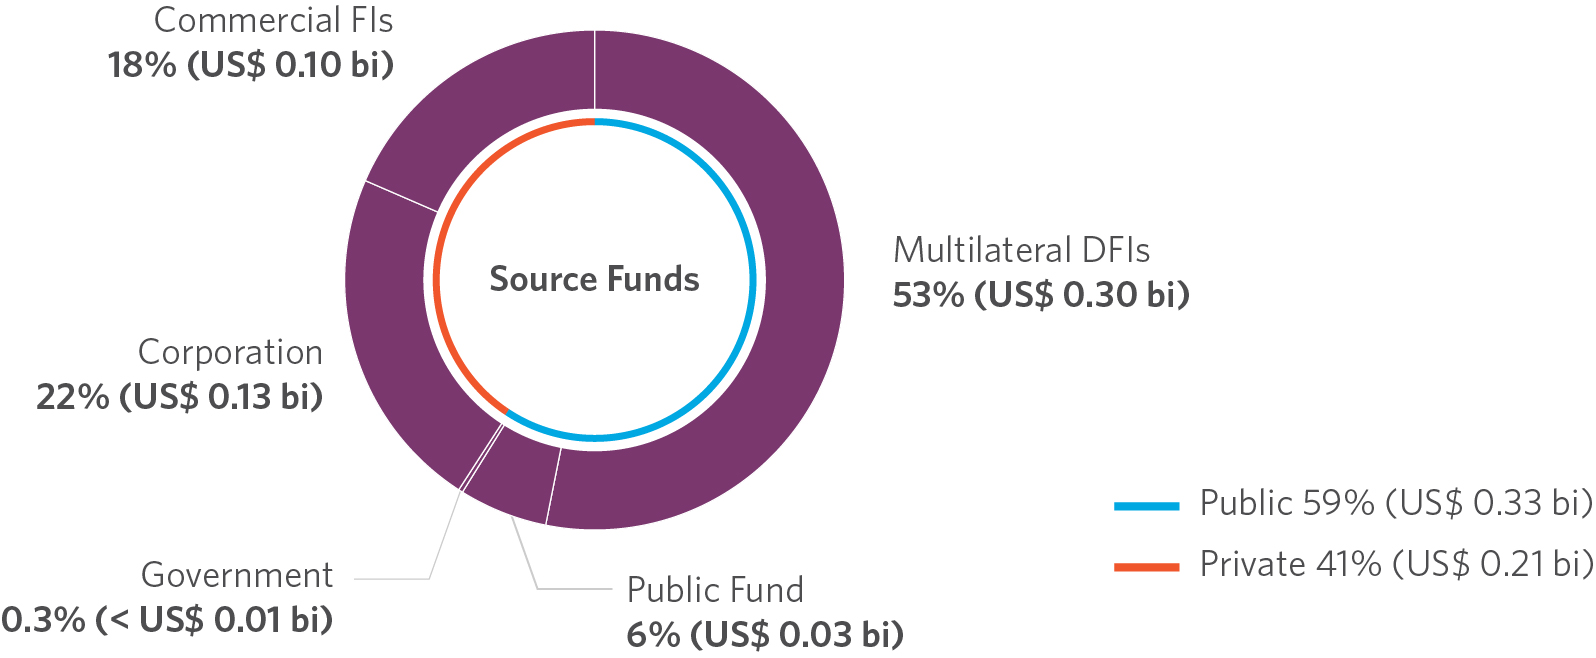
Sources of Funds
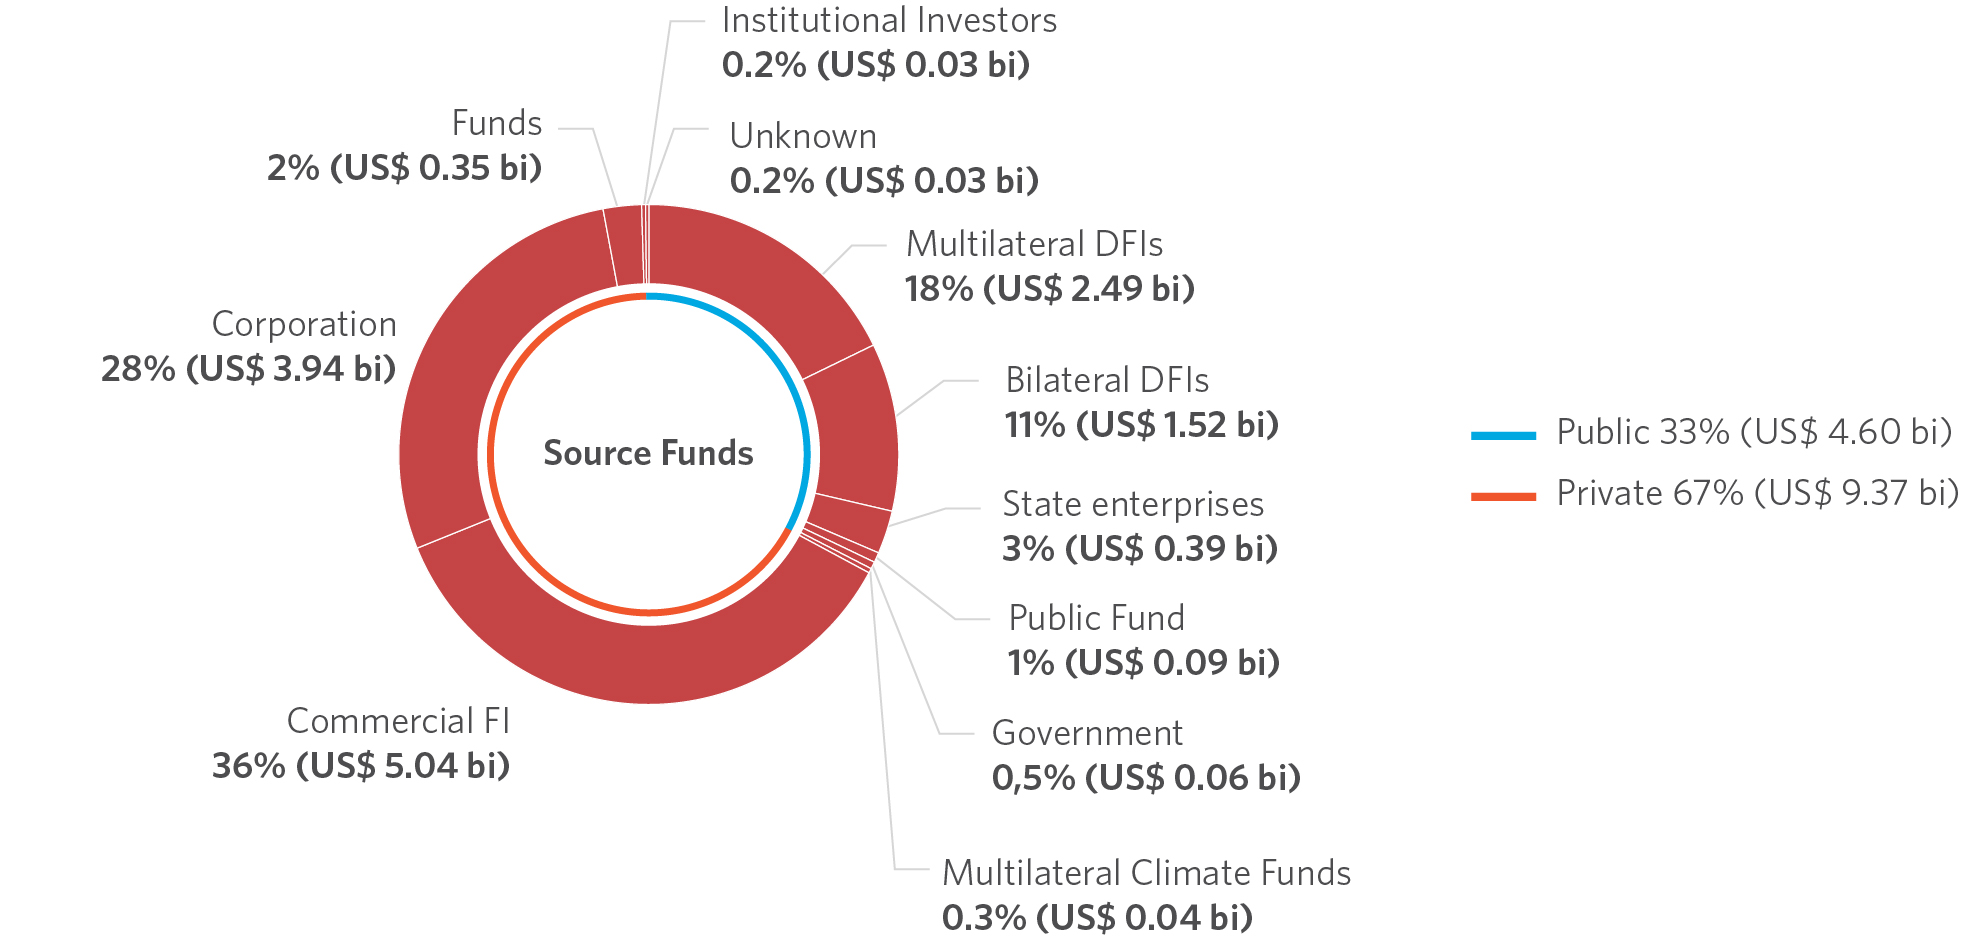
In 2021–2022, public sources accounted for 58% of international climate finance for Brazil (US$ 2.9 billion/year), up 30% since 2019–2020.
Multilateral DFIs were the main mobilizers of resources for the country, with US$ 2.1 billion/year, representing 41% of the total and 71% of public finance, 97% of which was through credit at commercial rates. The main institutions responsible for these flows were CAF and the IADB, each with 23% of the resources, and the European Investment Bank (EIB) with 22%, and IADB with 21%.
Bilateral DFI resources amounted to 20% of the public finance tracked (US$ 601 million/year).13 These investments originated in Western Europe (59%), East Asia and the Pacific (22%), and the United States and Canada (18%) and were divided between debt (45%) and concessional debt (45%), applied to projects in the energy sector (48%) as well as the “cross-sectoral and other” category (33%).
Multilateral climate funds provided only US$ 21 million/year in climate finance in 2021–2022, equivalent to 1% of the tracked public finance. This amount corresponded to only one-sixth of the multilateral climate funds financing in 2019–2020, when US$ 152 million/year was provided.[13]
Private international climate finance grew fourfold between 2019–2020 and 2021–2022, reaching 42% of the total tracked in 2021–2022 (US$ 2.1 billion/year). Private growth in the period was led by commercial FIs, which mobilized US$ 1.2 billion/year in 2021–2022, compared to US$ 88 million/year in the previous period, reaching 55% of total private finance. These institutions, represented by large international banks, mostly based in Western Europe (74%), concentrated their investments in the energy (83%), transport (9%), and water and sanitation (8%) sectors, mainly through credit projects (87%) and equity (9%).
Finance from corporations accounted for 41% of private finance in 2021–2022 (US$ 875 million/year) and was mostly applied to energy projects (86%) exclusively through equity investments (100%). Companies from East Asia accounted for 62% of all corporations’ investment, followed by those based in Western Europe (33%).
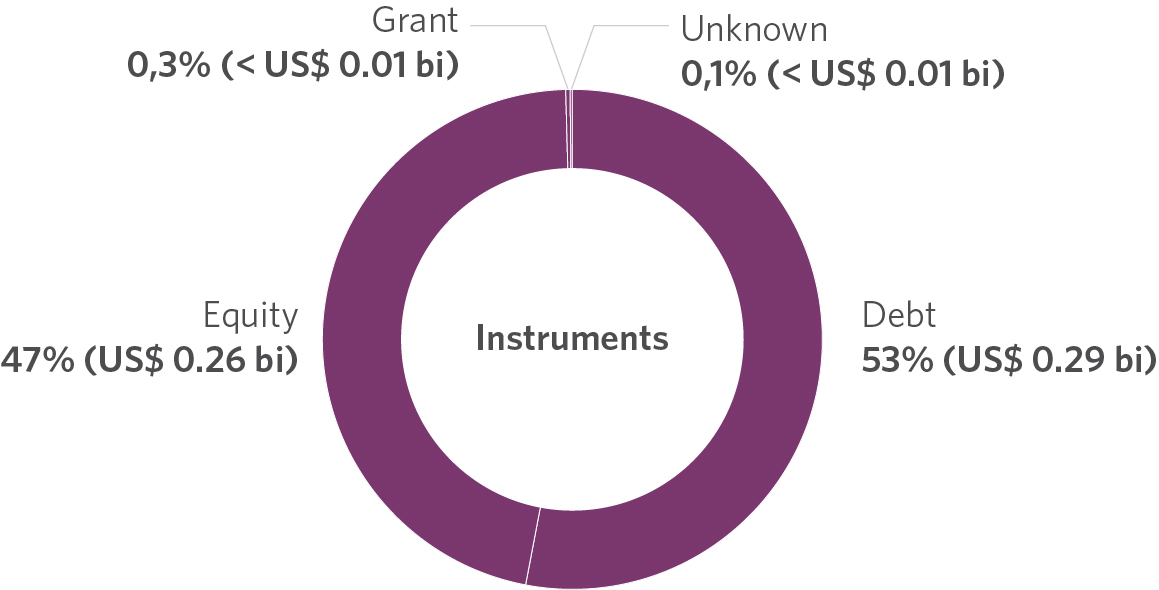
Financial Instruments
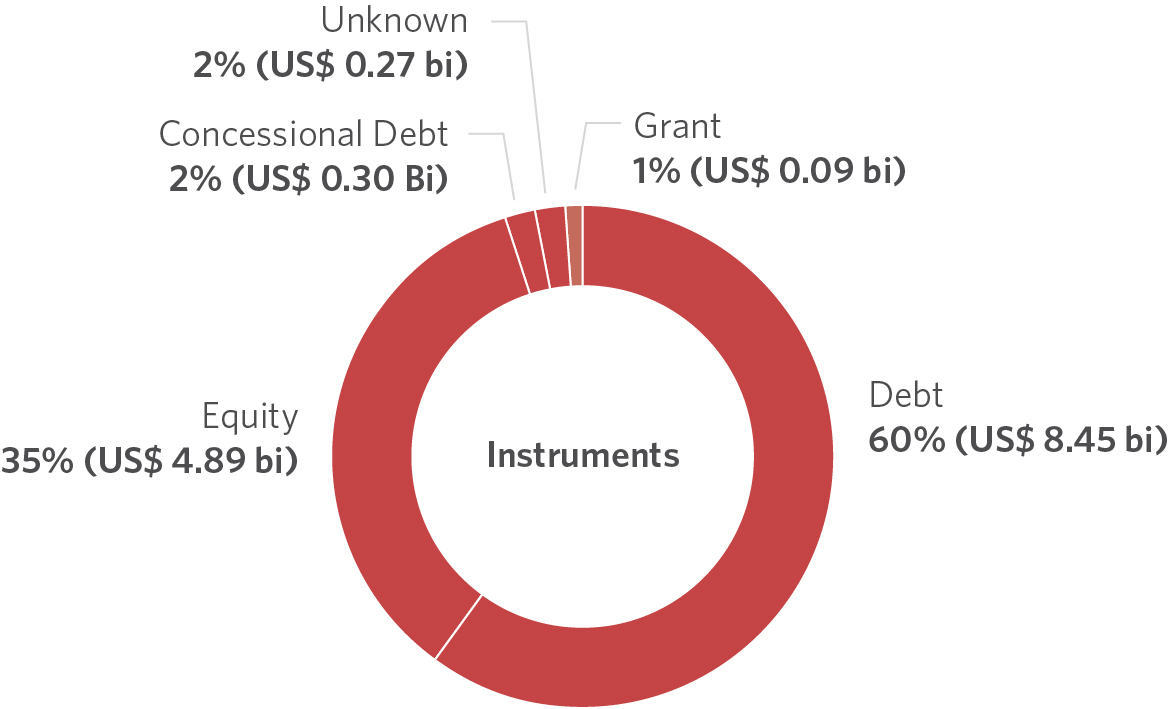
Commercial instruments, equity, and debt accounted for 89% (US$ 4.5 billion/year) of the flows tracked in 2021–2022, representing a 168% increase compared to 2019–2020 (US$ 1.7 billion/year), as illustrated in Figure 4. Credit operations accounted for 65% (US$ 3.3 billion/year) of the value tracked in 2021–2022 and were primarily directed toward the energy sector (49%). Regarding credit finance, 69% was provided by public actors, with an emphasis on multilateral DFIs (61%) and bilateral DFIs (9%), and 31% by private commercial FIs.
Figure 4. International Climate Finance for Brazil by Instrument, 2019-2022
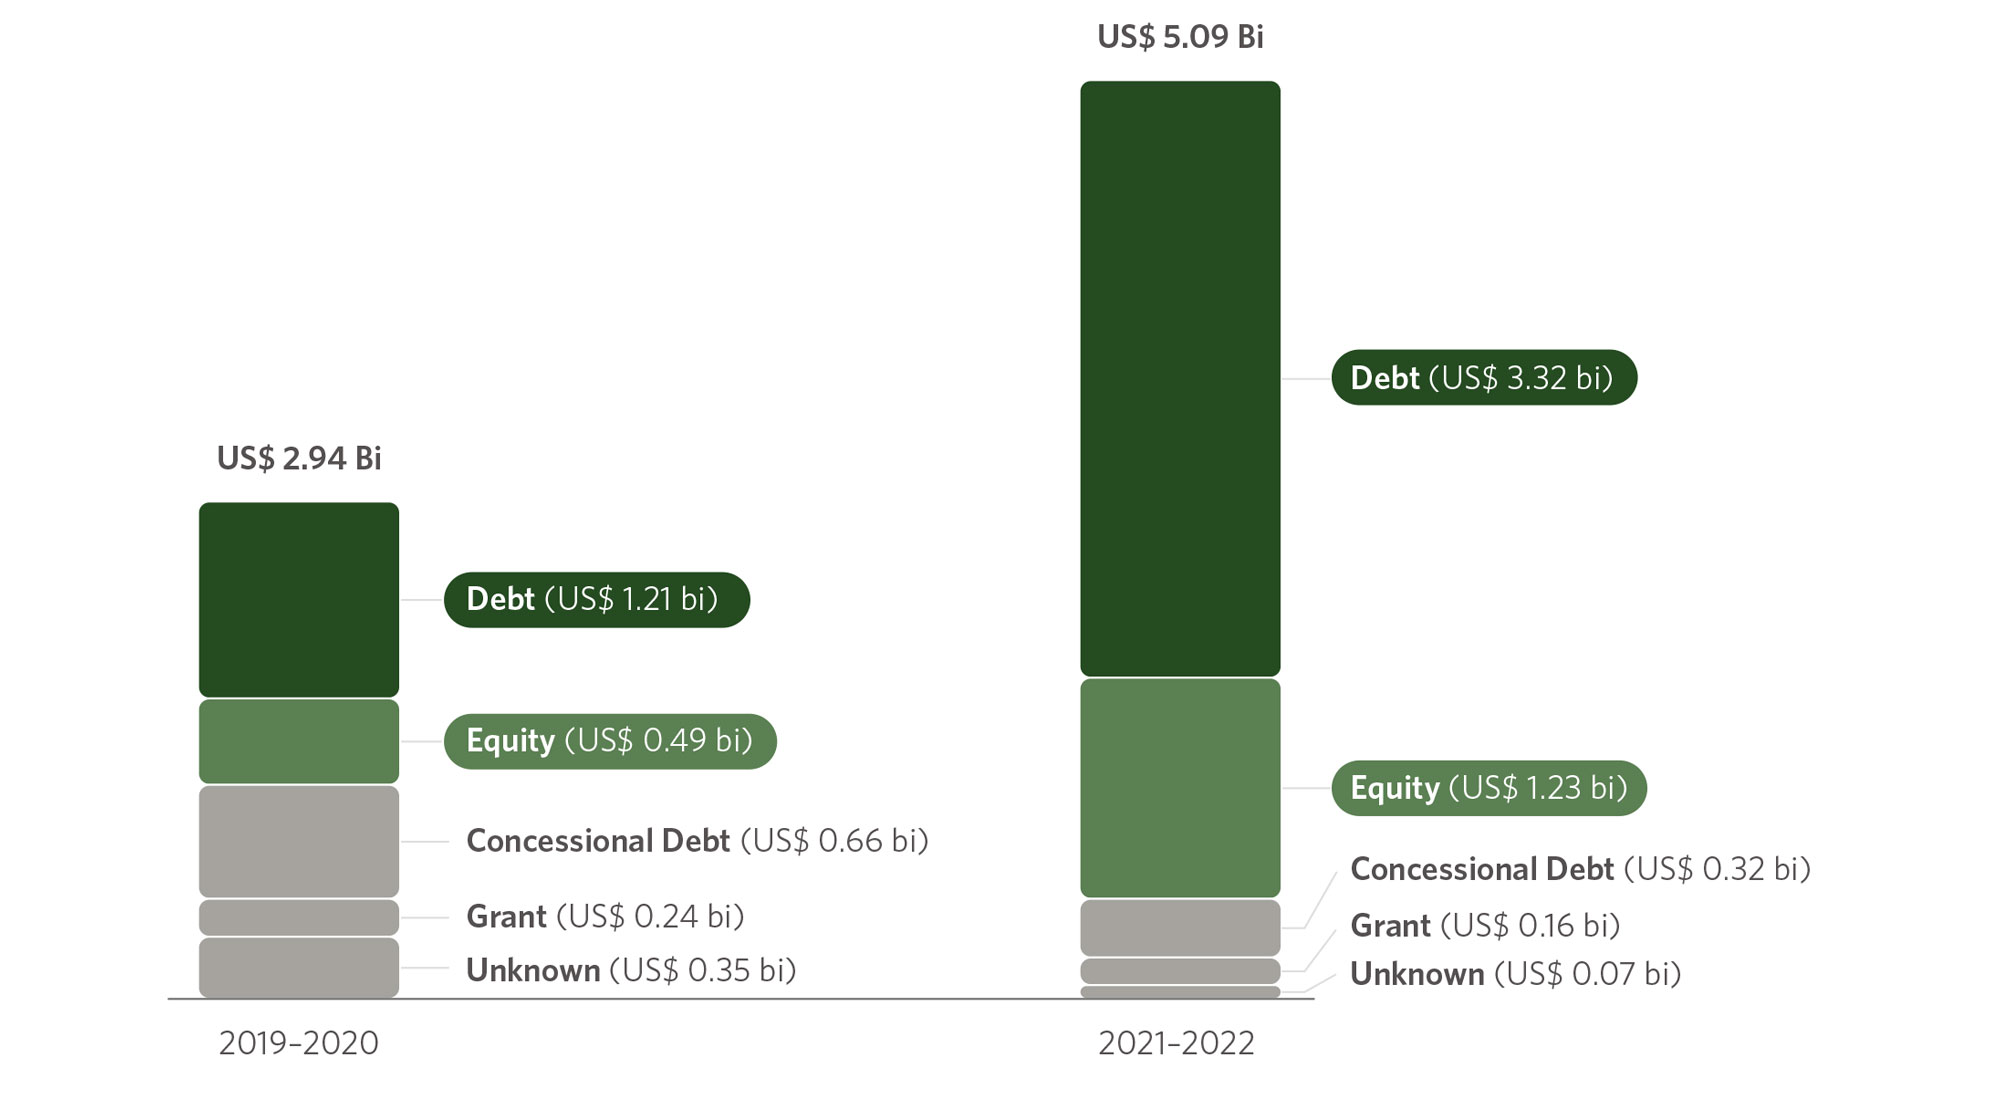
Note: Values classified as “unknown” refer to financing flows for which it was not possible to identify the responsible financial actor and/or the financial instrument used, due to limited or absent information in the available data.
Source: CPI/PUC-RIO with data from BNEF (2024), Climate Funds Update via ODI/HBF (2024), IJ Global (2024), OECD-DAC Creditor System (2024), World Bank PPI (2024) and surveys with DFIs and IDFC members (CPI 2024), 2025
Equity investments amounted to 24% of the total in 2021–2022 (US$ 1.2 billion/year). Private sources provided 86% of equity, with corporations accounting for the largest share (71%). Solar power generation projects received 72% of the total equity finance.
International concessional credit operations accounted for 6% (US$ 320 million/year) of international finance for Brazil in 2021–2022, exclusively from public actors. Bilateral DFIs were responsible for 85% of this total, directing resources to cross-sectoral and other projects (45%) and AFOLU (28%).
Grants accounted for only 3% (US$ 156 million/year) of the total tracked in 2021–2022, mostly provided by foreign governments (75%). The AFOLU sector received 47% of the tracked grants, with 41% of these allocated to the forestry subsector (US$ 63 million/year).
Together, climate finance from grants and concessional debt fell by 43% between 2019–2020 and 2021–2022, from US$ 891 million/year to US$ 476 million/year. This drop occurred among all types of institutions except for governments (which saw a 38% increase in the period). Bilateral DFIs saw a 38% drop, multilateral climate funds a 84% drop, multilateral DFIs a 72% drop, and institutional investors a 9% drop. This decrease may be explained by the effects of the COVID-19 pandemic and the period’s climate policy management.
Climate Objectives
International climate finance for Brazil in 2021–2022 had most of its resources (80%) earmarked exclusively for climate mitigation, in line with the global trend (Buchner et al. 2023).[14] Between 2019–2020 and 2021–2022, international resources for mitigation grew from US$ 2.0 billion/year to US$ 4.1 billion/year.
Resources that contributed to both mitigation and adaptation amounted to US$ 733 million/year (14%). The AFOLU sector received 45% of these resources (US$ 429 million/year), mostly for sustainable and climate-resilient crop projects. Another 26% of these dual-benefit flows went to cross-sectoral projects, including urban development (7%), financial and banking services (7%), and support for Micro-, Small-, and Medium-Sized enterprises (MSMEs) (6%).
International climate finance dedicated exclusively to adaptation accounted for only 5% of the flows tracked (US$ 258 million/year). The water and sanitation sector received 41% of these funds (US$ 106 million/year).
Projects with adaptation components were mostly financed by public actors (89%), whereas exclusive mitigation projects received 50% private financing. Multilateral DFIs were the main funders of climate adaptation projects in Brazil, providing 70% of public funds. The predominance of public funding for adaptation aligns with the global trend, indicating that there is room for growth in international private finance for this agenda in Brazil (Buchner et al., 2023).
Sectors
This section examines the financial profile for each tracked sector, detailing the sources of funding, the instruments used, and the subsectors and solutions that have been financed within each sector.
More than half of the international climate finance for Brazil in 2021–2022 was for the energy sector, at 53% (US$ 2.7 billion/year). Then followed the cross-sectoral and other category at 20% (US$ 1.0 billion/year), AFOLU at 11% (US$ 559 million/year), transport at 11% (US$ 558 million/year), and water and sanitation at 5% (US$ 253 million/year) (Figure 5).
Figure 5. International Climate Finance for Brazil by Sector, 2019-2022
Source: CPI/PUC-RIO with data from BNEF (2024), Climate Funds Update via ODI/HBF (2024), IJ Global (2024), OECD-DAC Creditor System (2024), World Bank PPI (2024) and surveys with DFIs and IDFC members (CPI 2024), 2025
Energy
Figure 6. International Climate Finance for the Energy Sector in Brazil by Subsector, 2021–2022
Source: CPI/PUC-RIO with data from BNEF (2024), Climate Funds Update via ODI/HBF (2024), IJ Global (2024), OECD-DAC Creditor System (2024), World Bank PPI (2024) and surveys with DFIs and IDFC members (CPI 2024), 2025
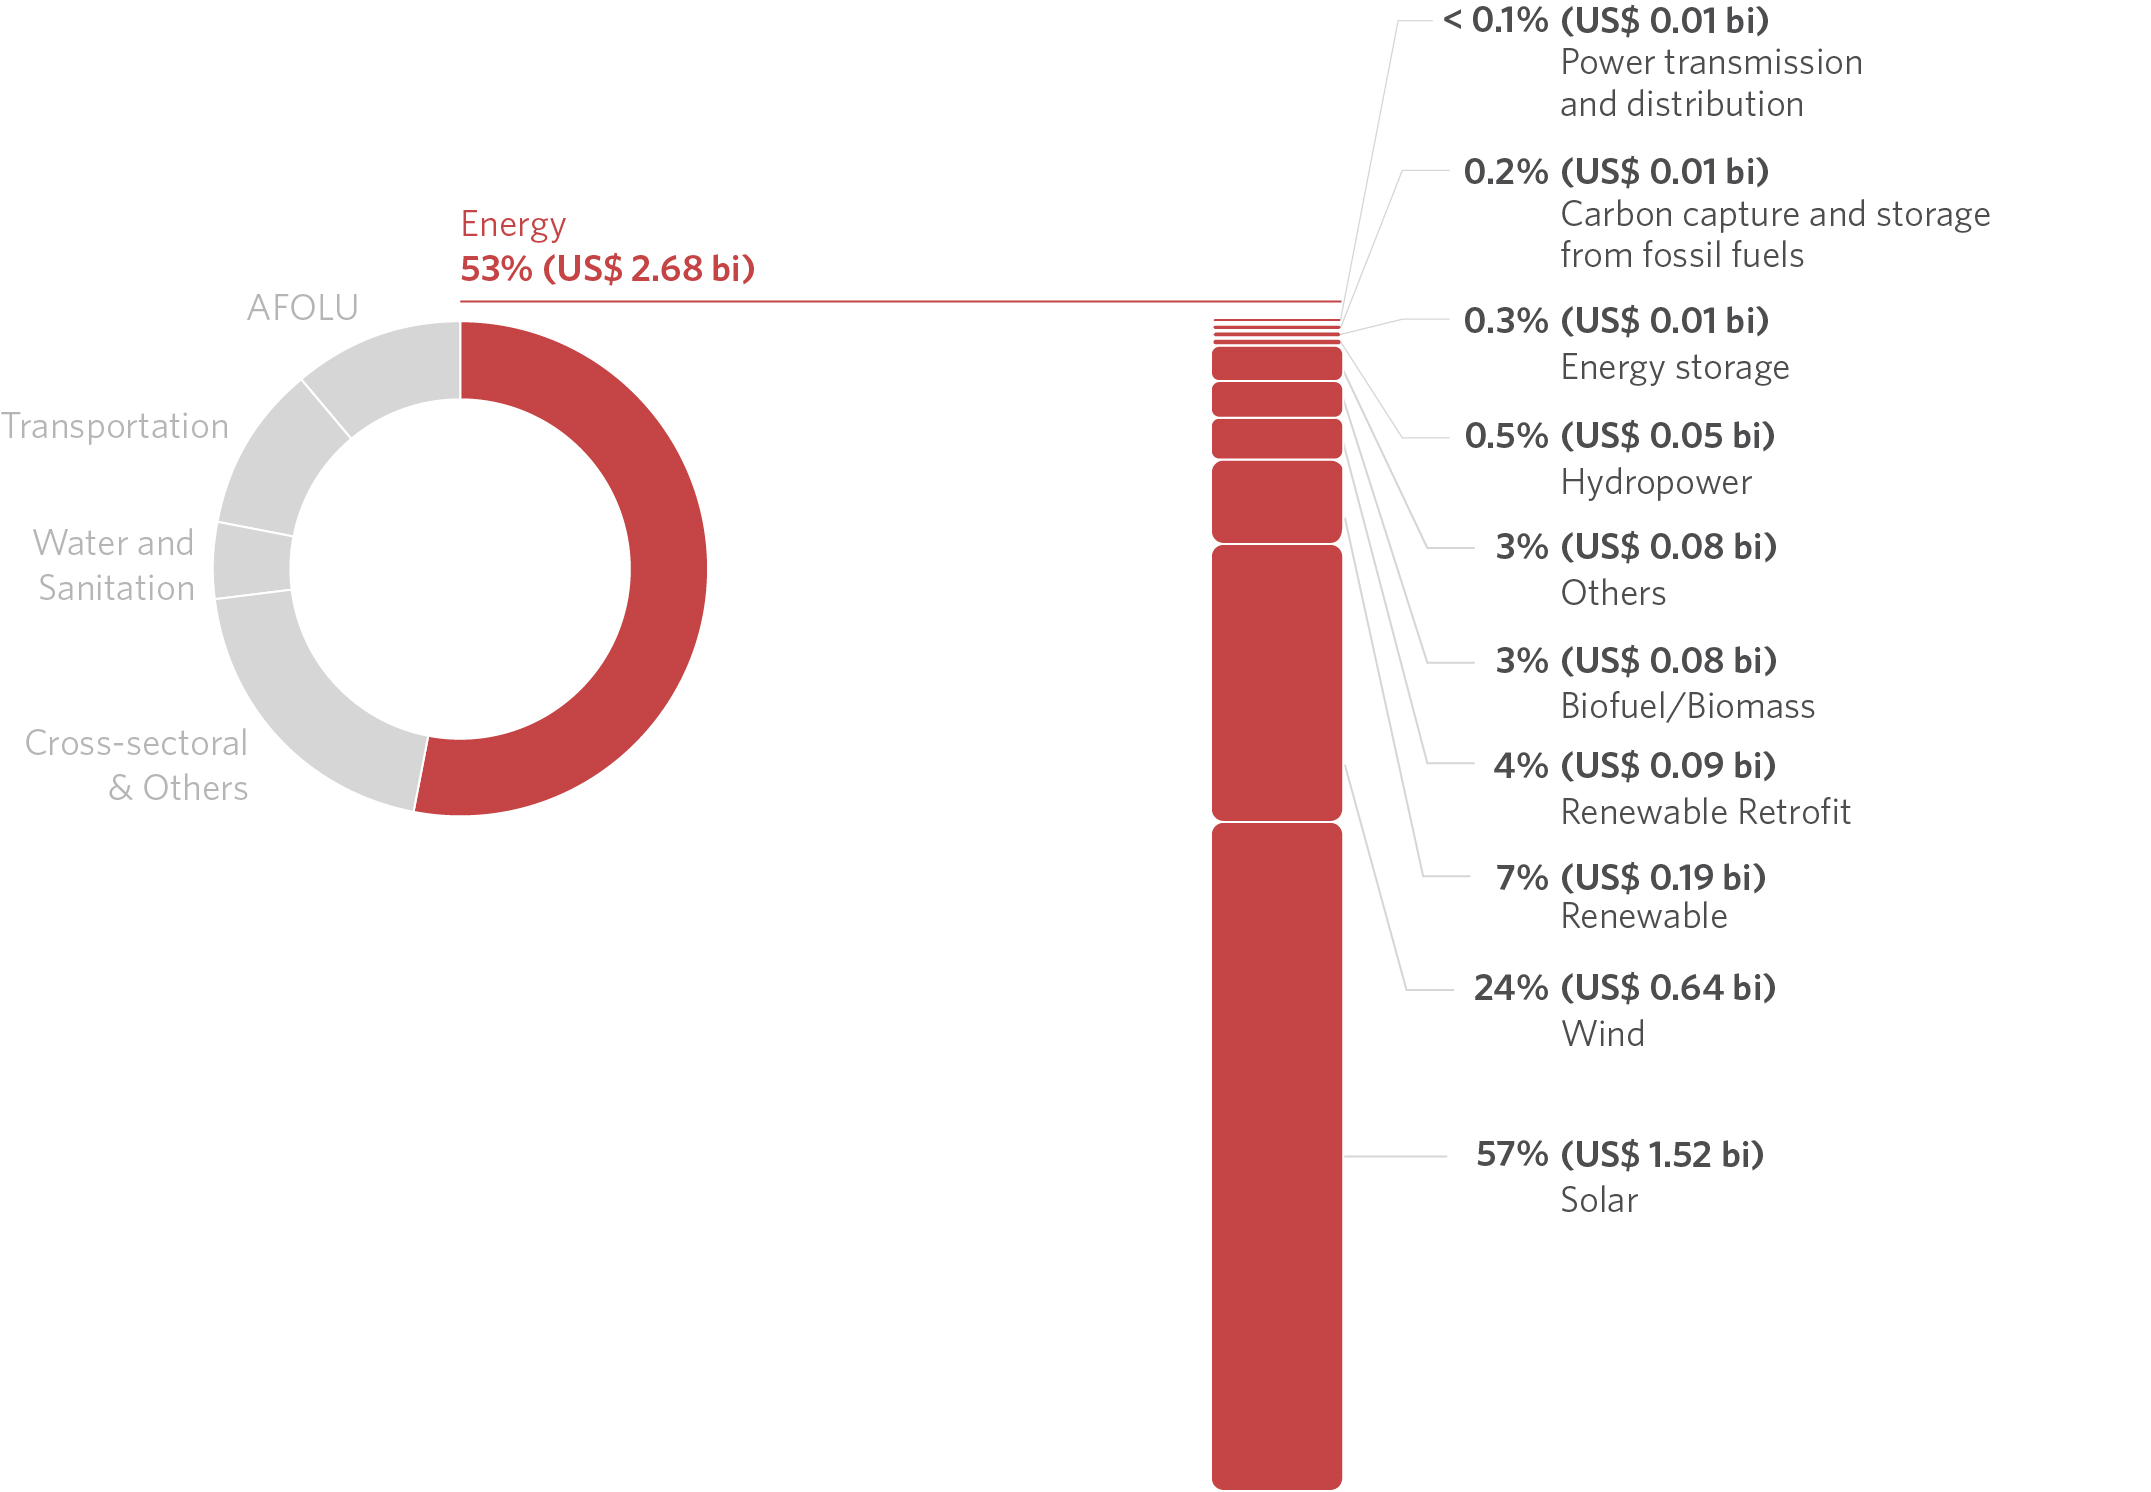
International climate investment in energy reached US$ 2.6 billion/year in 2021–2022 (53% of the total). Compared to 2019–2020, finance for this sector grew by 165% (US$ 1.6 billion/year) and accounted for 72% of the total increase in international finance during the period.
Figure 7. International Climate Finance for the Energy Sector in Brazil by Source of Funds, 2021–2022
Note: Values classified as “unknown” refer to financing flows for which it was not possible to identify the responsible financial actor and/or the financial instrument used, due to limited or absent information in the available data.
Source: CPI/PUC-RIO with data from BNEF (2024), Climate Funds Update via ODI/HBF (2024), IJ Global (2024), OECD-DAC Creditor System (2024), World Bank PPI (2024) and surveys with DFIs and IDFC members (CPI 2024), 2025
Private sources mobilized 67% of the resources for energy, totaling US$ 1.8 billion/year. This represented 84% of all private climate finance for Brazil in 2021–2022, placing the sector as the main mobilizer of international private capital for climate projects in the country. Most of these private resources came from commercial FIs (36%) and corporations (28%).
Figure 8. International Climate Finance for the Energy Sector in Brazil by Financial Instrument, 2021–2022
Note: Values classified as “unknown” refer to financing flows for which it was not possible to identify the responsible financial actor and/or the financial instrument used, due to limited or absent information in the available data.
Source: CPI/PUC-RIO with data from BNEF (2024), Climate Funds Update via ODI/HBF (2024), IJ Global (2024), OECD-DAC Creditor System (2024), World Bank PPI (2024) and surveys of DFIs and IDFC members (CPI 2024), 2025
Commercial instruments dominated energy finance, with 95% of resources mobilized through equity (35%) and commercial debt (61%).
Solar and wind power generation projects were the primary recipients of international financial resources for energy in Brazil in 2021–2022, accounting for 80% of the sector’s climate flows and 42% (US$ 2.2 billion/year) of the total tracked.
Solar power generation attracted US$ 1.5 billion/year in international finance in 2021–2022, representing 57% of energy finance. Compared to 2019–2020, there was an almost seven-fold increase in funding for solar energy. This growth was primarily driven by equity (58%) and aligns with the upward trend in installed solar energy capacity in the country over the past decade (Nunes et al., 2025).[15] Brazil’s Southeast region received 48% of the country’s international finance for solar energy in 2021–2022, largely due to the solar plant project at the Port of Açu in Rio de Janeiro, which accounted for 36% of the total tracked for solar energy. The other 12% of the finance for solar energy in the region went to projects in Minas Gerais. The Northeast received 31% of total solar energy flows, led by Rio Grande do Norte (18%), Ceará (6%), Piauí (4%), and Pernambuco (3%). Cross-regional financing accounted for 20% (US$ 311 million/year) of finance for the solar sector, strengthening credit lines for implementing solar energy for Small and Medium-Sized Enterprises (SMEs).
Wind power generation mobilized US$ 638 million/year in 2021–2022, or 24% of the value tracked for the energy sector. Finance for wind grew less than for solar, but still more than doubled compared to 2019–2020. International resources for wind power generation in 2021–2022 came exclusively from private sources, with 95% from commercial FIs. In addition, finance for offshore projects accounted for 52% of the total amount, at US$ 326 million/year. Onshore projects, on the other hand, were concentrated in the Northeast, with 40% for projects in Bahia and 4% for Rio Grande do Norte.
AFOLU
Figure 9. International Climate Finance for the AFOLU Sector in Brazil by Subsector, 2021–2022
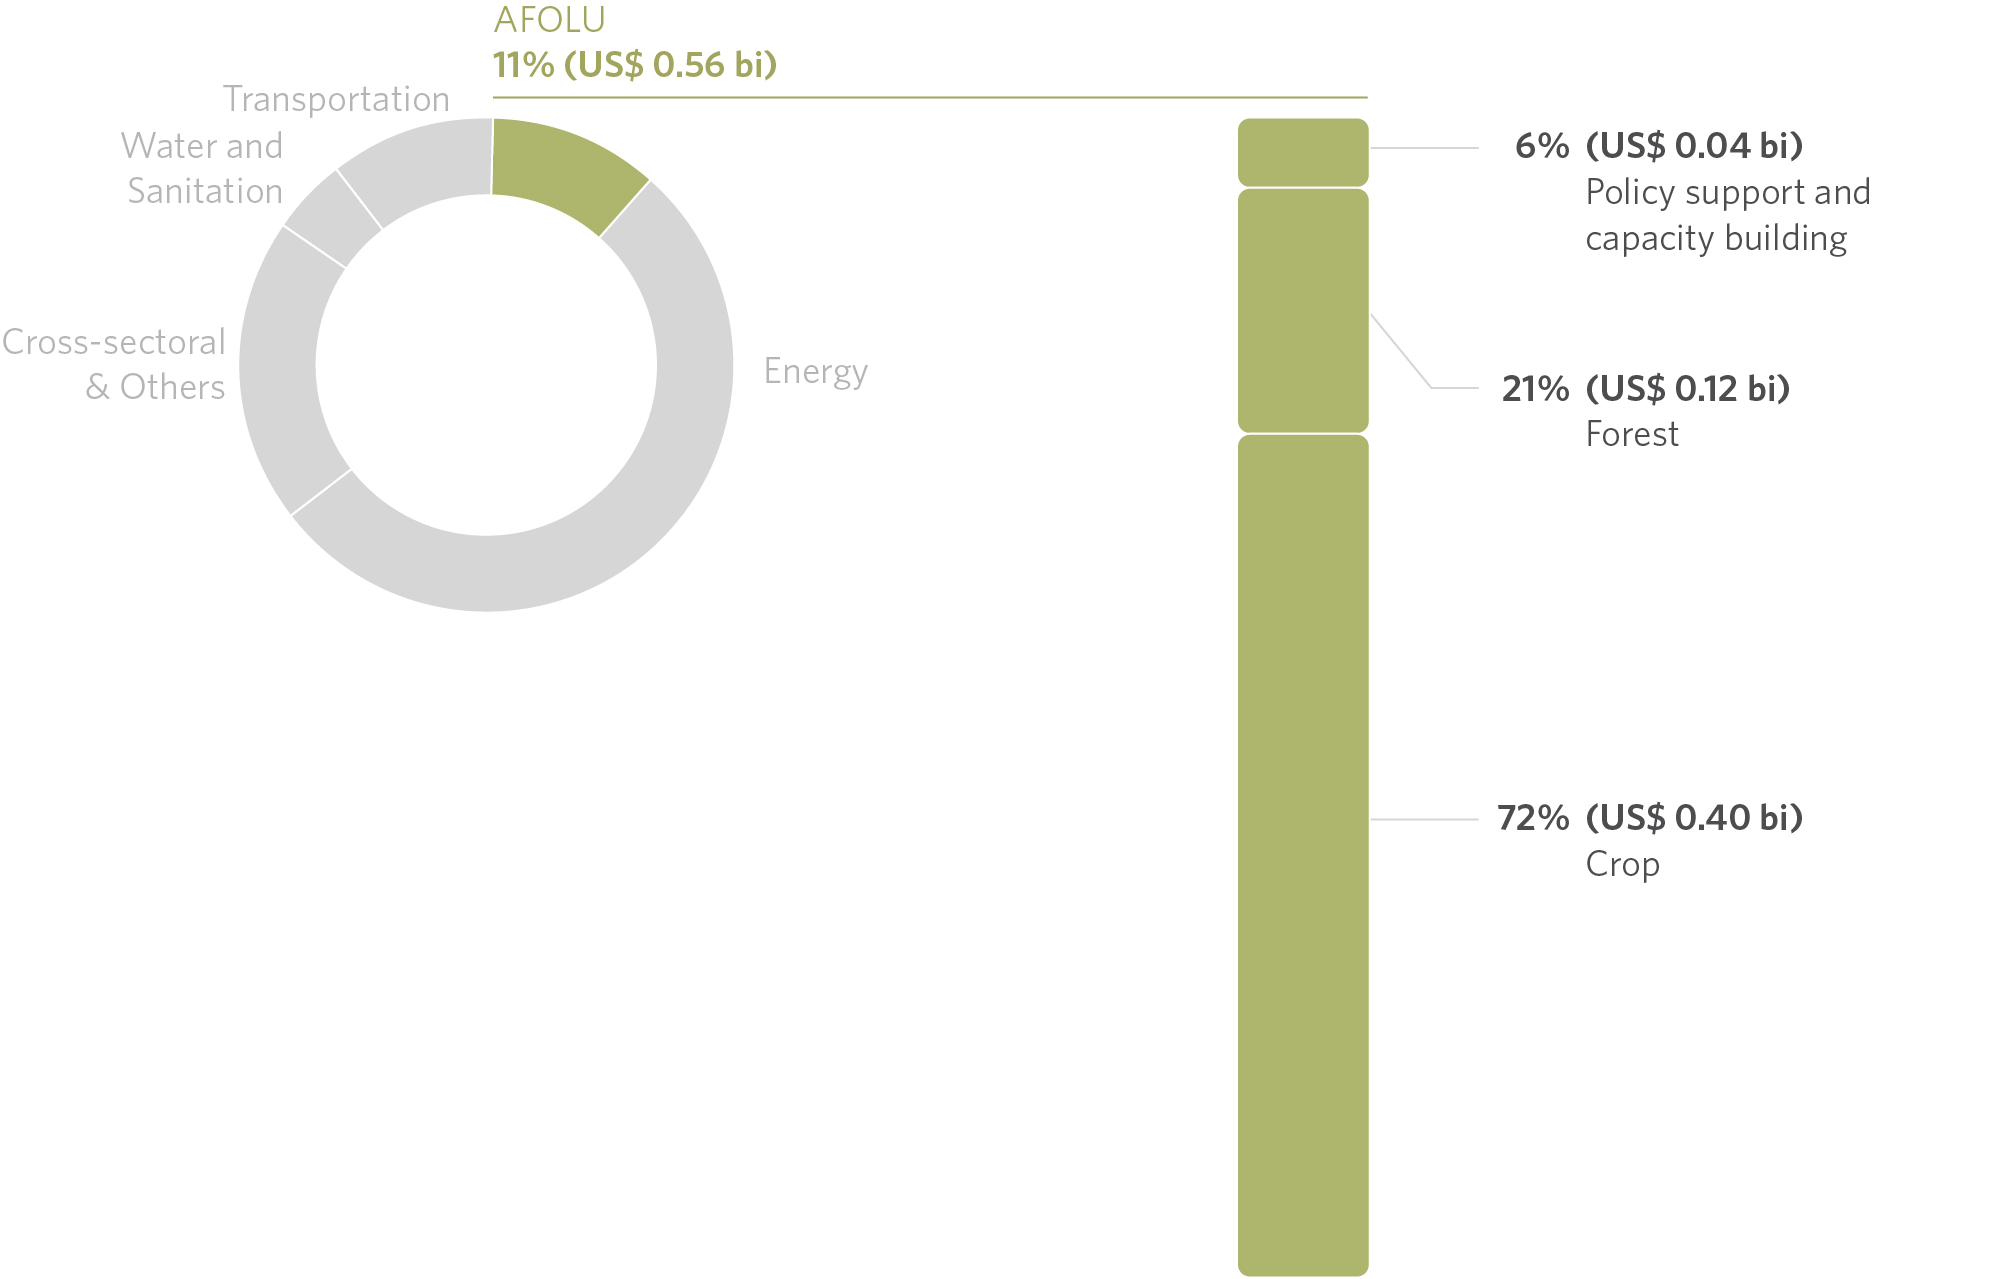
Source: CPI/PUC-RIO with data from BNEF (2024), Climate Funds Update via ODI/HBF (2024), IJ Global (2024), OECD-DAC Creditor System (2024), World Bank PPI (2024) and surveys with DFIs and IDFC members (CPI 2024), 2025
The AFOLU sector is responsible for three-quarters of Brazil’s GHG emissions (SEEG 2023) but received only 11% of international climate finance in 2021–2022 (US$ 559 million/year).
Public actors mobilized 99% of the resources for land use, largely through multilateral (71%) and bilateral (16%) DFIs.
Figure 10. International Climate Finance for the AFOLU Sector in Brazil by Source of Funds, 2021–2022
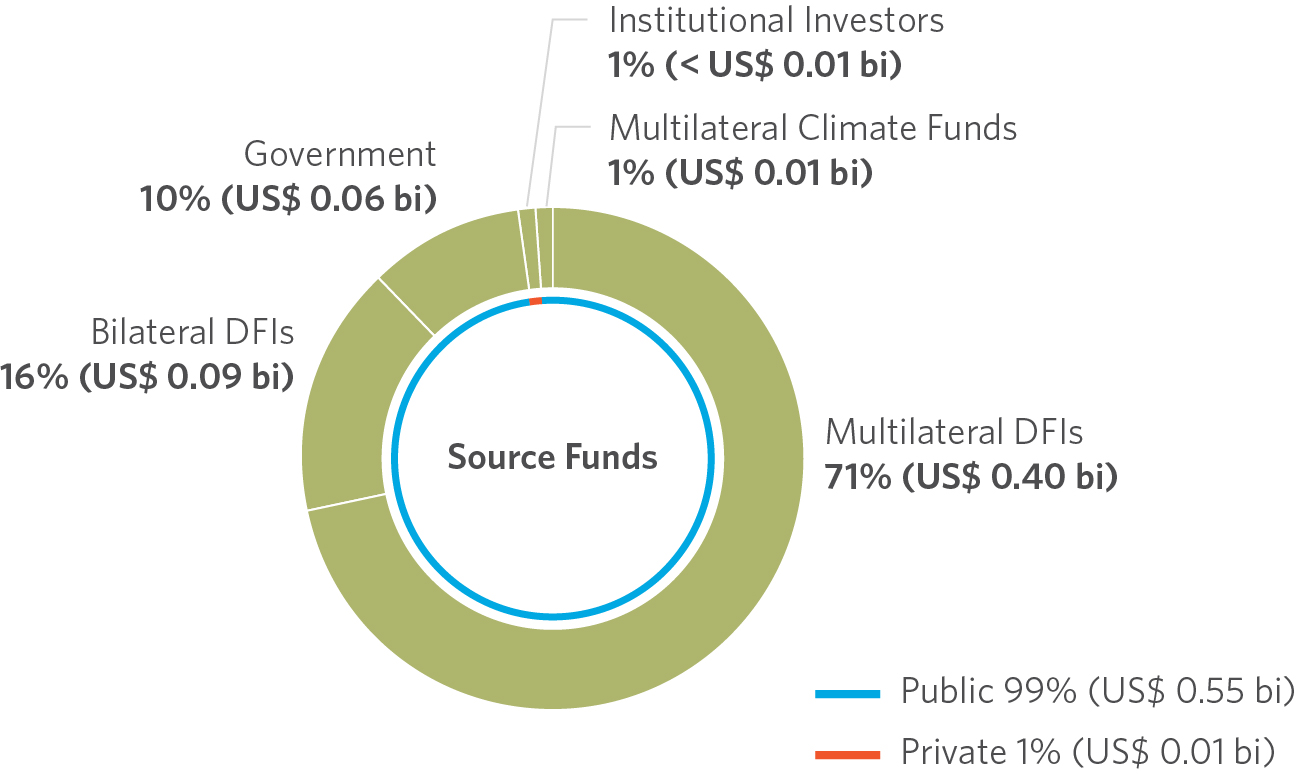
Source: CPI/PUC-RIO with data from BNEF (2024), Climate Funds Update via ODI/HBF (2024), IJ Global (2024), OECD-DAC Creditor System (2024), World Bank PPI (2024) and surveys with DFIs and IDFC members (CPI 2024), 2025
The land use sector mobilized US$ 151 million/year through concessional instruments, which represents 27% of the sector’s finance. This includes US$ 78 million/year (14%) in concessional debt and US$ 73 million/year (13%) in grants, representing 47% of all grants with climate objectives tracked for Brazil in 2021–2022. Credit accounted for 71% of the sector’s finance, directed toward crops.
Figure 11. International Climate Finance for the AFOLU Sector in Brazil by Financial Instrument, 2021–2022
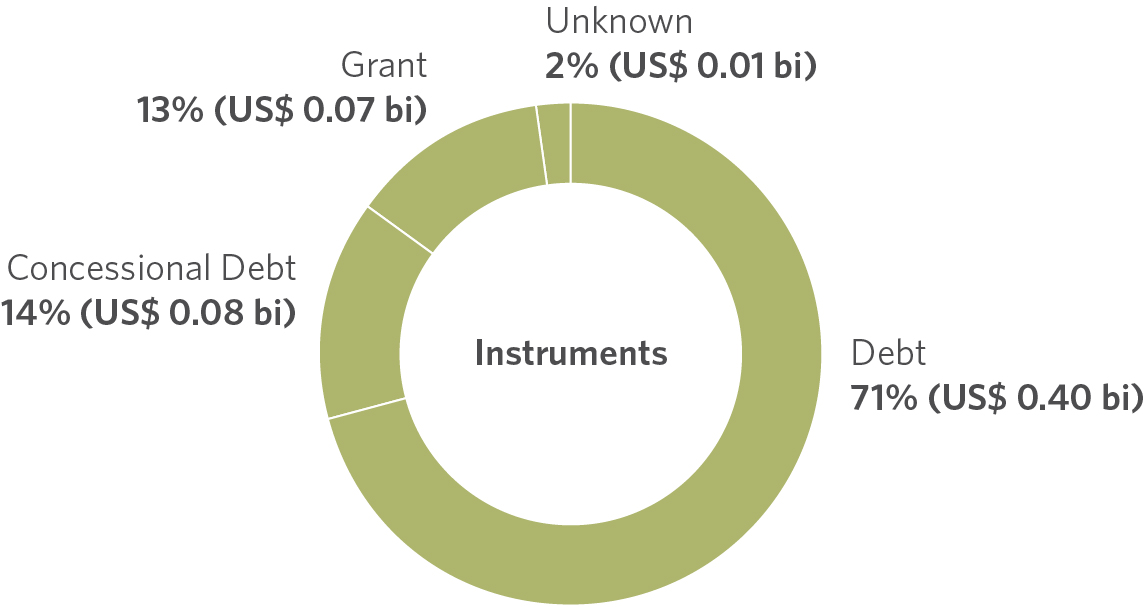
Note: Values classified as “unknown” refer to financing flows for which it was not possible to identify the responsible financial actor and/or the financial instrument used, due to limited or absent information in the available data.
Source: CPI/PUC-RIO with data from BNEF (2024), Climate Funds Update via ODI/HBF (2024), IJ Global (2024), OECD-DAC Creditor System (2024), World Bank PPI (2024) and surveys with DFIs and IDFC members (CPI 2024), 2025
Under AFOLU, Crops mobilized US$ 401 million/year in 2021–2022. Of these resources, 87% came from multilateral DFIs, mostly for projects to support sustainable crop and strengthen climate resilience in the countryside.
Forestry received US$ 119 million/year in international flows, just 2% of international finance in 2021–2022. Of this total, 54% was channeled through grants (US$ 63 million/year), which represented 41% of all grants with climate objectives tracked in 2021–2022. International governments (43%) and bilateral DFIs (35%) provided most of the climate resources going to forestry.
Transportation
Figure 12. International Climate Finance for the Transport Sector in Brazil by Subsector, 2021–2022
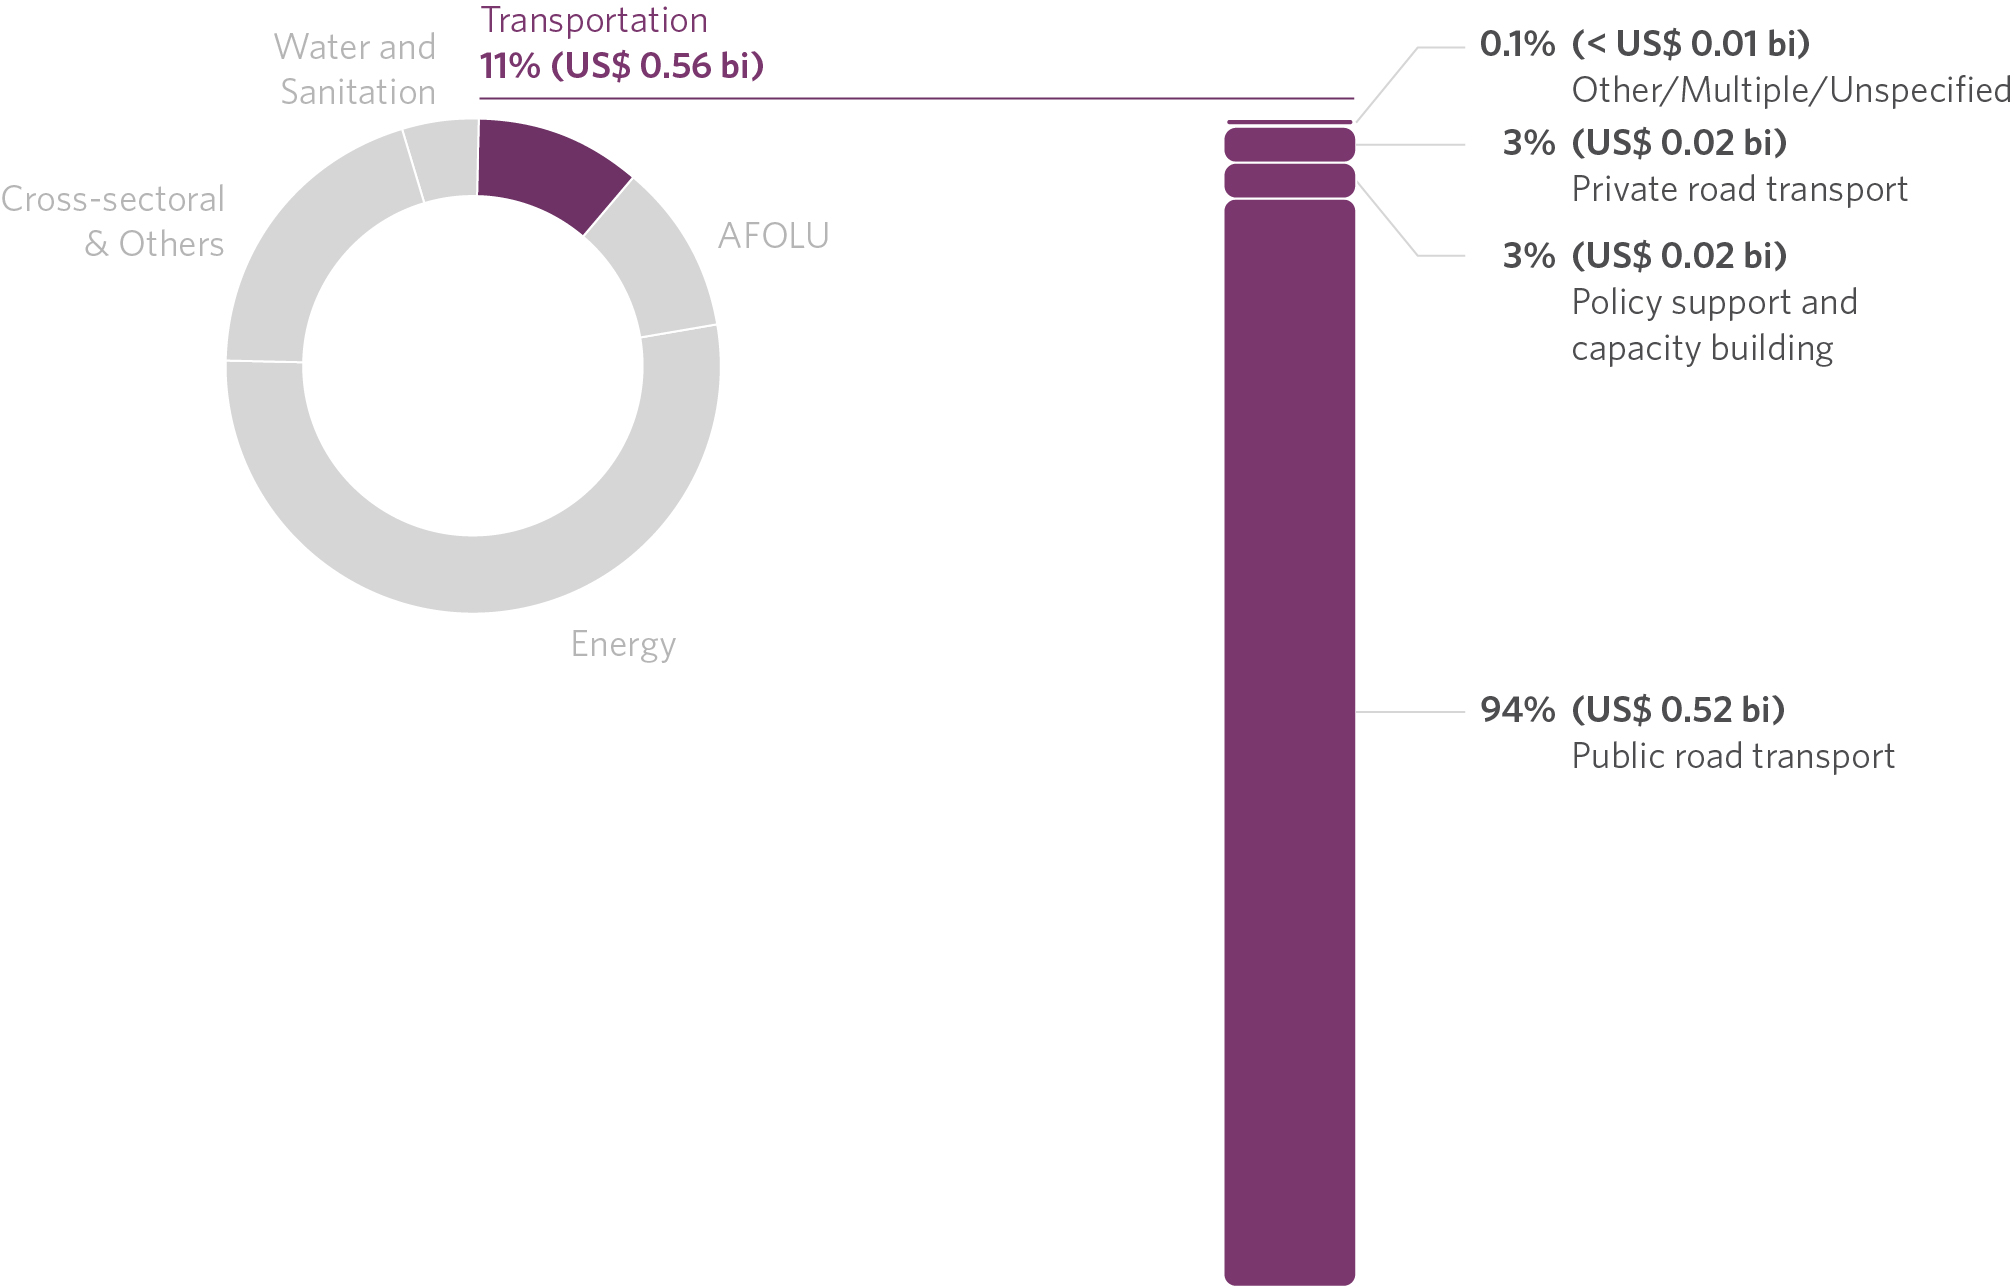
Source: CPI/PUC-RIO with data from BNEF (2024), Climate Funds Update via ODI/HBF (2024), IJ Global (2024), OECD-DAC Creditor System (2024), World Bank PPI (2024) and surveys with DFIs and IDFC members (CPI 2024), 2025
The transport sector received US$ 558 million/year in international climate finance in 2021–2022, representing 11% of the tracked total. The amount tracked increased more than three times compared to 2019–2020, when only US$ 176 million/year was invested through international resources in the sector.
The São Paulo metro accounted for 94% of the flows tracked for transport in 2021–2022 (US$ 524 million/year), with funding coming from two different projects.
The construction of Line 6 of the São Paulo metro mobilized US$ 261.6 million/year through a public-private partnership (PPP) with equity from international corporations that are part of the Linha Verde concessionaire, which is responsible for the work. These funds were added to domestic contributions, including from the government of the State of São Paulo and the Brazilian Development Bank (Banco Nacional de Desenvolvimento Econômico e Social – BNDES), characterizing Line 6 as the largest infrastructure project underway in Latin America (Martins 2025).
The other project refers to the expansion of Line 2 of the São Paulo metro, which received US$ 262.6 million/year in debt from CAF. At the time it was carried out, this credit operation represented the largest finance ever provided by CAF in Brazil.
Public resources accounted for 59% of transport finance, 53% of which was provided by multilateral DFIs, including CAF resources for Line 2 of the São Paulo metro. Private resources were exclusively directed to Line 5, both from corporations and commercial FIs.
Figure 13. International Climate Finance for the Transportation Sector in Brazil by Source of Funds, 2021–2022
Source: CPI/PUC-RIO with data from BNEF (2024), Climate Funds Update via ODI/HBF (2024), IJ Global (2024), OECD-DAC Creditor System (2024), World Bank PPI (2024) and surveys with DFIs and IDFC members (CPI 2024), 2025
International climate finance for transport in Brazil exclusively used instruments at commercial rates, through debt (53%) in the financing of Line 2—and equity (47%)—in the financing of Line 6.
Figure 14. International Climate Finance for the Transport Sector in Brazil by Financial Instrument, 2021–2022
Note: Values classified as “unknown” refer to financing flows for which it was not possible to identify the responsible financial actor and/or the financial instrument used, due to limited or absent information in the available data.
Source: CPI/PUC-RIO with data from BNEF (2024), Climate Funds Update via ODI/HBF (2024), IJ Global (2024), OECD-DAC Creditor System (2024), World Bank PPI (2024) and surveys with DFIs and IDFC members (CPI 2024), 2025
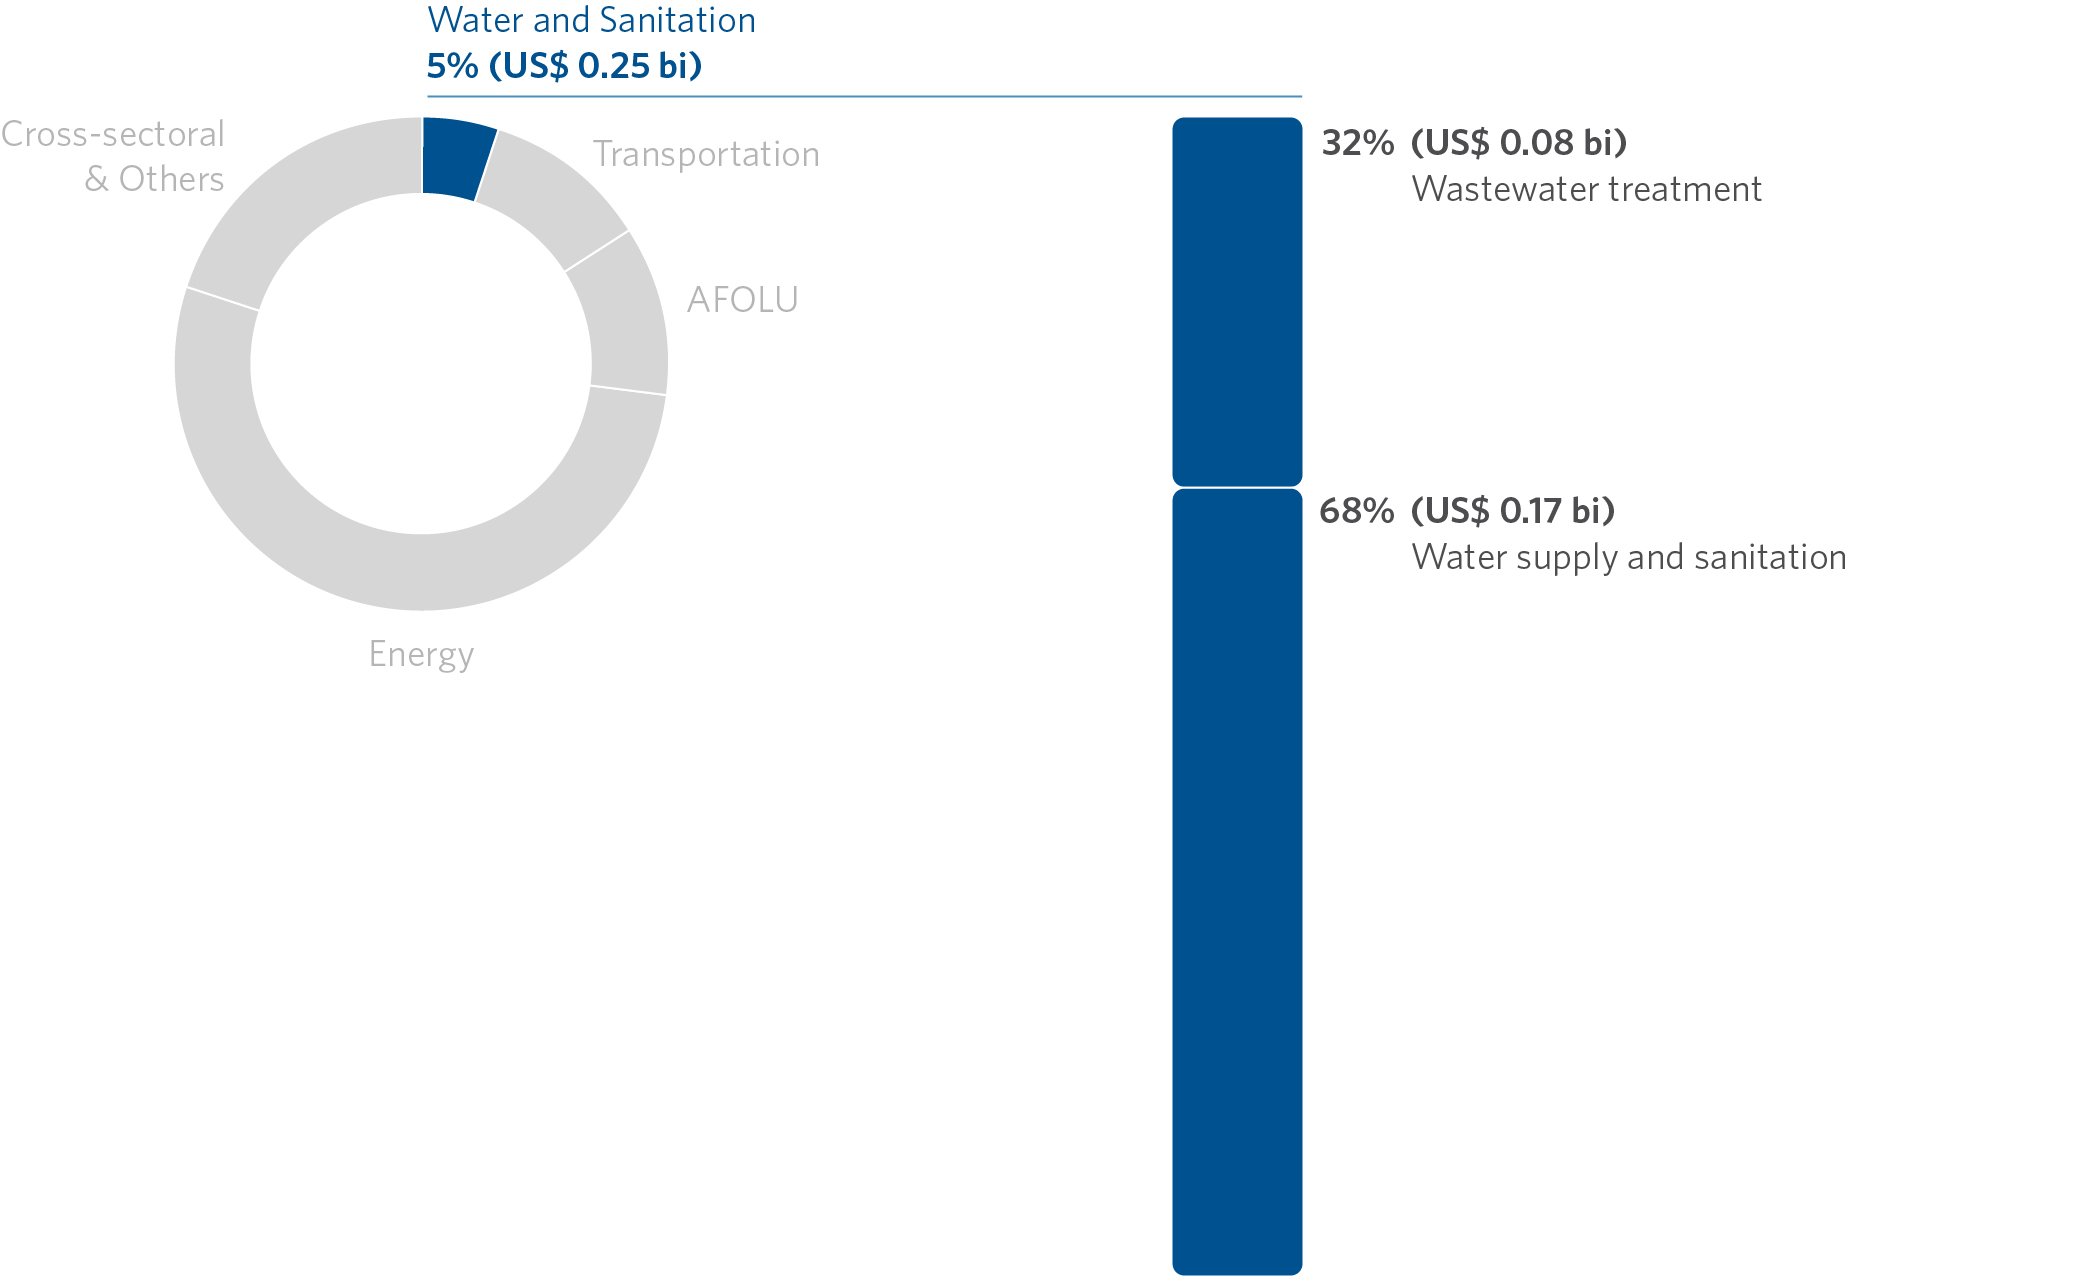
Water and Sanitation
Figure 15. International Climate Finance for the Water and Sanitation Sector in Brazil by Subsector, 2021–2022
Source: CPI/PUC-RIO with data from BNEF (2024), Climate Funds Update via ODI/HBF (2024), IJ Global (2024), OECD-DAC Creditor System (2024), World Bank PPI (2024) and surveys with DFIs and IDFC members (CPI 2024), 2025
With US$ 253 million/year, the water and sanitation sector accounted for 5% of the country’s international climate finance in 2021–2022. This sector primarily encompasses financing projects for municipal and state-level sanitation and wastewater treatment programs in Brazil, and has a significant impact on climate adaptation, with 65% of flows contributing to this climate use. Between 2019–2020 and 2021–2022, international climate finance for water and sanitation grew by 36%, with private actors now financing US$ 99 million/year compared to US$ 9 million/year in the previous period.
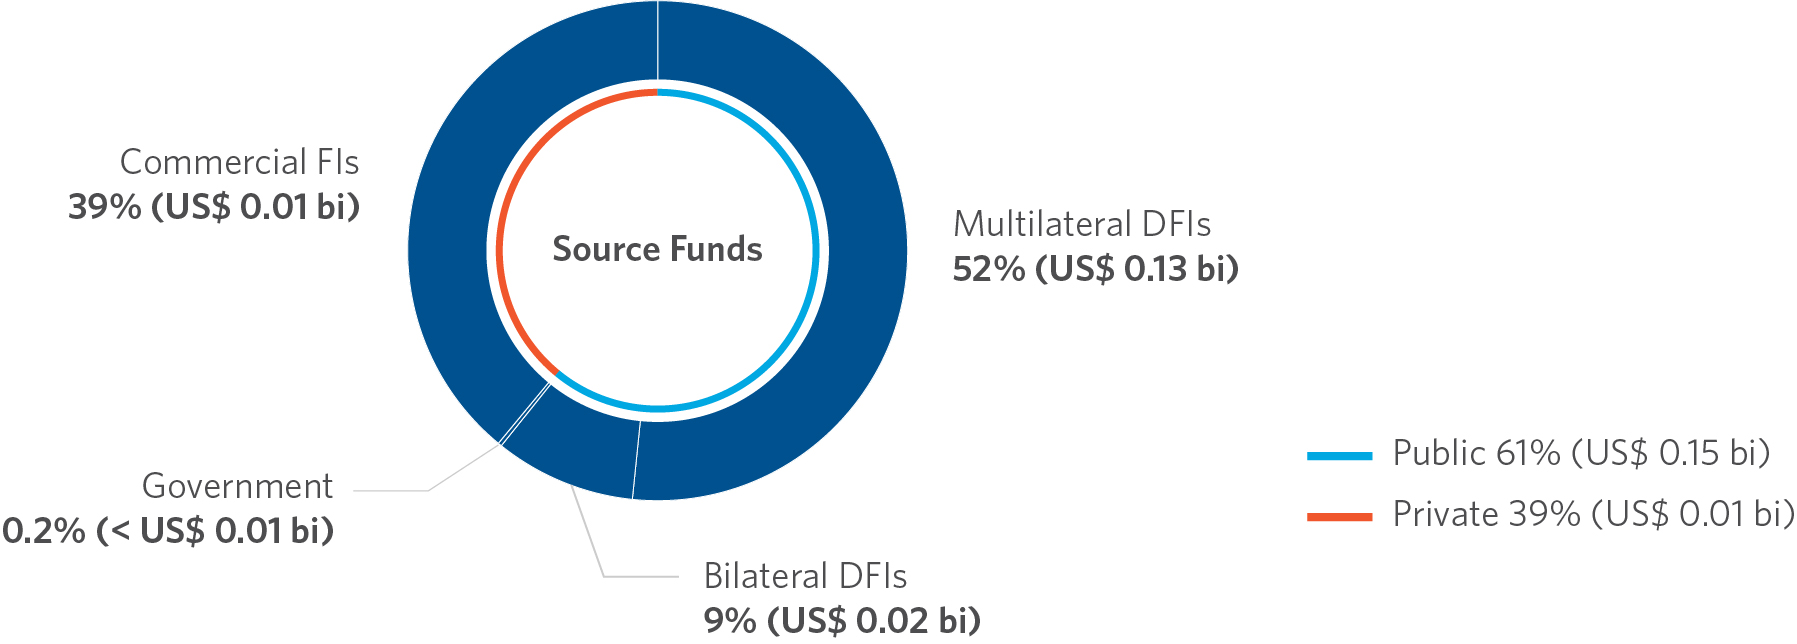
Public sources accounted for 61% of international climate finance for water and sanitation, mobilized by multilateral DFIs (52%) and bilateral DFIs (9%), with the IADB and CAF playing prominent roles in financing municipal and state basic sanitation programs. Private sources accounted for 39% of these resources, exclusively from commercial FIs for sanitation projects and environmental debentures from national municipalities.
Figure 16. International Climate Finance for the Water and Sanitation Sector in Brazil by Source of Funds, 2021–2022
Source: CPI/PUC-RIO with data from BNEF (2024), Climate Funds Update via ODI/HBF (2024), IJ Global (2024), OECD-DAC Creditor System (2024), World Bank PPI (2024) and surveys of DFIs and IDFC members (CPI 2024), 2025
International climate finance for water and sanitation in Brazil has mostly used debt instruments, with 90% at commercial rates and 9% at concessional rates.
Figure 17. International Climate Finance for the Water and Sanitation Sector in Brazil by Financial Instrument, 2021–2022
Note: Values classified as “unknown” refer to financing flows for which it was not possible to identify the responsible financial actor and/or the financial instrument used, due to limited or absent information in the available data.
Source: CPI/PUC-RIO with data from BNEF (2024), Climate Funds Update via ODI/HBF (2024), IJ Global (2024), OECD-DAC Creditor System (2024), World Bank PPI (2024) and surveys with DFIs and IDFC members (CPI 2024), 2025
Cross-sectoral and Other
Figure 18. International Climate Finance for the Cross-sectoral and Other Sectors in Brazil by Subsector, 2021–2022
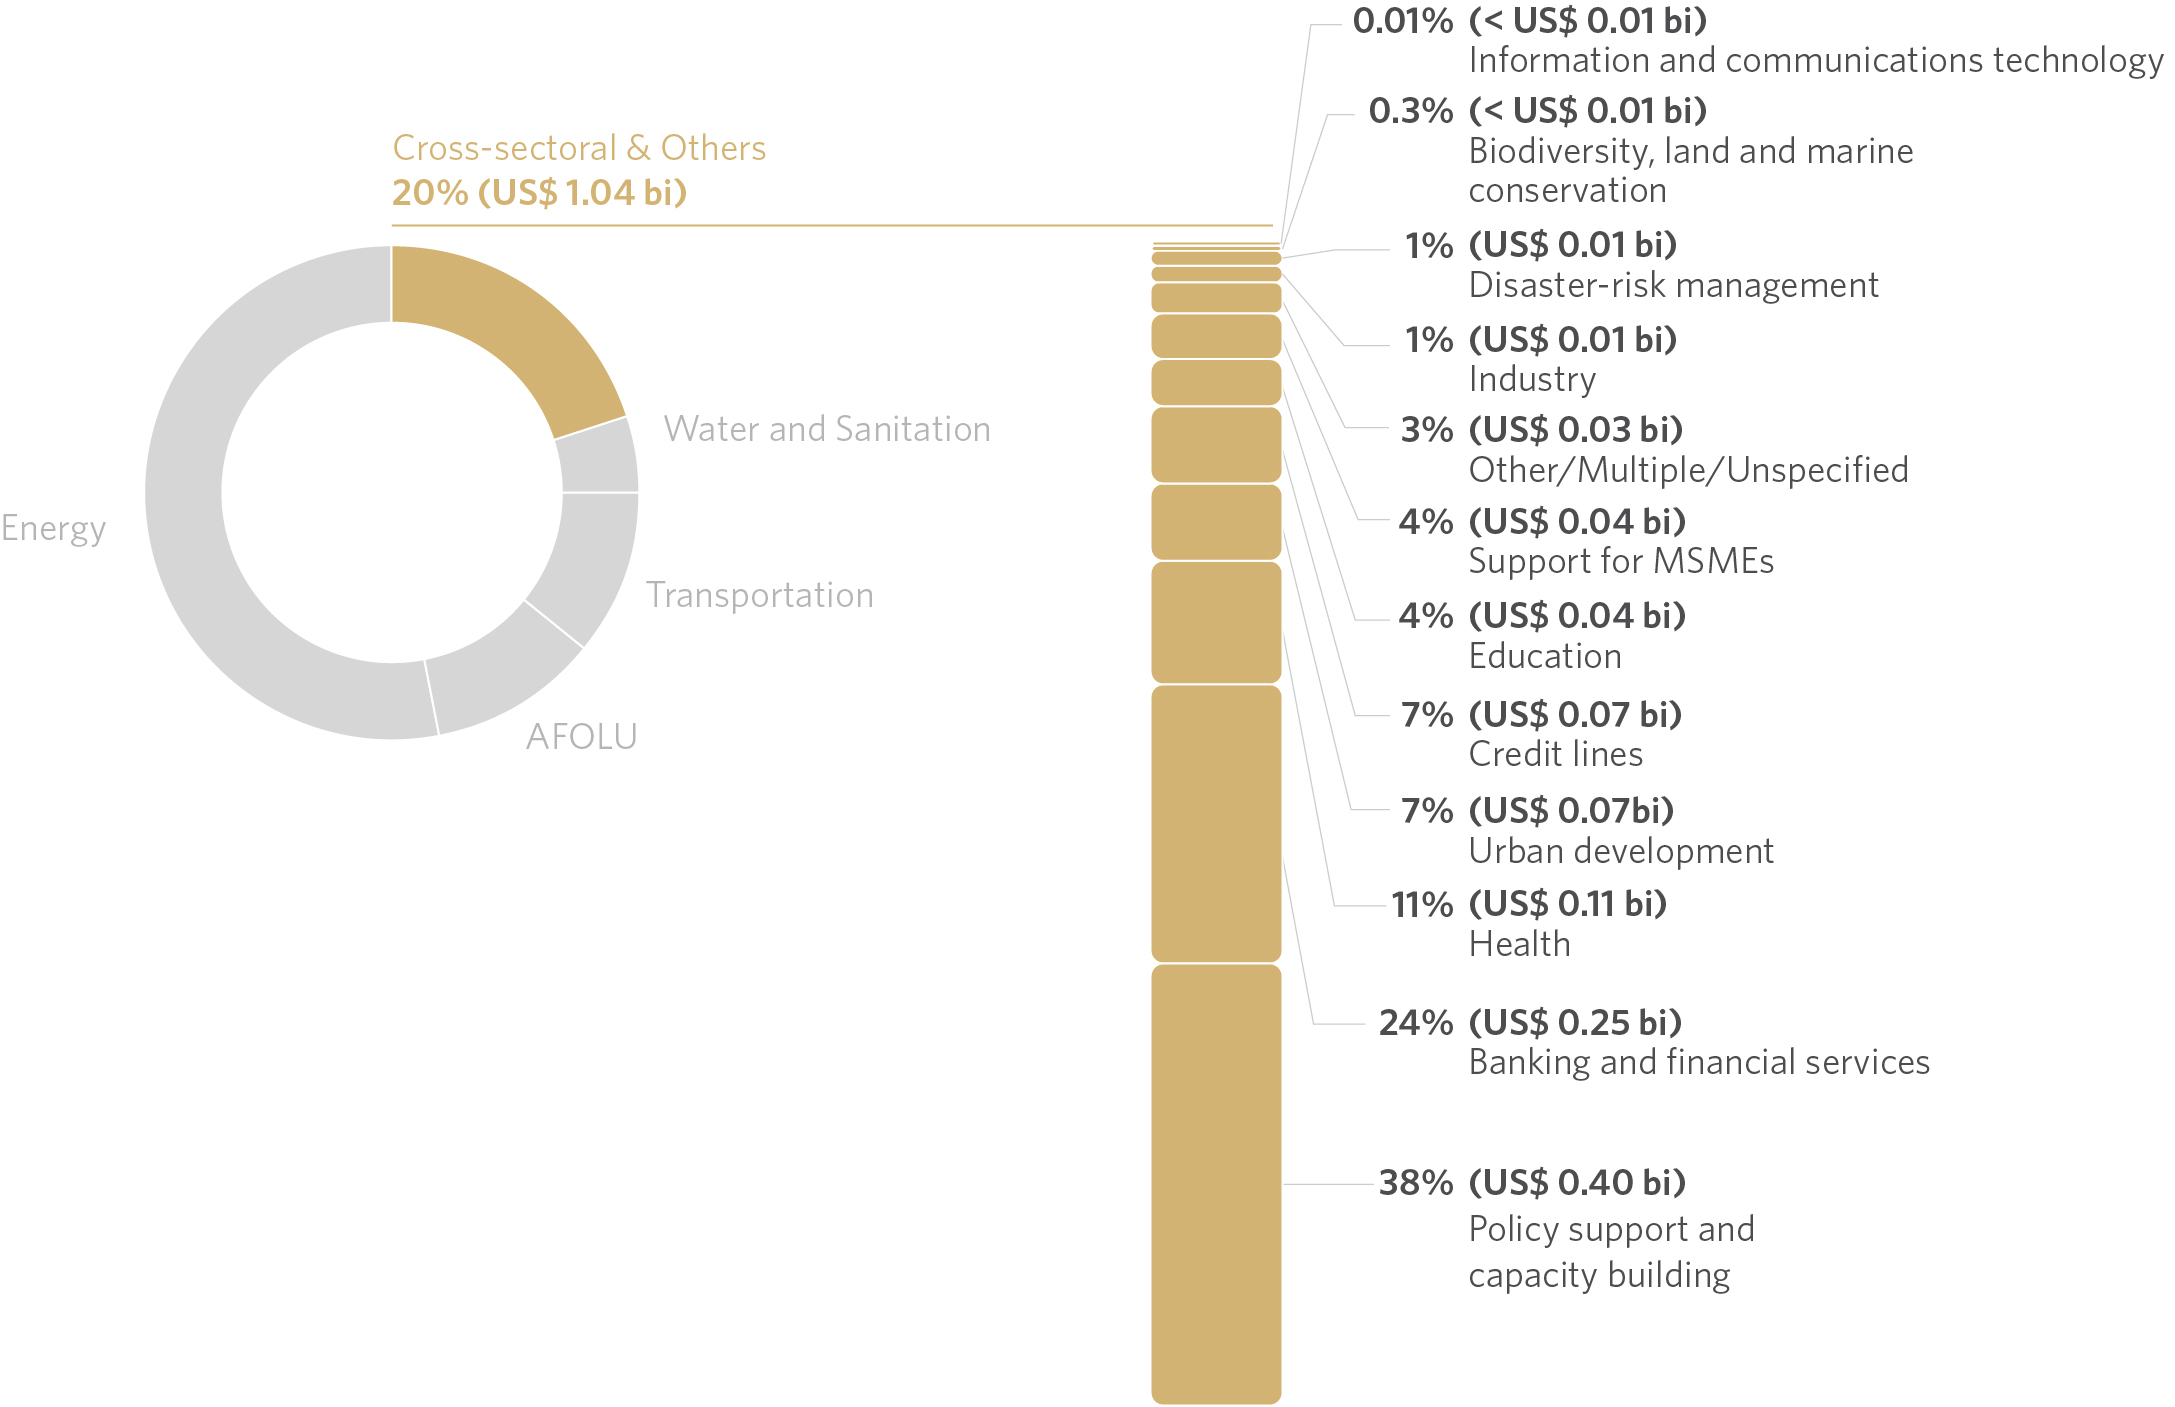
Source: CPI/PUC-RIO with data from BNEF (2024), Climate Funds Update via ODI/HBF (2024), IJ Global (2024), OECD-DAC Creditor System (2024), World Bank PPI (2024) and surveys with DFIs and IDFC members (CPI 2024), 2025
The sector “Cross-sectoral & Others” account for finance to projects that span multiple sectors (cross-sectoral) or that do not fit into the other categories (other). Of the total US$ 1.0 billion/year tracked for the cross-sectoral and other category in 2021–2022, 73% was directed to cross-sectoral projects, with a focus on policy support and capacity development (38%), banking and financial services (24%), and credit lines (7%), as well as support for MSMEs (4%).
Almost all of the financing for this sector (99%) came from public sources, especially multilateral DFIs (75%, or US$ 782 million/year) and bilateral DFIs (19%, or US$ 200 million/year), financing the building of national capacities to combat climate change. Credit was the instrument used for 90% of finance, with 74% (US$ 777 million/year) at commercial rates and 16% (US$ 163 million/year) at concessional rates.
Policy support and capacity development—which encompasses projects that strengthen government climate policies, environmental protection in general and civil society actions—received US$ 399 million/year in international finance in 2021–2022. Of this total, 91% was provided by multilateral DFIs, followed by governments (7%).
Finance for banking and financial services, which includes support for financial operations for sustainable development, amounted to US$ 250 million/year in 2021–2022. Of this total, 96% came from multilateral DFIs. Finance for climate credit lines from national financial institutions totaled US$ 69 million/year in 2021–2022.
Within the other category (accounting for 27% of the “cross-sectoral and other” category total), the health subsector totaled US$ 110 million/year in 2021–2022, with 72% of this going to strengthen the health system in Brazil.[16] Urban development projects totaled US$ 70 million/year in finance, 80% of which was provided by multilateral DFIs.
This study only registered US$ 5 million/year of international finance for the industry subsector in 2021–2022, with an emphasis on projects linked to the extraction of minerals critical to the energy transition. The methodological rigor of characterizing climate flows in this publication limits the ability to accurately measure international climate investment in Brazilian industry due to the limitations of the databases. However, Bloomberg’s Brazil Transition Factbook, dedicated to this data, indicates investments in clean industries in the country in the order of US$ 1.5 billion between 2018 and 2024 (Nunes et al., 2025), encompassing both national and international sources.
References
Arbache, Jorge and Emilio Lèbre La Rovere. Transição Energética e powershoring na América Latina e Caribe: Oportunidades, desafios e políticas públicas. Rio de Janeiro: Banco de Desenvolvimento da América Latina e Caribe (CAF), 2023. bit.ly/4epjMzS.
Brasil. Brazil’s NDC: National Determination to contribute and transform. 2024. bit.ly/4lkhvZl.
Buchner, Barbara, Baysa Naran, Rajashree Padmanabhi, Sean Stout, Constanza Strinati et al. Global Landscape of Climate Finance 2023. London: Climate Policy Initiative, 2023. bit.ly/4ecPj83.
Chakravarty, Malini, Uma Pal, Jaspreet Kaur, Anup Kumar Samal, Aanandita Sikka et al. Landscape of Green Finance in India. Climate Policy Initiative, 2024. bit.ly/461EQKu.
Chiavari, Joana, Priscila Souza, Miguel Motta, and Renan Florias and Eduardo Minsky. Landscape of Climate Finance for Land Use in Brazil 2021-2023. Rio de Janeiro: Climate Policy Initiative, 2024. bit.ly/4kp2FiZ.
de A. Fernandes, Pedro, Lwazi Gwebu, Lisa Johansson, Chavi Meatle, Jack-Vincent Radmore et al. The South African Climate Finance Landscape 2023. Presidential Climate Commission, South Africa, 2023. bit.ly/3ThkNQV.
FRED. Inflation, consumer prices for the United States. 2019-2022. Access date: June 18, 2025. bit.ly/3UhJixz.
Martins, André. Linha 6-Laranja pode ganhar mais seis estações antes da inauguração; veja detalhes. Exame. 2025. Access date: April 1, 2025. bit.ly/44j69yC.
Ministério do Meio Ambiente e Mudança do Clima (MMA). Plano Clima: Estratégias gerais e planos setoriais para mitigação e adaptação. nd. bit.ly/3SY15t9.
Naran, Baysa, Barbara Buchner, Matthew Price, Sean Stout, Maddy Taylor et al. Global Landscape of Climate Finance 2024: Insights for COP29. London: Climate Policy Initiative, 2024. bit.ly/3Yg9v1R.
Nunes, Vinicius, Rafael Rabliogio, and Luiza Demôro. Brazil Transition Factbook 2025. Bloomberg Philanthropies and BloombergNEF, 2025. bit.ly/44l5Jb4.
Organisation for Economic Co-operation and Development (OECD). OECD Economic Surveys: Brazil 2023. 2023. bit.ly/4l7Bn1z.
Sistema de Estimativa de Emissão de Gases (SEEG). Emissões Totais. 2023. Access date: June 27, 2025. bit.ly/443Iylx.
United Nations Climate Change- UNFCCC. Introduction to Climate Finance. nd. Access date: August 14, 2024. bit.ly/3Ujsabq.
Acknowledgments
This work is supported by a grant from Gordon and Betty Moore Foundation and Norway’s International Climate and Forest Initiative (NICFI). This publication does not necessarily represent the view of our funders and partners.
The authors would like to thank Maria Gabrielle Correa for research assistance, and Renan Florias and Julia Niemeyer for data processing. We would also like to thank Natalie Hoover, Giovanna de Miranda, Camila Calado, and Rafaela Cabral for editing and revising the text, and Nina Oswald Vieira and Meyrele Nascimento for formatting and graphic design.
[1] Launched by the Brazilian government in October 2024, BIP seeks to connect Brazilian projects with financial institutions interested in investing in three strategic sectors: natural climate solutions, industry and mobility, and energy.
[2] Eco Invest Brasil operates through four credit lines, which include a blended finance line to mobilize private foreign investment, a line to provide liquidity and mitigate the effects of exchange rate volatility, a mechanism to promote exchange rate hedging and credit aimed at structuring sustainable projects. These measures help to reduce the risks for international investors and increase Brazil’s attractiveness as a destination for climate investments.
[3] A total of US$ 4 billion in sustainable bonds were issued by the government between 2023 and 2024. These funds are intended to finance projects with a positive environmental and social impact, promoting investments that contribute to the country’s sustainable development.
[4] Established in 2008 to raise grants for investments in efforts to prevent, monitor and combat deforestation in the Amazon and paralyzed in 2019 after the Bolsonaro government proposed changes to the governance structure, the Amazon Fund resumed its finance in 2023 with the announcement of new contributions from donors and new disbursements for projects. By the end of 2023, the fund had already internalized US$ 700 million to finance efforts to prevent, monitor and combat deforestation, as well as promoting the conservation and sustainable use of the Legal Amazon.
[5] The cost of credit in the country is significantly higher than in developed countries (OECD 2023).
[6] The area deforested in the Amazon increased by 59.5% between 2019 and 2022, and there was a 38% drop in the number of fines imposed by the Brazilian Institute of Environment and Renewable Natural Resources (Instituto Brasileiro do Meio Ambiente e dos Recursos Naturais Renováveis – IBAMA) for crimes against flora, compared to the 2015-2018 period. A lack of transparency and unilateral changes to the Amazon Fund’s governance led to the fund being frozen in 2019, jeopardizing ongoing conservation projects. In addition, in an open letter, investment funds with US$ 3.7 trillion warned the government of Brazil in 2020 about the possibility of reconsidering investments due to the increase in deforestation.
[7] For multilateral institutions with a stake in Brazil, the integrity of the finance was considered including the portion of the financial flows that corresponds to the proportion of Brazilian share capital.
[8] Resources from multilateral organizations, such as development banks or multilateral funds, were considered in their entirety, regardless of Brazil’s financial participation in these organizations.
[9] This work adopted a taxonomy of sectors, subsectors, and solutions similar to the Climate Finance Landscape for Land Use in Brazil (Chiavari et al. 2024), published in October 2024, but with some distinctions. Finance for bioenergy and biofuels, which was highlighted in the report for land use, is portrayed here in the energy sector. The results found are 10.4% higher than those tracked in the development and international cooperation section in Chiavari et al. (2024). However, the messages and trends remain consistent.
[10] Tracked finance from multilateral organizations is presented in the “region of origin” category according to each country’s proportional contributions to the organizations’ total capital.
[11] The “Other” origin category includes flows from countries not included in the other regions and international flows from countries of unknown or confidential origin.
[12] These institutions share detailed information about their portfolios with CPI on the condition that it will be used exclusively for aggregate analysis and reporting. Ownership of the data remains with the institutions that provided it, and CPI is not authorized to publicly disclose institution- or project-specific data.
[13] In both biennia, the tracking methodology for multilateral climate funds only considered projects for which information on the amount of finance for Brazil was available.
[14] In 2021–2022, 91% of global climate finance was directed toward mitigation.
[15] BNEF estimated that the addition in installed solar energy capacity in Brazil increased from 3 GW/year in 2019 to 14 GW/year in 2022.
[16] The projects targeting the health sector came mostly from the Organisation for Economic Co-operation and Development (OECD) database, which identified components directly linked to climate adaptation among international finance for health in Brazil and highlighted these values among the total projects.
