The recent meeting of APEC produced, among other things, a non-binding agreement that the APEC bloc countries would, by 2035, reduce energy intensity levels by 45% from 2005 levels. While this agreement has received only a modest coverage, some analysts have suggested that the agreement could be an important example for future international agreements and would, if followed, lead to significant decreases in energy consumption and Carbon emissions. Upon closer inspection, the agreement is really only a codification of Business As Usual (BAU) and serves to demonstrate some of the challenges of using energy intensity as a metric. The agreement also highlights some of the politics behind negotiating some of these types of targets.
Beyond the usual questions about the effectiveness of voluntary agreements or targets, two important questions emerge about the targets themselves:
- How difficult would a 45% reduction be to achieve for APEC as a whole? How much additional action would be required?
- How would the burden be shared, or how difficult would it be for each country to achieve a 45% reduction individually?
The first question is easier to answer than the second. If history is any guide, the answer appears to be that even if these targets were mandatory, they might not require any new action. In annual terms, a 45% reduction over 25 years would equate to an average decrease of 2.4%. However, since the base year is 2005 and energy intensity declined slightly between 2005 and 2010, the actual target is somewhat lower at 2.26%. Using International Energy Agency (IEA) data, we find that from 1990-2009 energy intensity fell an average of 0.88% per year in APEC countries in USD dollar terms, using contemporaneous exchange rates. Thus, the commitment would seemingly equate to a 1.4% improvement over the path of the last 19 years. Great, we seem to have agreement for real improvement.
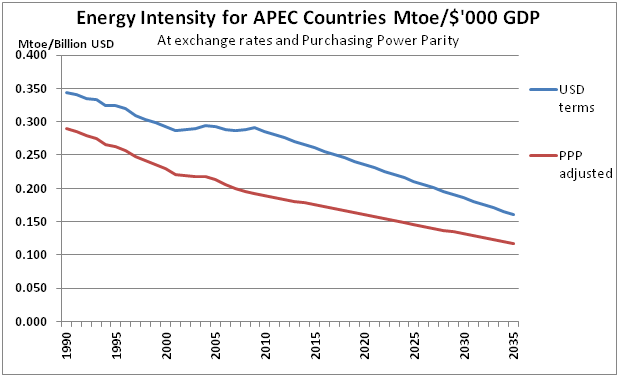
The problem with this analysis is that a major reason why energy intensity (in USD terms) has not increased more rapidly since 1990 has been artificial exchange rate policies. If a country keeps its currency artificially weak, then its economic growth and total economic output will be lower in dollar terms, resulting in higher energy intensities (and a slower decline in energy intensity) as energy intensity is merely energy use divided by economic output. A target expressed in dollar terms at prevailing exchange rates could be easily met by allowing the dollar to devalue against other currencies, without the need for any specific energy intensity improving measures.
Economists use Purchasing Power Parity (PPP) to adjust for the vagaries of volatile exchange rates and to approximate a long term equilibrium exchange rate. If you use PPP rather than exchange rate adjusted GDP you get a very different story on energy intensity.
|
Average Yearly Improvement in Energy Intensity |
||||
|
1971-2009 |
1990-2009 |
Target 2009-2035 |
Target versus BAU |
|
| IEA – Mtoe/GDP |
N/A |
0.88% |
2.26% |
1.38% |
| IEA – Mtoe/GDP (PPP) |
N/A |
2.12% |
1.90% |
-0.22% |
| Without Russia | ||||
| IEA – Mtoe/GDP |
0.99% |
0.41% |
2.29% |
1.88% |
| IEA – Mtoe/GDP (PPP) |
1.85% |
1.85% |
1.92% |
0.07% |
Source: IEA, CPI Calculations
The IEA numbers in the table below show that on a PPP based GDP figure, energy Intensity for APEC countries fell on average 2.12% since 1990 and a similar amount since 1971 (taking Russia out of the equation due to data problems pre-1990). Furthermore, as PPP adjusted energy intensity fell much faster than the required pace between 2005 and 2009, the overall target falls to 1.9% per year from 2010. In other words, the target is actually less than the trajectory that we have been following for the last 20 years. Charting the data makes the case even more clear, the new commitment just maintains the current trend.
|
Average Yearly Improvement in Energy Intensity |
||||
|
1971-2009 |
1990-2009 |
Target 2009-2035 |
Target versus BAU |
|
| US |
2.00% |
1.84% |
1.94% |
0.10% |
| Canada |
1.28% |
1.28% |
1.90% |
0.62% |
| Mexico |
-0.41% |
0.61% |
2.24% |
1.63% |
| Australia |
0.58% |
1.03% |
2.25% |
1.23% |
| Japan |
1.14% |
0.47% |
1.99% |
1.52% |
| Korea |
0.16% |
0.40% |
2.13% |
1.73% |
| Russia |
1.76% |
1.76% |
0.00% |
|
| Indonesia |
1.10% |
0.90% |
1.86% |
0.96% |
| Thailand |
0.35% |
-0.62% |
2.17% |
2.79% |
| China |
4.02% |
4.76% |
1.72% |
-3.04% |
These three countries are the largest and most powerful of APEC and also had the economies that were the most carbon intensive for their size. Although each – and in particular China – could rightfully argue that as a result of their recent performance the gap has narrowed and that further improvements in energy intensity will be more difficult, they remain relatively energy intensive (along with Canada and Australia) and could find reaching the targets easier.
