When the River Runs Dry: How Amazon Deforestation Threatens the Brazilian Economy
Introduction
Water is a cornerstone of the Brazilian economy and society, underpinning both productive sectors and social well-being in multiple ways. In the power sector, hydroelectric plants are responsible for more than half of the country’s electricity generation.[1] In agriculture, dependence on rainfall is equally pronounced: only 13% of farmland is irrigated, making stable and sufficient water supply essential for crop productivity.[2] The availability of fresh water is also critically important for urban and rural water supply, basic sanitation, public health, and the extensive river network that supports the transportation of key commodities like soybeans and corn. Beyond its economic and social roles, water is vital for ecological resilience, sustaining healthy forests and helping to prevent large-scale fires.
Since at least the early 2000s, growing evidence has underscored the important role of the Amazon forest for regulating rainfall patterns across Brazil.[3],[4],[5],[6] By retaining and returning the water it absorbs from rainfall back into the atmosphere, the forest enables wind currents to carry moisture along their paths—creating what are known as “flying rivers”. These flying rivers extend across much of the country, contributing to rainfall in the North, Midwest, South, and large parts of the Southeast. By sustaining the water cycle and feeding the flying rivers that distribute moisture across the country, standing forests perform an essential function for society, serving as a vital engine of the national economy.
The continued advance of deforestation, which has already destroyed about 20% of the biome, threatens this natural water supply system. Research has shown significant impacts of historical deforestation on the potential productivity of the country’s hydroelectric sector. Estimates suggest that the Teles Pires hydropower plant (HPP) loses an average of US$ 21 million per year, while studies by CPI/PUC-RIO point to annual losses of approximately US$ 91 million for the Itaipu HPP and US$ 117 million for the Belo Monte HPP.[7],[8]
Researchers from Climate Policy Initiative/Pontifical Catholic University of Rio de Janeiro (CPI/PUC-RIO) and the Amazon 2030 project note that the effects of Amazon deforestation extend beyond hydroelectric power generation, potentially reaching other strategic sectors of Brazil’s economy. This report begins to examine the consequences for agriculture, river transport, urban water supply, and fire resilience. Recent advances in computational capacity and new empirical approaches, combined with satellite data on winds, rainfall, land use and forest cover, now make it possible to measure the significance of the flying rivers with unprecedented precision.
Projections indicate that by 2050, between 10% and 47% of the forest will be exposed to disturbances capable of triggering forest transitions and undermining ecological integrity, with serious implications for ecosystem services.[9] By quantifying the value of the standing forest, this report highlights that protecting the Amazon is not merely an environmental goal—it is a strategic imperative and a matter of national interest.
The Trajectories of Flying Rivers
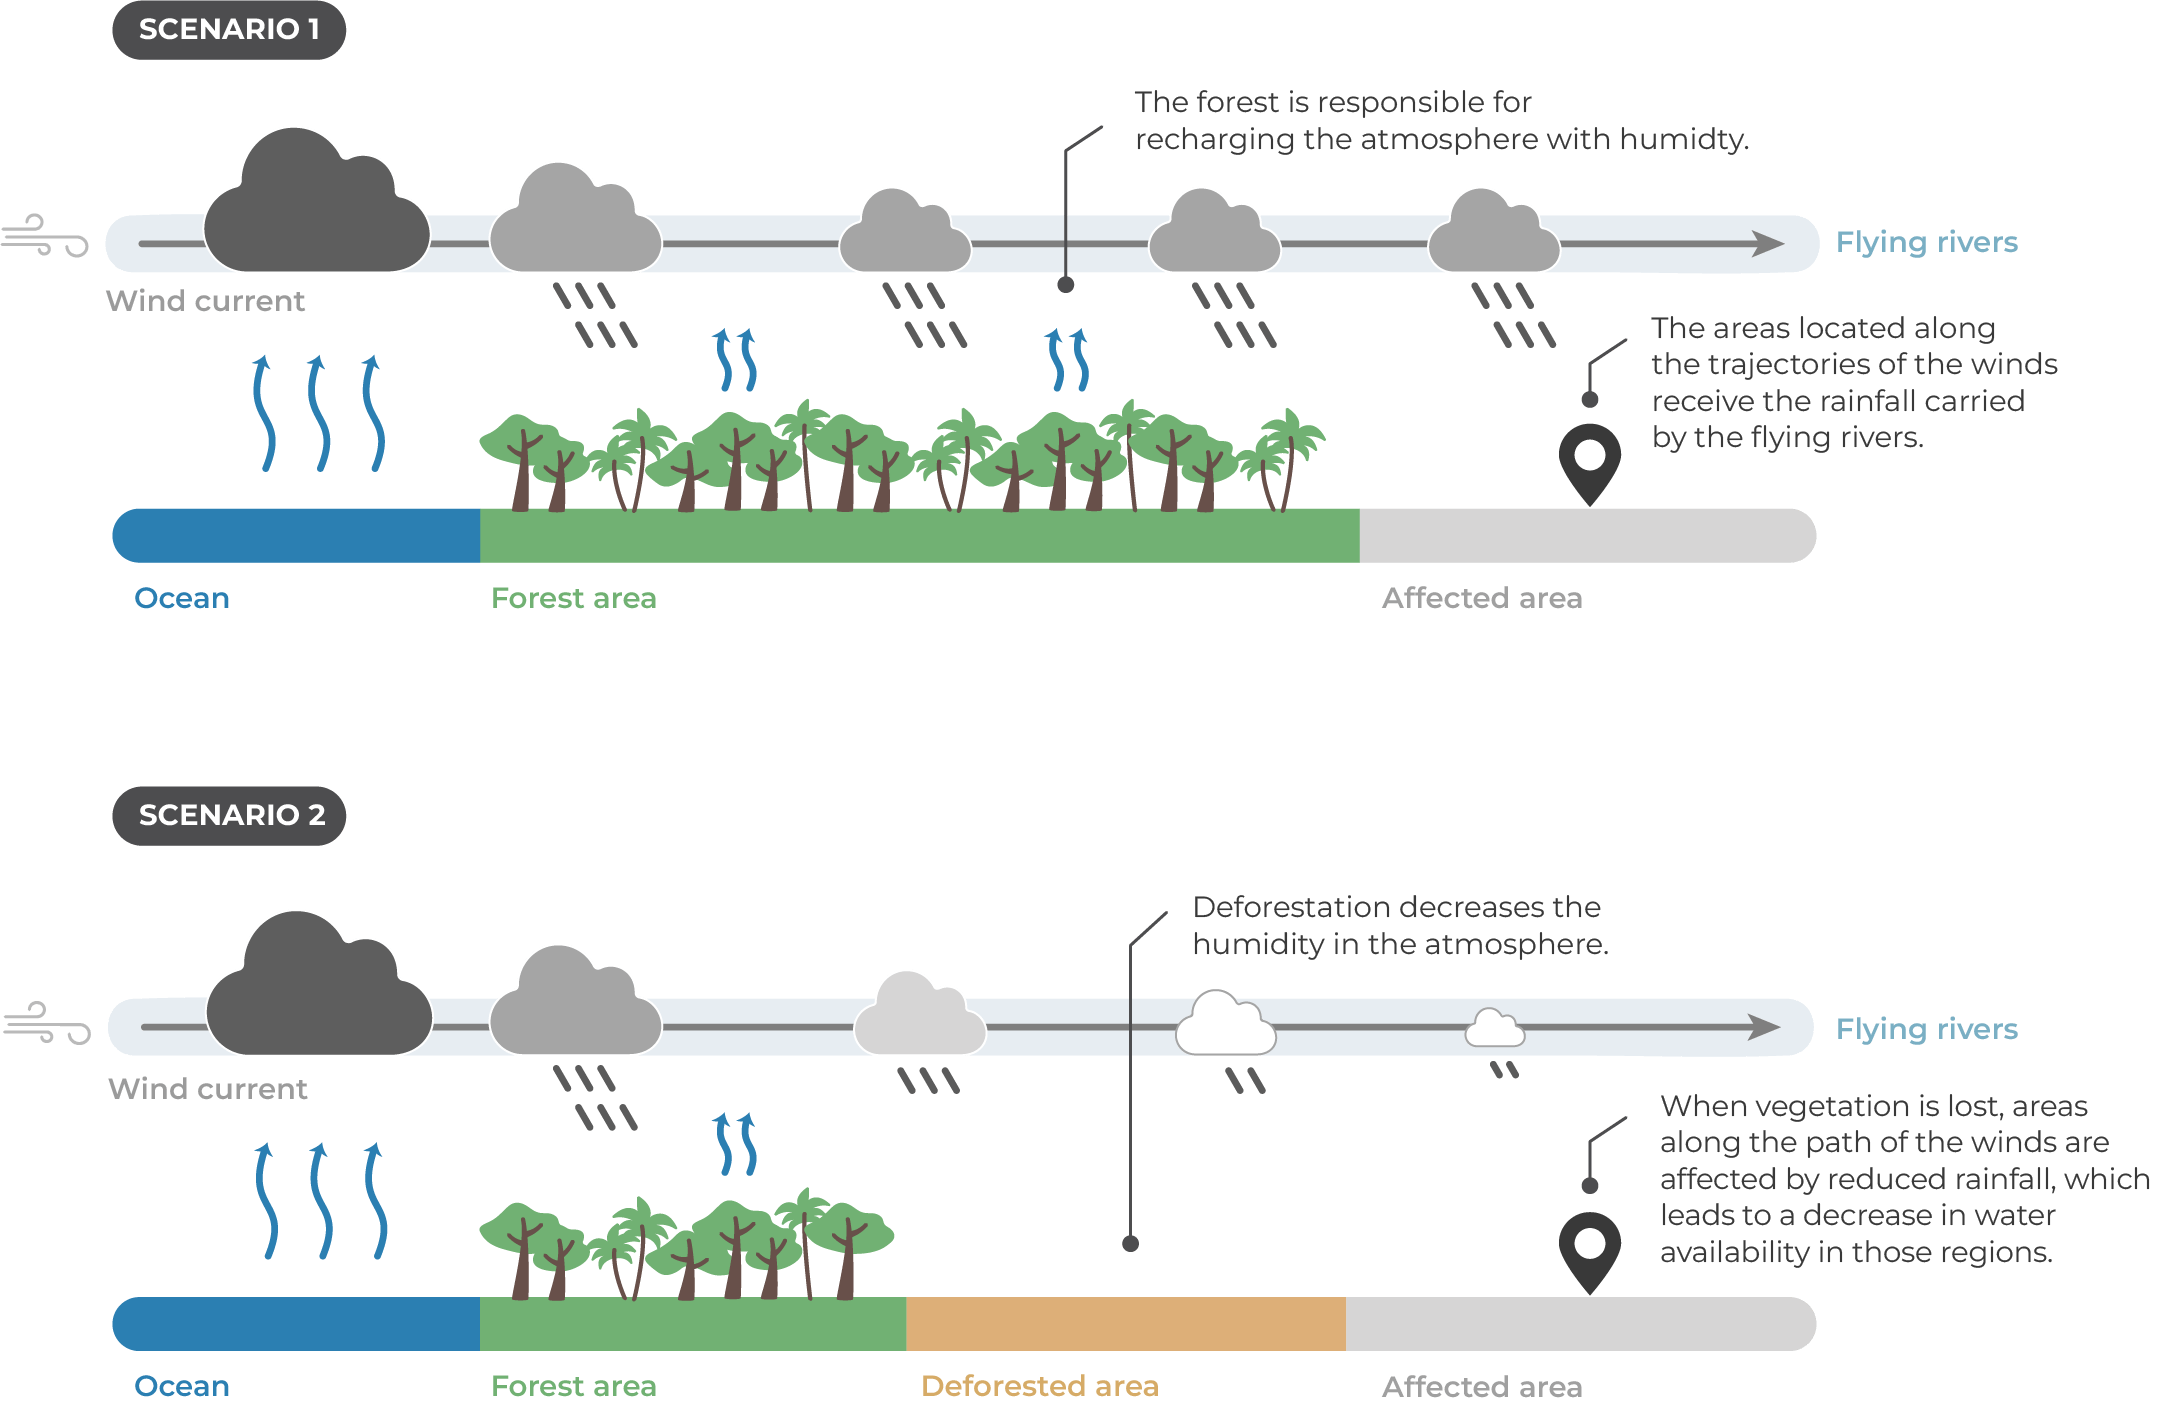
The Amazon Forest has the capacity to keep the atmosphere humid both inside and outside the biome. Water carried by wind currents originating in the Atlantic Ocean precipitates as rain when it reaches the continent. In its natural cycle, rainwater penetrates the soil and flows into rivers, which return it to the oceans. However, when rainwater falls in a tropical forest, part of it is returned to the atmosphere through evapotranspiration. When wind currents pass through the forest, they carry this moisture, which is redistributed in the trajectory of the winds in the form of rain. Figure 1 illustrates the mechanism of flying rivers. When vegetation is lost—as occurs through deforestation—the forest loses its ability to recharge the atmosphere, reducing rainfall along wind trajectories.
Figure 1. Flying Rivers and the Impact of Deforestation
Source: CPI/PUC-RIO, 2025
In South America, winds from the Atlantic Ocean cross the Amazon Forest and, in the west, meet the Andes Mountains, forcing them to travel across the continent from North to South. Figure 2 shows typical trajectories of flying rivers. Along this route, the winds cross the biome and traverse much of the country, reaching as far as the southern states. As can be seen in the figure, the trajectories also pass through regions that have already been anthropized, indicating the potential influence of deforestation on reducing the flow of water transported by flying rivers.
Figure 2. Typical Trajectories of the Flying Rivers in Brazil
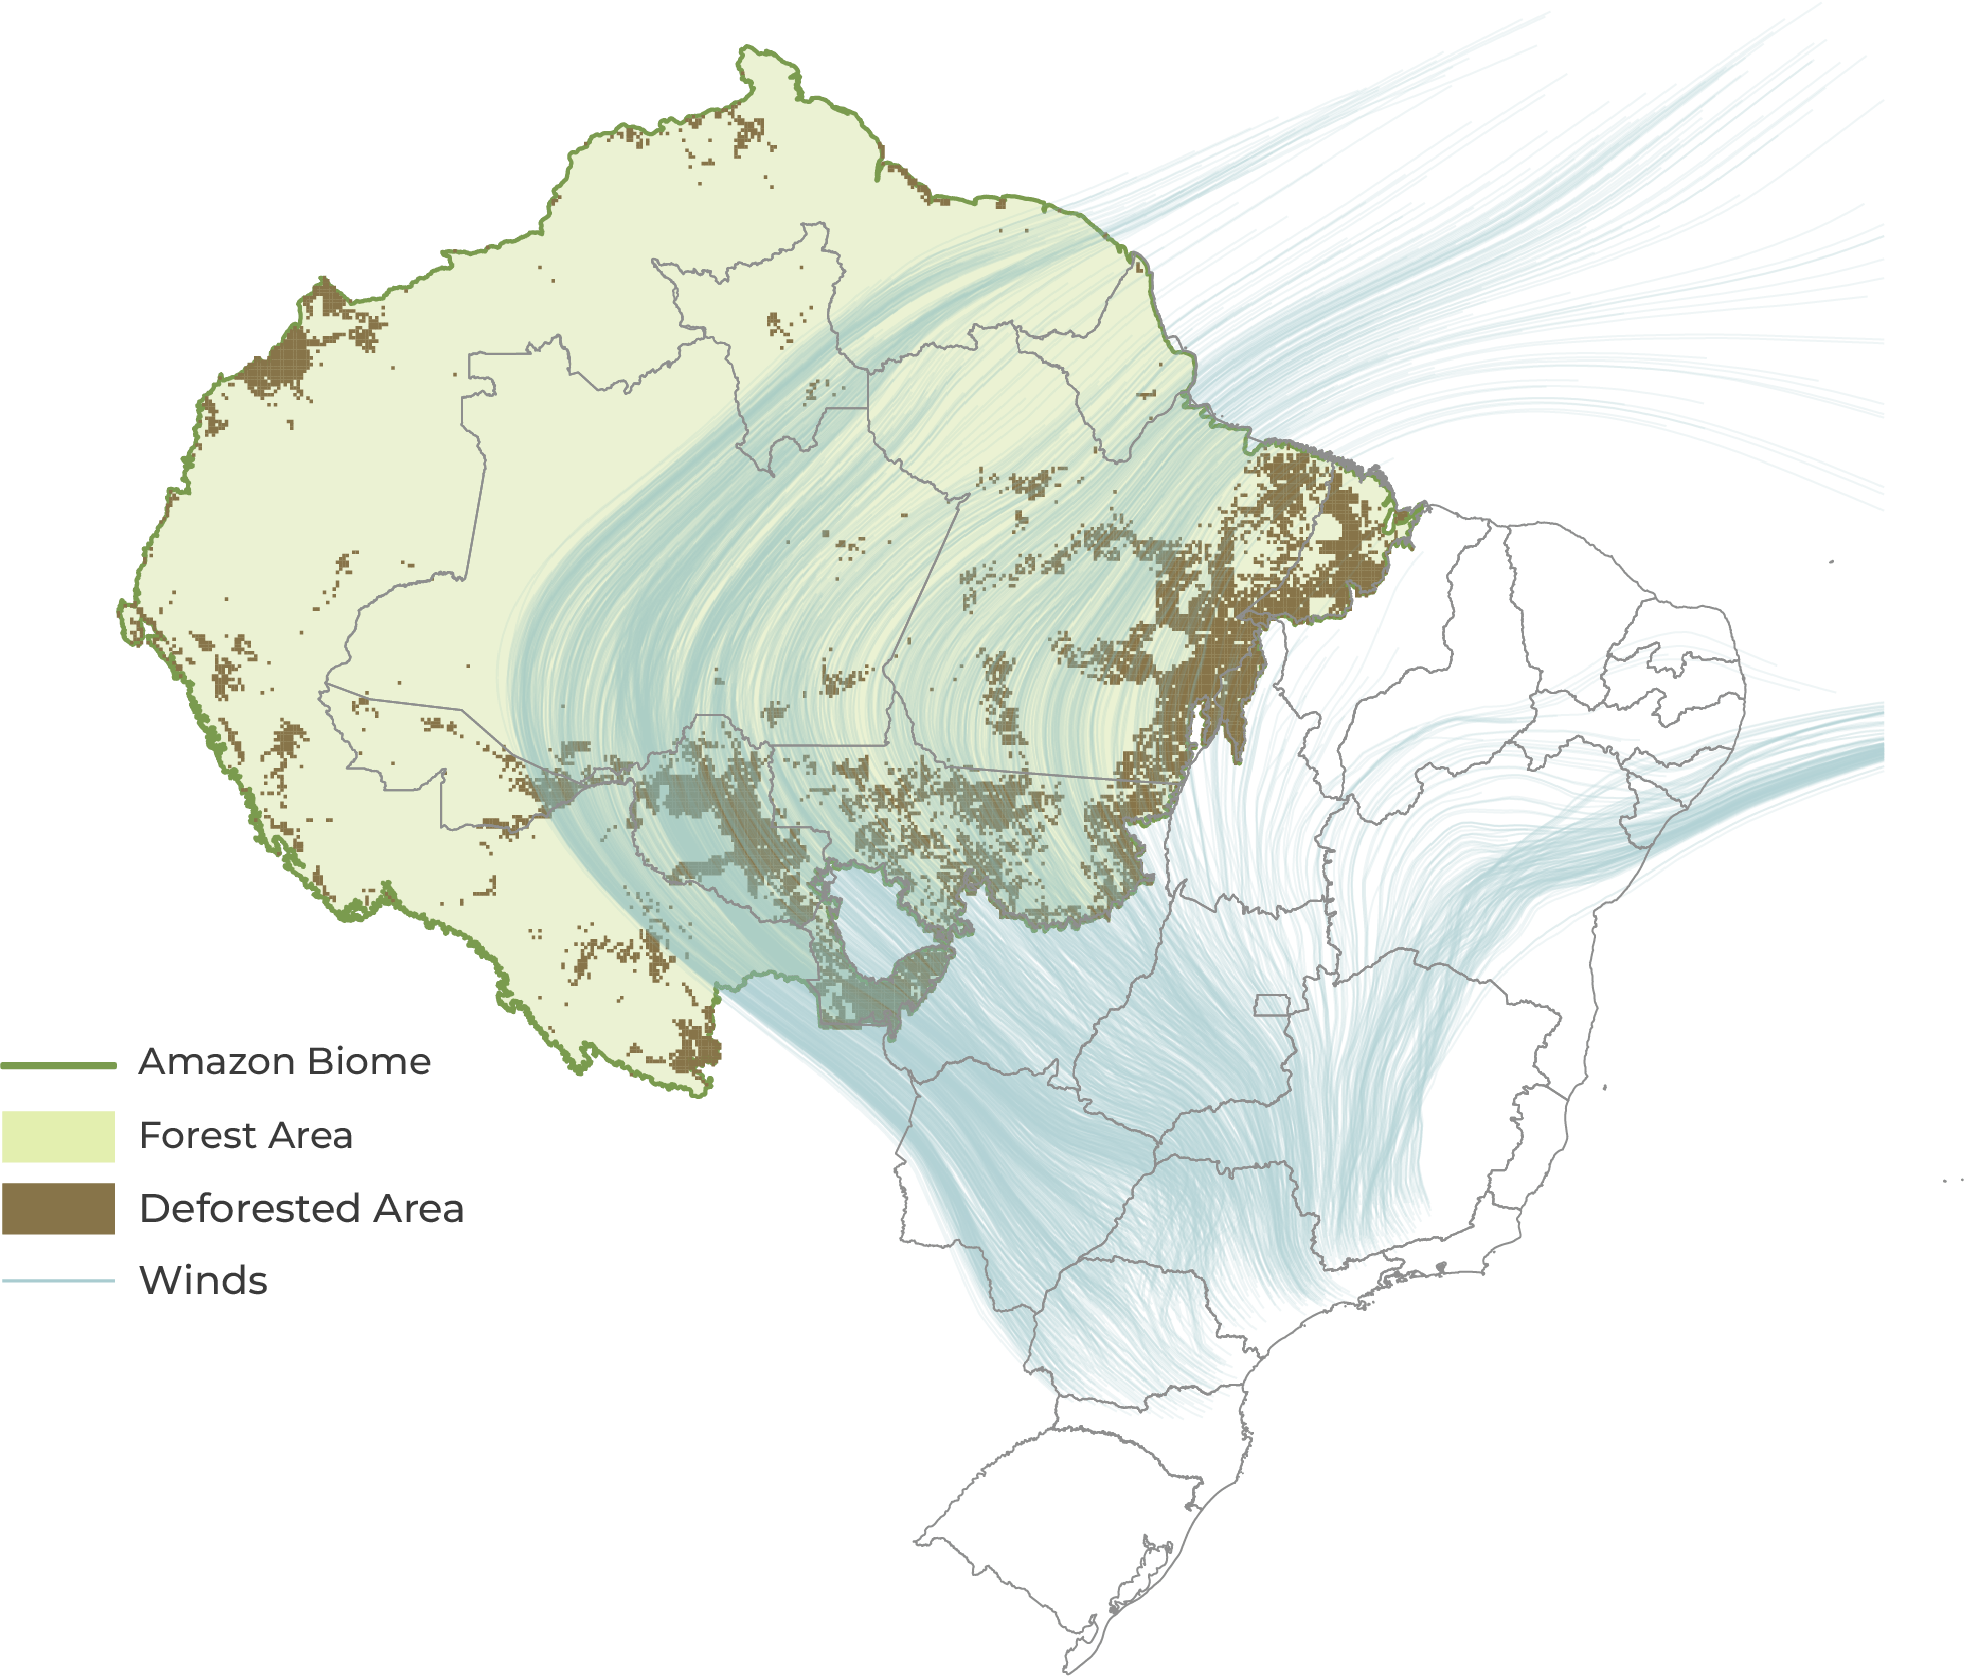
Source: CPI/PUC-RIO with data from Copernicus-ERA5 (2023) and MAPBIOMAS (2023), 2025
Using high-frequency wind and rainfall data from various points across the country, as well as land cover data and empirical strategies, this work aims to measure the effects of flying rivers and the influence of the Amazon deforestation on rainfall distribution in Brazil. This report presents evidence of the impacts of deforestation on the country’s main HPPs. Next, it highlights the potential relationship between flying rivers and water supply in urban centers, agriculture, wildfires, and river transport.
Evidence of the Impact of Deforestation on Power Generation
Brazil’s electricity matrix is recognized as one of the cleanest in the world, with 88% of its energy generated by renewable sources—approximately three times the global average.[10] This high share is largely due to the country’s extensive network of HPPs, which in 2024 accounted for 56% of national generated electricity.[11]
Reliance on hydropower offers clear advantages, including low operating costs and greenhouse gas (GHG) emissions. However, it also exposes the system to vulnerabilities during periods of water scarcity. According to the Energy Research Office (Empresa de Pesquisa Energética – EPE) and the National Electric System Operator (Operador Nacional do Sistema Elétrico – ONS), the amount of water reaching the plants has been below historical averages since 2014. Prolonged droughts have increased the risk of power shortages and blackouts.[12],[13],[14],[15] In response, energy planners have adjusted their forecasting models to consider more adverse hydrological scenarios.[16]
Several factors contribute to these critical scenarios, with deforestation playing a significant role.[17] Recent studies show that the removal of natural vegetation directly alters rainfall patterns, affecting hydroelectric generation. An analysis of the Teles Pires HPP found that deforestation reduced its power generation potential by 2.5% to 10%, depending on the month, representing an annual revenue loss of around US$ 21 million.[18] Results from CPI/PUC-RIO show similar results when assessing the impacts of deforestation on the Itaipu and Belo Monte HPPs. Researchers identified that, together, the plants lost the potential to generate 3,700 GWh per year— equivalent to the annual electricity consumption of the state of Rondônia. From a financial standpoint, the potential loss exceeds US$ 200 million annually.[19]
These findings clearly show that deforestation affects rainfall distribution both within and beyond the biome. As illustrated in Figure 3, most hydropower plants are located along the trajectory of the flying rivers. Notably, 17 of the 20 largest run-of-river HPPs—those with limited water storage capacity—are particularly sensitive to rainfall fluctuations. If these impacts occur at scale, they could already be contributing to increased reliance on more expensive and polluting thermoelectric generation to meet demand. This, in turn, would drive up electricity prices for consumers and lead to higher GHG emissions.
Figure 3. Trajectory of Flying Rivers through 17 of the 20 Largest Run-Off-River HPPs in Brazil’s Electricity Matrix
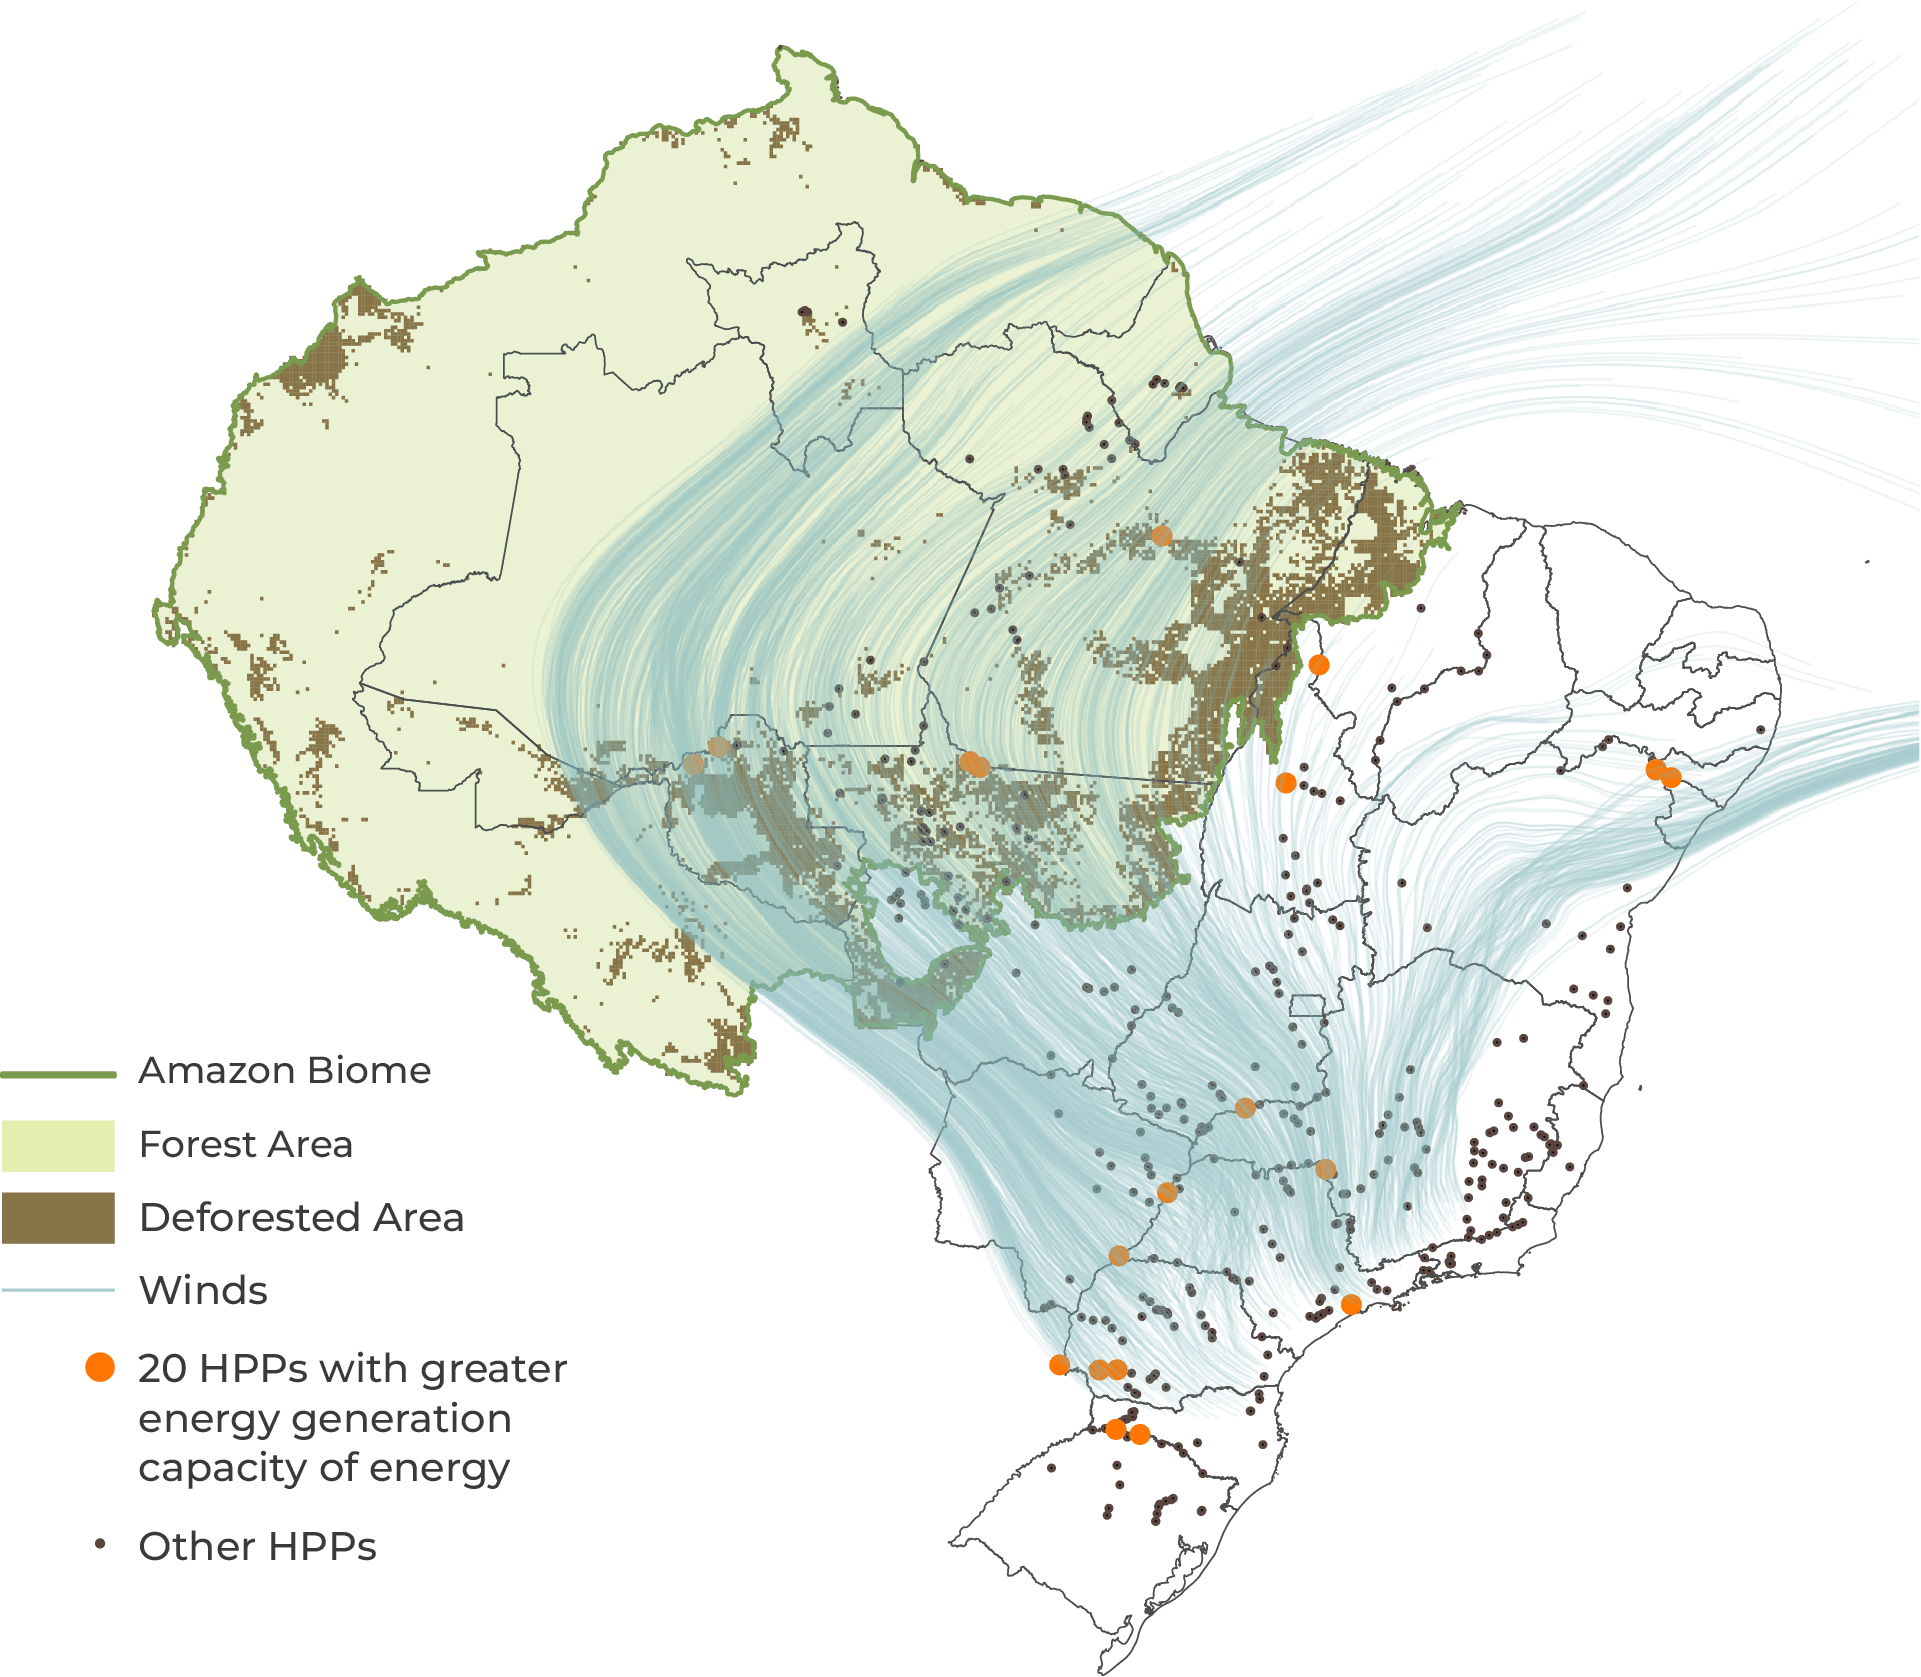
Source: CPI/PUC-RIO with data from Copernicus-ERA5 (2023), ONS (2023), and MAPBIOMAS (2023), 2025
CPI/PUC-RIO also identifies the forest regions most relevant to the operation of each plant, which are those through which wind trajectories most frequently pass before reaching the rainfall area that feeds each HPP. In Figure 4, these regions are presented for Itaipu and Belo Monte HPPs. This analysis enables the identification of priority areas for forest protection based on their contribution to the operation of the plants.
Figure 4. Forest Regions with Greatest Influence on Itaipu and Belo Monte HPPs
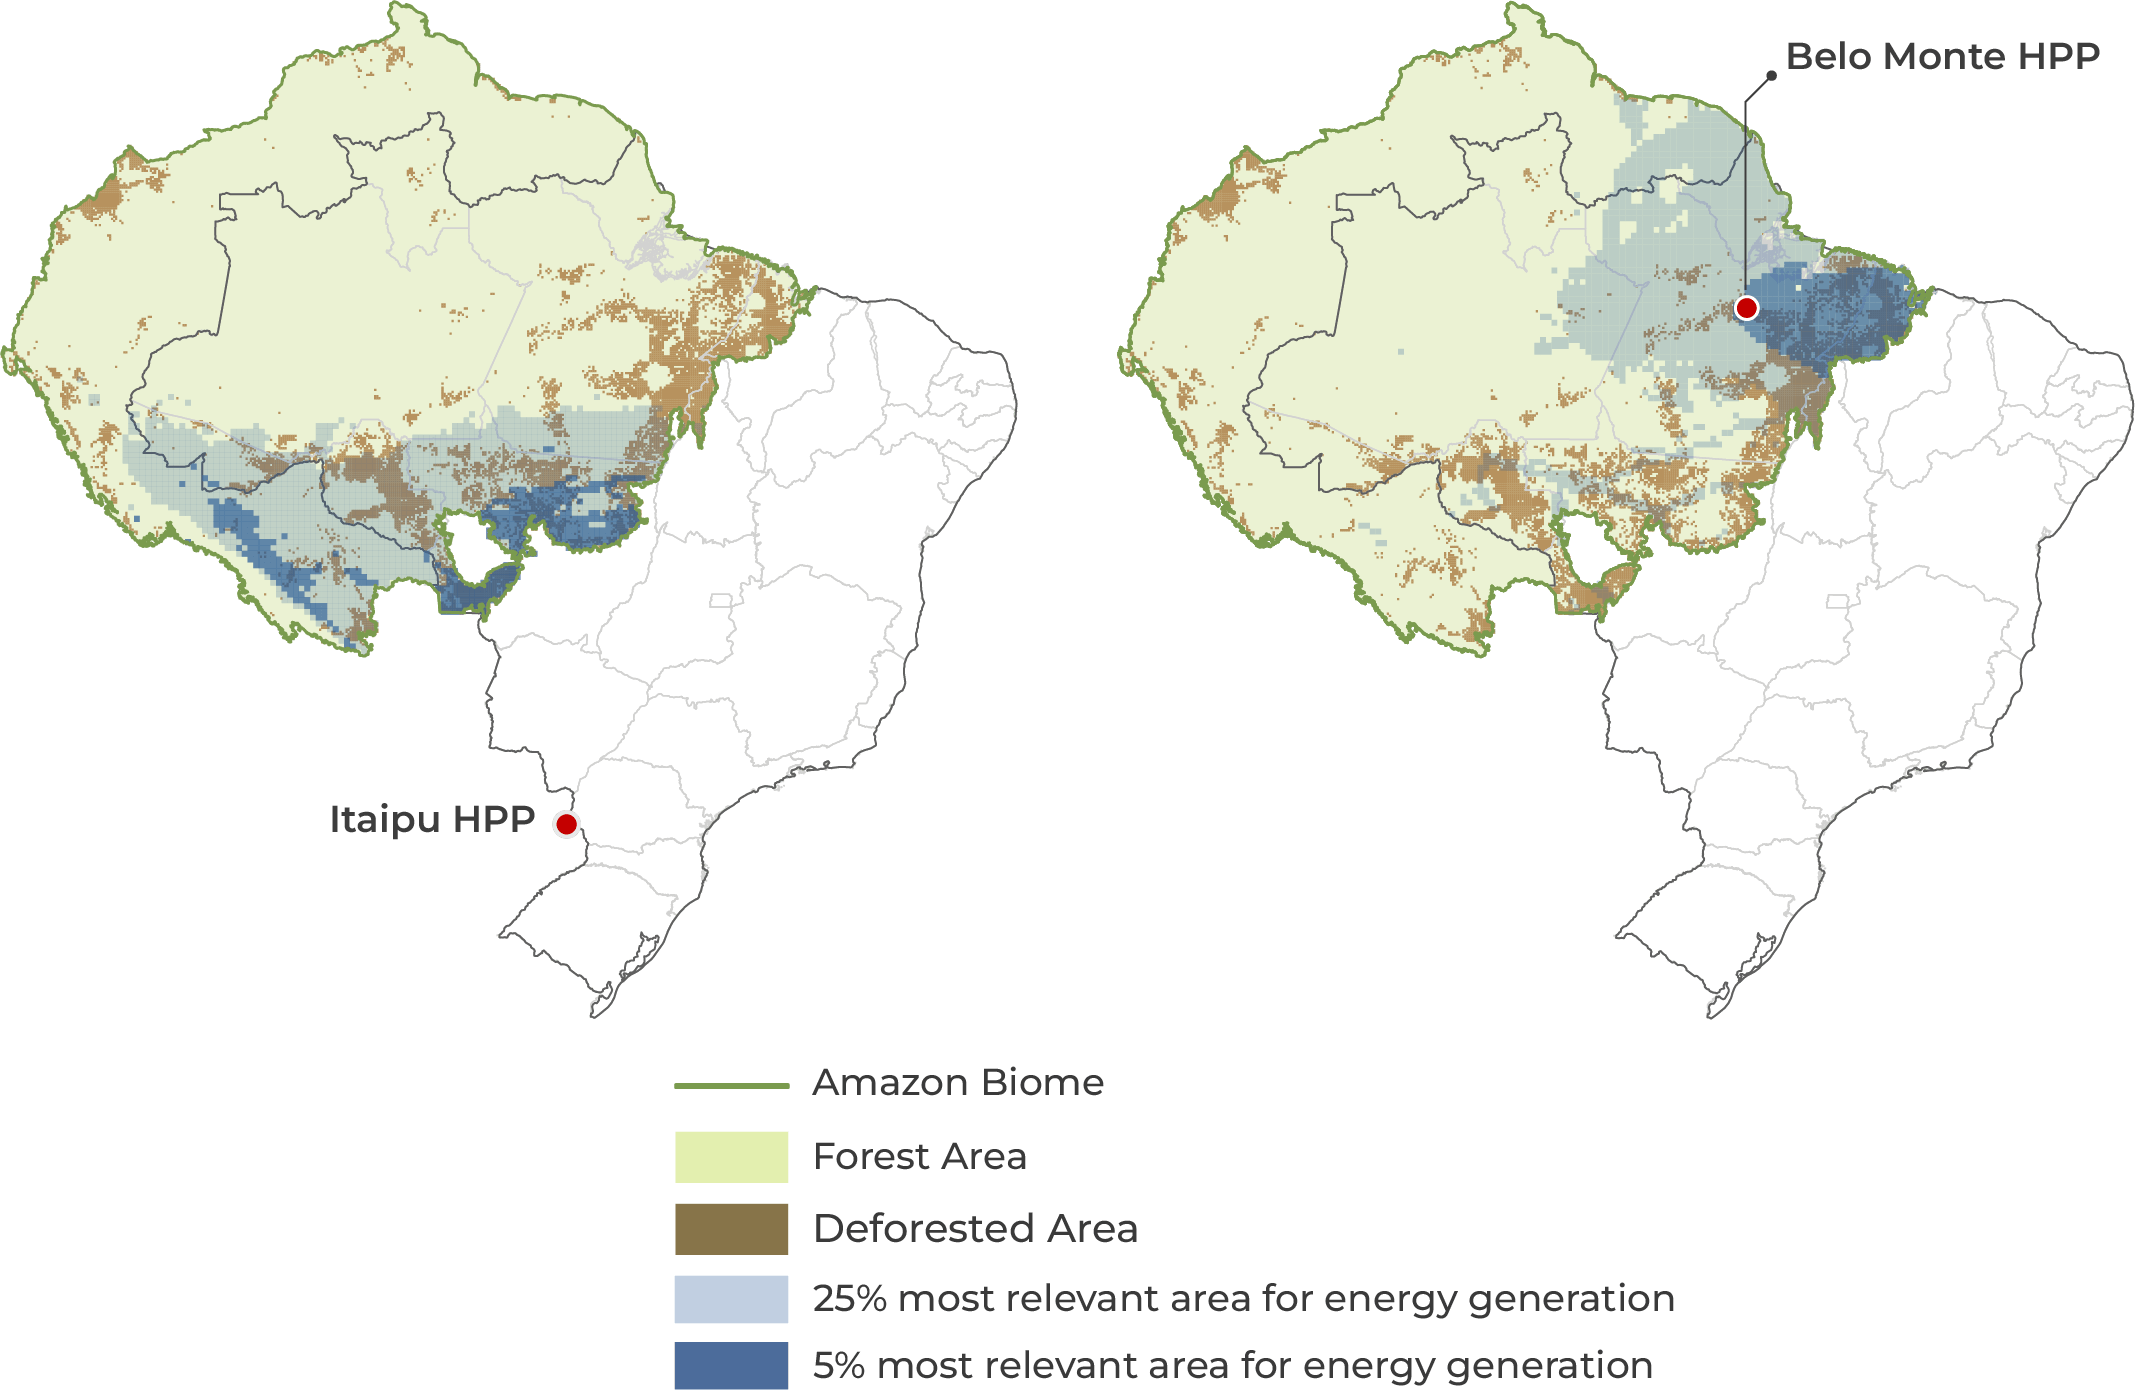
Source: CPI/PUC-RIO with data from Copernicus-ERA5 (2023), ONS (2023), CCEE (2023), and MAPBIOMAS (2023), 2025
These results highlight the critical role of the Amazon forest in sustaining Brazil’s electricity sector. As deforestation advances, the Amazon loses its ability to feed the flying rivers, disrupting rainfall patterns across the country. For the electricity sector, this means reduced electricity supply for millions of people and potential revenue losses in the millions of dollars for hydroelectric plants. The following section explores how flying rivers influence other sectors of the Brazilian economy, highlighting the potential economic losses and social costs that deforestation may already be causing.
Potential Economic Consequences of Deforestation
Flying rivers cover a vast portion of Brazil, encompassing strategic regions that support different economic sectors that are heavily dependent on water availability. The forest’s influence on each of these areas illustrates its importance to the national economy and reinforces the need for its protection.
Water Supply in Urban Centers
Access to water and basic sanitation is recognized as a fundamental human right by the United Nations (UN).[20] Despite being home to the largest share of the world’s freshwater resources Brazil continues to face supply problems, even in urban centers with established infrastructure.[21]
Prolonged droughts have led to reoccurring water supply crises that directly affect the population. The Cantareira system, for example, which supplies about 9 million residents in São Paulo, has repeatedly reached critical levels.[22],[23] Since 2014, the system has faced prolonged drought conditions.[24] The São Paulo State Basic Sanitation Company (Companhia de Saneamento Básico do Estado de São Paulo – SABESP), its operator, classifies the current system condition as on alert and has adopted measures to preserve the supply.[25]
Figure 5 shows that, like the Cantareira system, other regions with high population density and, consequently, high demand for water supply and sanitation, are also located along the trajectories of the flying rivers. The reduction in rainfall resulting from Amazon deforestation has the potential to affect the country’s water supply and sanitation capacity. These effects may include an effective reduction in access to water for the population and operational losses for companies in the sector.
Figure 5. Trajectory of Flying Rivers through Strategic Water Supply Areas in Brazil

Source: CPI/PUC-RIO with data from Copernicus-ERA5 (2023), ANA (2020), and MAPBIOMAS (2023), 2025
Agriculture
The agriculture sector plays a central role in Brazil’s economy. In 2024, it accounted for 5.5% of the gross domestic product (GDP), and when considering the broader agribusiness production chain, its contribution reached almost 24%.[26],[27] Globally, the importance of Brazilian agriculture is equally significant: in 2024, Brazil was the largest producer of soybeans, coffee, orange juice, and sugar; the second-largest producer of beef and chicken; and the third-largest producer of corn and cotton.[28]
A striking feature of Brazilian agriculture is its dependence on rainwater.[29] In 2022, only 13% of agricultural land was irrigated, leaving most production highly exposed to fluctuations in precipitation.[30] This dependence has already translated into considerable economic losses. According to the National Confederation of Municipalities (Confederação Nacional de Municípios – CNM), between 2013 and 2022, the country lost an estimated US$ 34 billion in crops and US$ 12 billion in livestock due to drought.[31]
As shown in Figure 6, the trajectories of flying rivers overlap with Brazil’s main agricultural regions. In the blue areas, which are widely distributed throughout the territory, soybean production (safra) is associated with the production of another crop, such as corn (safrinha), taking advantage of the soil at different times of the year. Sugarcane production is also highly concentrated in the trajectories of flying rivers, particularly in the state of São Paulo.
The extensive intersection between the trajectory of flying rivers and key agricultural regions highlights the sector’s vulnerability to deforestation. By regulating hydrological cycles, the Amazon forest plays a central role in supplying water for agricultural production. Reduced rainfall caused by deforestation, combined with limited irrigation coverage, may already be contributing to the losses observed during droughts. Deepening the understanding of this causal relationship is essential to highlight the forest’s economic value and to identify the regions of the biome that contribute most to the water supply that supports Brazil’s agricultural output.
Figure 6. Trajectories of the Flying Rivers through the Main Agricultural Regions of Brazil

Source: CPI/PUC-RIO with data from Copernicus-ERA5 (2023), MAPBIOMAS (2023), 2025
Wildfires
Wildfires represent another major consequence of prolonged droughts. Brazil has faced severe droughts and wildfires, which not only affect native vegetation but also cause severe damage to agricultural production. In 2024 alone, wildfires burned more than 30.8 million hectares—a 79% increase compared to 2023—affecting 18.9 million people.[32],[33] This significant increase has been associated with the El Niño phenomenon. In the same year, the Amazon was the most affected biome, driven by below-average rainfall. In the Cerrado, 9.7 million hectares burned, representing a 47% increase compared to the average over the previous six years.[34] From an economic standpoint, the impacts are substantial. Estimated production loss totaled US$ 2.7 billion, including US$ 1.5 billion in livestock and pasture and of US$ 400 million in sugarcane.[35]
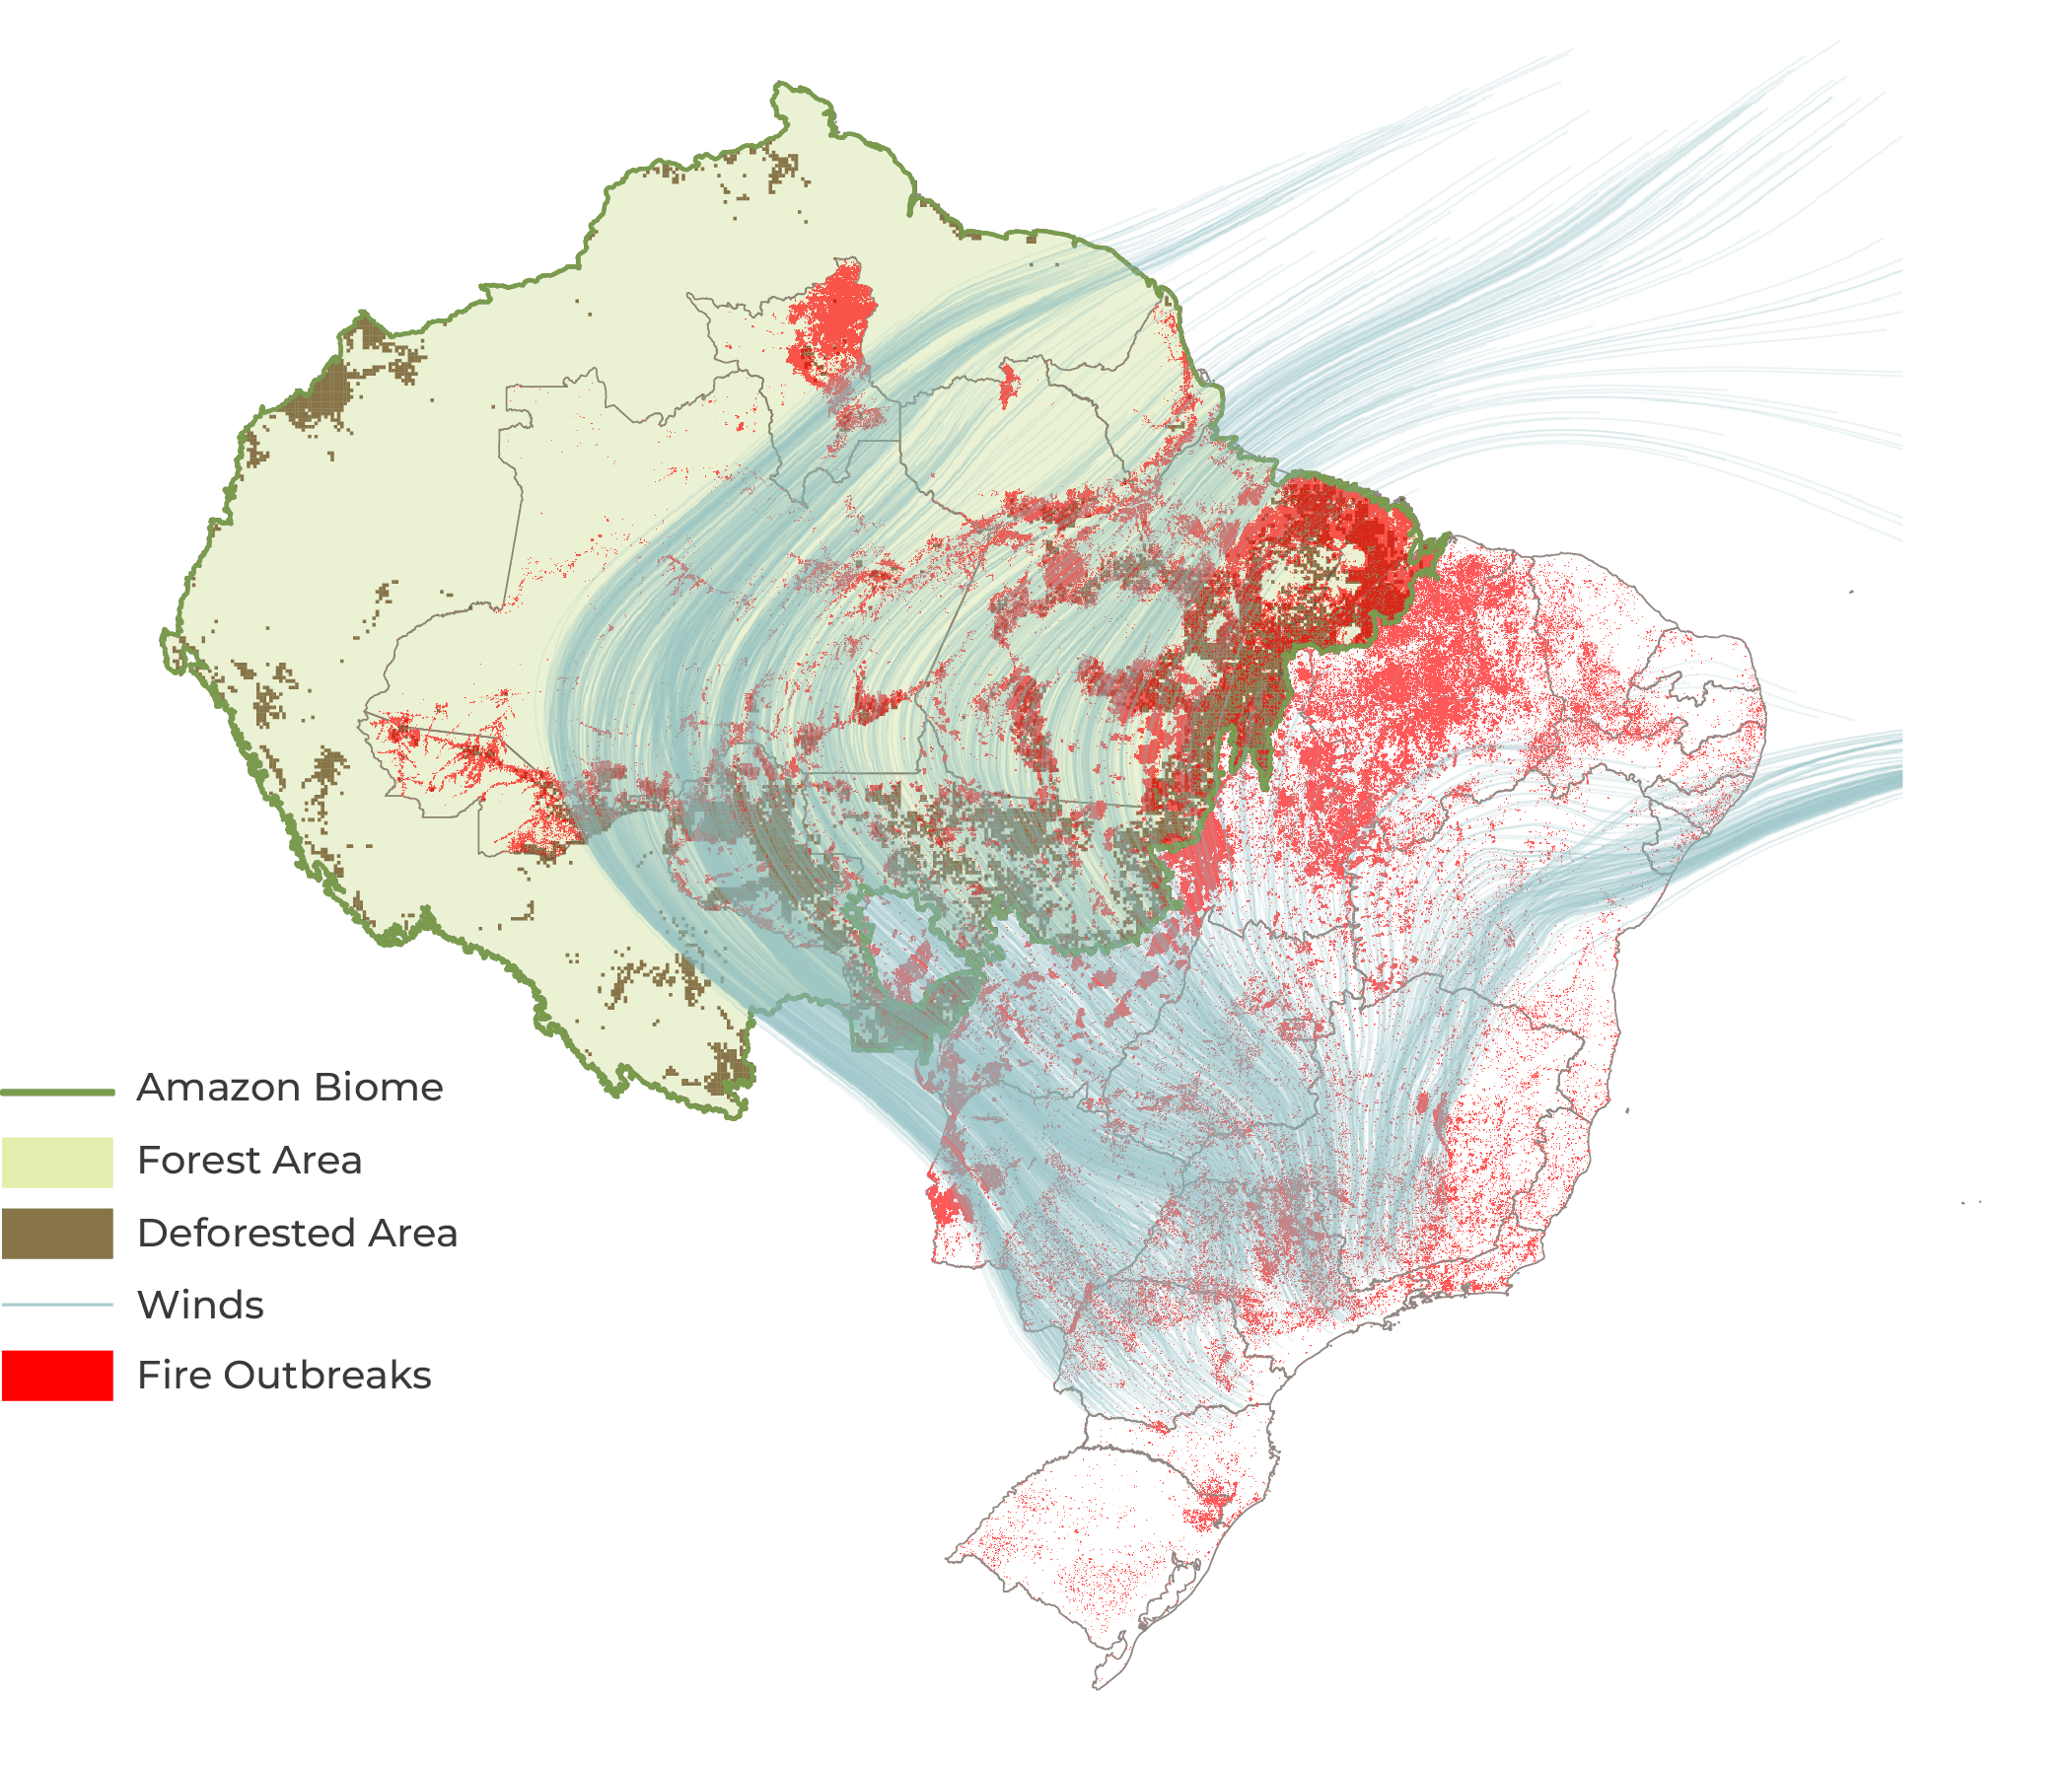
Research shows that water availability is a key factor in vegetation’s resilience to wildfires, while drought conditions significantly heighten fire risk.[36],[37] Reduced rainfall associated with deforestation can therefore compromise ecosystems’ natural ability to resist fire. As illustrated in Figure 7, the flying rivers pass near the wildfire outbreak zones, suggesting that changes in this mechanism may already be influencing wildfire patterns across several regions of the country.
Figure 7. Trajectory of Flying Rivers through Regions Vulnerable to Fires
Source: CPI/PUC-RIO with data from Copernicus-ERA5 (2023), MAPBIOMAS (2023), 2025
River Transport
Brazil’s waterway network plays an increasingly vital role in national logistics and commodity exports. All hydrographic regions have recorded growth in cargo movement, with the Amazon and Paraguay regions standing out.[38] Between 2010 and 2023, soybean and corn transport via waterways increased by 782%, and ports in Arco Norte saw grain exports grow between 70% and 80% between 2020 to 2024.[39], [40], [41] The federal government has also announced plans to expand the potential of Brazilian waterway infrastructure to lower freight costs for commodity exports.[42]
However, reoccurring droughts have negatively disrupted grain transport via the waterway network. During the 2020/2021 drought, the Tietê-Paraná waterway fell to critical levels, leading to the interruption of transport on its rivers.[43] In 2023, the drought in the Amazon reduced the volume of grain transport by about 40%, requiring cargo to be rerouted to the South and Southeast. In 2024, the Madeira River reached a record low of 25 cm in depth, leading to the interruption of operations at the port of Porto Velho.[44] That same year, Hidrovias do Brasil suffered significant losses—estimated at US$ 114 million—due to drought conditions in the North and South corridors.[45]
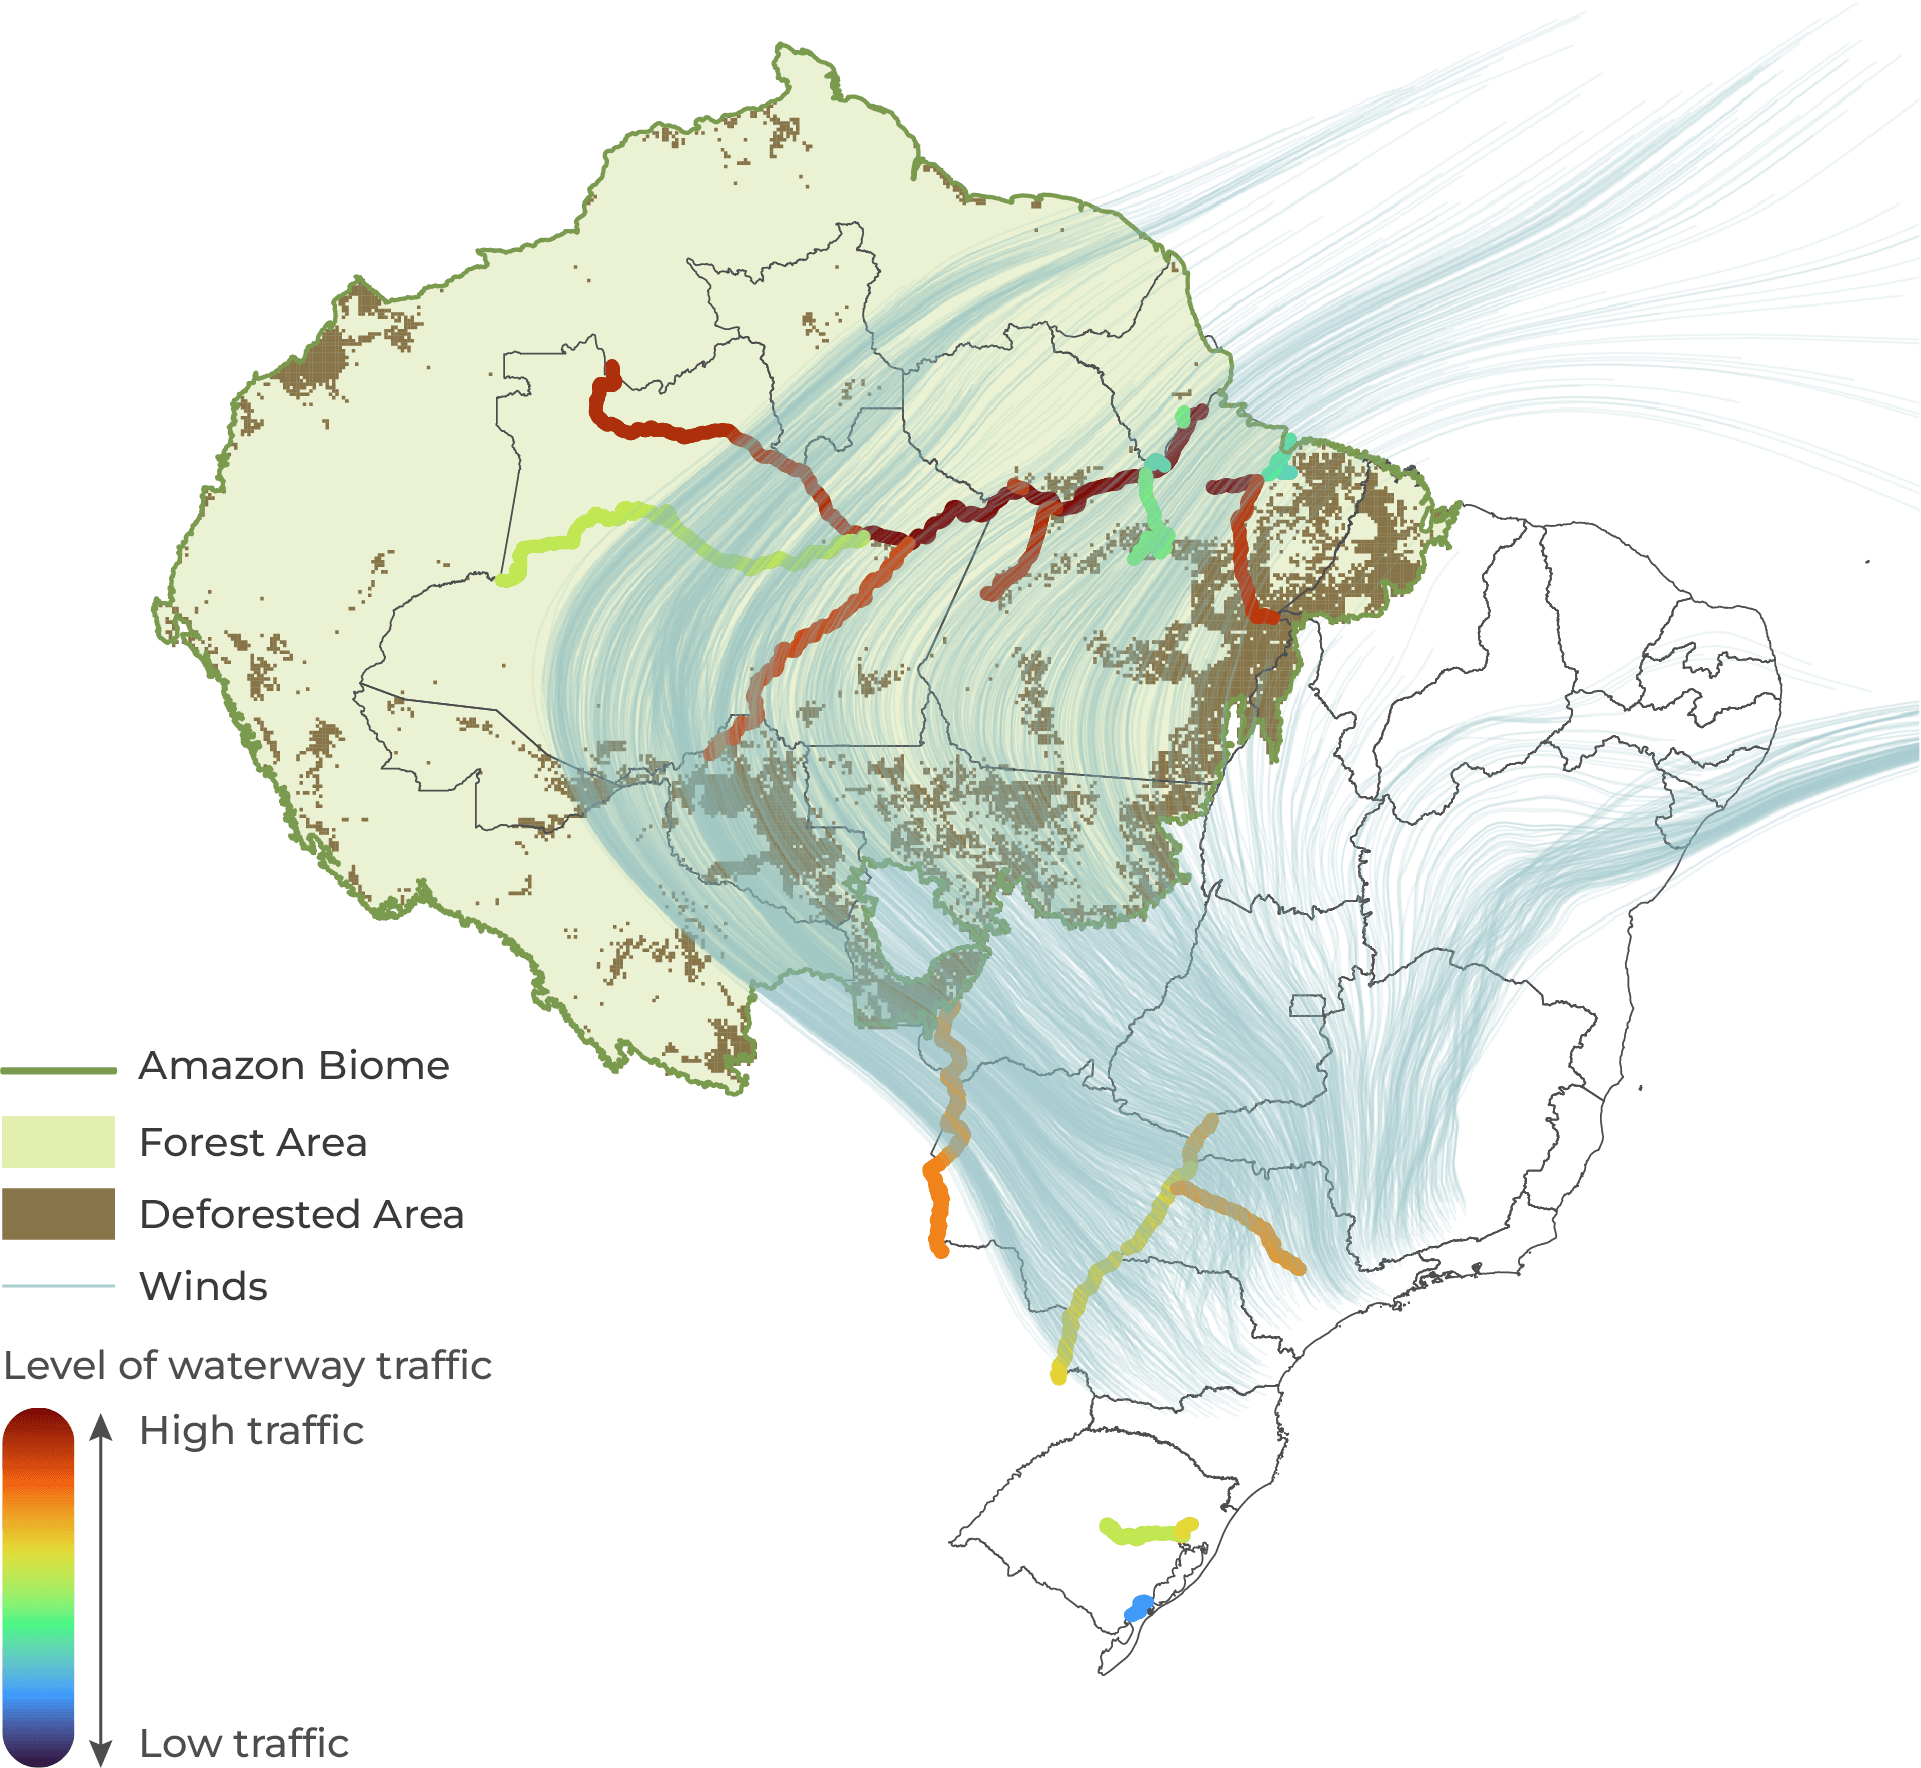
As Figure 8 illustrates, flying rivers pass through all the country’s major waterways. Improving national logistics capacity is crucial for maintaining competitiveness in international trade and reducing domestic prices. Yet, deforestation in the Amazon threatens to undermine these benefits by reducing rainfall and river flow, compromising the very waterways that sustain Brazil’s export infrastructure.
Figure 8. Trajectory of the Flying Rivers through the Main River Transports in Brazil
Source: CPI/PUC-RIO with data from Copernicus-ERA5 (2023), MAPBIOMAS (2023), ANTAQ (2025), 2025
Conclusion
By regulating the rainfall patterns across the country, the Amazon Forest serves as a strategic asset for Brazil’s national productivity. Water scarcity already affects electricity generation, agriculture, river transport, urban water supply, and fire resilience, with losses amounting to millions of dollars each year.
Recent advances in computing and empirical approaches now make it possible to more precisely quantify the forest’s role in supporting multiple dimensions of Brazilian society. Existing evidence already points to significant financial losses in hydropower generation linked to deforestation. This report demonstrates that flying rivers traverse regions essential for agriculture, urban water supply, and river navigation, as well as areas increasingly prone to wildfires—offering a new perspective on the forest’s central role in sustaining the national economy. While further work is needed to fully quantify the flying rivers’ mechanisms, current evidence underscores the Amazon’s economic importance and the urgent need to strengthen its conservation.
Brazil has already demonstrated its capacity to curb deforestation through effective public policies. Policies such as the Action Plan for the Prevention and Control of Deforestation in the Legal Amazon (Plano de Ação para Prevenção e Controle do Desmatamento na Amazônia Legal – PPCDAM), the prioritization of municipalities for actions to prevent, monitor, and control deforestation, and the concession of credit conditional on environmental regularization have substantially reduced deforestation in the biome. Between 2004 and 2014, the deforestation rate was reduced by approximately five times. However, between 2014 and 2021, deforestation more than doubled. After this year, the rates fell by half.[46] These results illustrate that while progress is possible, sustained commitment is essential. Forest protection policies must remain a continuous national effort—independent of political cycles.
Deforestation in the Amazon poses a direct threat not only to the environment, climate and biodiversity, but also to Brazil’s economic stability and development. Protecting the Amazon forest must therefore be regarded as a strategic national priority.
[1] EPE. Anuário Estatístico de Energia Elétrica 2025. 2025. bit.ly/3WiHEN6.
[2] CNA. Brasil tem potencial de ampliar área irrigada com uso de tecnologias. 2022. Access date: September 5, 2025. bit.ly/4gxxba9.
[3] Marengo, José A. et al. “Changes in Climate and Land Use Over the Amazon Region: Current and Future Variability and Trends”. Frontiers in Earth Science 6, no. 228 (2018). bit.ly/3ICRIgO.
[4] Nobre, Antônio D. The Future Climate of Amazonia: Scientific Assessment Report. São José dos Campos: Articulación Regional Amazónica, 2014. bit.ly/3KhPDaD.
[5] Marengo, José A. et al. “Climatology of the Low-Level Jet East of the Andes as Derived from the NCEP-NCAR Reanalyses: Characteristics and Temporal Variability”. Journal of Climate 17, no. 12 (2004): 2261-2280. bit.ly/4gIyTWo.
[6] Spracklen, D. V. et al. “The Effects of Tropical Vegetation on Rainfall”. Annual Review of Environment and Resources 43 (2018): 193-218. bit.ly/46E3aks.
[7] Araújo, Rafael. “The value of tropical forests to hydropower”. Energy Economics 129 (2024). bit.ly/4nfCihN.
[8] Pinto, Gustavo R. S. and João Pedro Arbache. Deforestation Cuts the Lights: Itaipu, Belo Monte, and the Cost of Forest Loss. Climate Policy Initiative and Amazon 2030, 2025. bit.ly/Deforestation-HPP.
[9] Flores, Bernardo M. et al. “Critical transitions in the Amazon forest system”. Nature 626 (2024): 555-564. bit.ly/4gyPZFU.
[10] EPE. Balanço Energético Nacional 2025: Ano base 2024. 2025. bit.ly/3Kf4T8k.
[11] EPE. Anuário Estatístico de Energia Elétrica 2025. 2025. bit.ly/3WiHEN6.
[12] EPE. Escassez hídrica em 2021: diagnóstico e oportunidades para o planejamento da expansão da oferta de eletricidade. 2023. bit.ly/4gxxbqp.
[13] O Globo. Crise hídrica evidenciou dependência de hidrelétricas no Brasil: diversificar é fundamental. 2022. Access date: September 5, 2025. bit.ly/46AXV50.
[14] ONS. Nota à imprensa – esclarecimentos em relação à Nota Técnica sobre avaliação das condições de atendimento eletroenergético do Sistema Interligado Nacional – estudo prospectivo junho a novembro de 2021. 2021. Access date: September 5, 2025. bit.ly/3VWsJYO.
[15] CNM. Impactos da crise hidroenergética nos Municípios. 2021. bit.ly/4nhvC2x.
[16] MME and EPE. 2031 Ten-Year Energy Expansion Plan. Brasília, 2022. bit.ly/4nDPEnW.
[17] EPE. Escassez hídrica em 2021: diagnóstico e oportunidades para o planejamento da expansão da oferta de eletricidade. 2023. bit.ly/4gxxbqp.
[18] Araújo, Rafael. “The value of tropical forests to hydropower”. Energy Economics 129 (2024). bit.ly/4nfCihN.
[19] Pinto, Gustavo R. S. and João Pedro Arbache. Deforestation Cuts the Lights: Itaipu, Belo Monte, and the Cost of Forest Loss. Climate Policy Initiative and Amazon 2030, 2025. bit.ly/Deforestation-HPP.
[20] United Nations. The human right to water sanitation: Resolution adopted by the General Assembly on 28 July 2010: 64/292. 2010. bit.ly/4mtjDO0.
[21] World Population Review. Fresh Water by Country 2025. 2025. Access date: September 19, 2025. bit.ly/4nkZ4F1.
[22] CEMADEN. Situação atual e projeção hidrológica para o Sistema Cantareira. 2024. bit.ly/4pvJFmA.
[23] Ferrari, Murillo. Cantareira atinge pior nível desde fim da crise hídrica em SP e acende alerta. CNN. 2020. Access date: September 5, 2025. bit.ly/4mksfqb.
[24] CEMADEN. Situação atual e projeção hidrológica para o Sistema Cantareira. 2024. bit.ly/4pvJFmA.
[25] ANA. Cantareira entra em Faixa de Alerta em setembro. 2025. Access date: September 5, 2025. bit.ly/46tzJRQ.
[26] Agência IBGE Notícias. GDP grows 3.4% in 2024 and closes the year at R$ 11.7 trillion 2025. Access date: September 5, 2025. bit.ly/46OQRBW.
[27] CEPEA and CNA. PIB do agronegócio registra crescimento de 6,49% no primeiro trimestre de 2025. 2025. bit.ly/4myjdGl.
[28] CNA. Panorama do Agro. 2025. Access date: September 5, 2025. bit.ly/3Io9rss.
[29] Viana, Guilherme. Oeste baiano supera Minas Gerais e se torna o maior polo de irrigação do Brasil. Embrapa. 2024. Acess date: September 5, 2025. bit.ly/47NRgGS.
[30] CNA. Brasil tem potencial de ampliar área irrigada com uso de tecnologias. 2022. Access date: September 5, 2025. bit.ly/4gxxba9.
[31] CNM. Estudo Técnico: Prejuízos da agropecuária nos últimos 10 anos. 2023. bit.ly/46un8xR.
[32] MAPBIOMAS. Área Queimada no Brasil cresce 79% e supera os 30 milhões de hectares – Dados do Monitor do Fogo do MAPBIOMAS mostram que mais da metade da área queimada no Brasil no ano passado fica na Amazônia. 2025. Access date: September 5, 2025. bit.ly/4n8g7Kc.
[33] CNM. CNM divulga boletim com dados atualizados das decretações de situação de emergência municipais por incêndios florestais até 30 de setembro de 2024. 2024. bit.ly/4nP0AiB.
[34] Ibid.
[35] G1. Incêndios causam prejuízos de mais de R$ 14 bilhões no campo. 2024. Access date: September 5, 2025. bit.ly/3Kzd6nI.
[36] Littel, Jeremy S. et al. “A review of the relationships between drought and forest fire in the United States”. Global Change Biology 22 (2016): 2353–2369. bit.ly/46ADpBt.
[37] Zong, Xuezheng et al. “Drought threat to terrestrial gross primary production exacerbated by wildfires”. Communications Earth & Environment 5, no. 5 (2024). bit.ly/4pAXvUV.
[38] CONAB. Anuário Agrologístico – Volume 2, 2025. Access date: September 5, 2025. bit.ly/46vIOcR.
[39] The Arco Norte (Northern Arc) is defined as the “transportation system, in its various modes, responsible for the flow of cargo and inputs using the ports in the north of Brazil, from Porto Velho in Rondônia, through the states of Amazonas, Amapá and Pará, to the port system of São Luís in Maranhão.” Learn more at: Vale, Lúcio et al. Arco Norte: Um Desafio Logístico. Brasília: Câmara dos Deputados, Centro de Estudos e Debates Estratégicos, and Consultoria Legislativa, 2016. bit.ly/46jWTeS.
[40] Zong, Xuezheng et al. “Drought threat to terrestrial gross primary production exacerbated by wildfires”. Communications Earth & Environment 5, no. 5 (2024). bit.ly/4pAXvUV.
[41] Júnior, Daumildo. Escoamento de safra por hidrovias cresce 780% em 13 anos. AgroEstadão. 2024. Access date: September 5, 2025. bit.ly/3IkofZ3.
[42] Goldberg, Simone. Licitações de hidrovias começam em 2025. Valor Econômico. 2025. Access date: September 5, 2025. bit.ly/3Invu2r.
[43] Summit Agro. Entenda o que é a estiagem e quais são os seus efeitos. AgroEstadão. 2022. Access date: September 5, 2025. bit.ly/46hFFPd.
[44] Altino, Lucas. Seca na Amazônia: Rio Madeira chega a apenas 25 centímetros de profundidade em novo recorde de mínima histórica. O Globo. 2024. Access date: September 18, 2025. bit.ly/4gQEMkc.
[45] Lustosa, Gustavo. Hidrovias do Brasil fecha o ano no vermelho com pressão de câmbio e clima. AGFeed. 2025. Access date: September 5, 2025. bit.ly/4pBB4Ph.
[46] INPE. TerraBrasilis – Prodes (Deforestation rates – Legal Amazon – states). 2025. Access date: September 18, 2025. bit.ly/4nuB8iw.
