Tropical Forest Countries: Challenges and Opportunities
(The Forest-Climate Nexus: A Fit-for-Purpose Framework for Climate Impact)
Tropical forests are home to the world’s most biodiverse and carbon-rich forests, covering approximately 1.27 billion ha across the world. Over the past decade, countries with tropical forests have collectively lost more than 10 million ha of tropical forest per year. The drivers of deforestation vary widely across regions, and include land clearing for cattle ranching, cultivation and subsistence farming, fuelwood extraction, illegal logging, and even activities linked to illicit economies such as narcotrafficking. At the same time, CPI/PUC-RIO estimates suggest that the deforested areas from 2001 to 2023 hold a potential to capture up to 49 GtCO2, highlighting the crucial role of restoration efforts in the climate agenda. This figure is significant because, as of 2024, the UNEP Emissions Gap Report mentions the remaining carbon budget at approximately 900 GtCO2e to limit global warming to below 2°C, and only 200 GtCO2e to stay within the 1.5°C target.
Three key elements in this agenda—protecting remaining forests, combating deforestation, and restoring forests—manifest differently across tropical nations, reflecting variations in geography, land-use pressures, governance, and institutional capacity. Understanding the prominence and interconnected nature of these dynamics in each context is necessary in strengthening the forest-climate nexus.
This chapter begins by analyzing the scale of the forest agenda in each tropical country, estimating the area of forest to be protected, current deforestation dynamics, and the potential volume of carbon that could be captured through forest restoration. Using a machine learning approach the analysis classifies countries in three distinct groups according to their forest management challenges: (i) those with high forest cover, low deforestation, and low carbon potential; (ii) those with low forest cover, high deforestation, and low carbon potential; and (iii) those countries with high forest cover, high deforestation, and high carbon potential.[1] This chapter then examines the relationship between economic development and the forest agenda.
The analysis highlights three main insights. First, conserving and restoring tropical forests requires initiatives that match the scale of the challenge to fully unlock their potential for global climate mitigation. Second, the wide variation of national circumstances calls for differentiated and flexible policy approaches. Countries differ significantly in forest cover, conservation status, and biophysical capacity for carbon regeneration, making tailored, fit-for-purpose strategies essential. Third, the data show no inherent trade-offs between the forest agenda and economic development: countries with higher deforestation rates do not necessarily have higher income levels, suggesting that forest loss is not a necessary condition for economic development. Likewise, countries with large, forested areas do not necessarily have low GDP per capita.
The Scale of the Forest Agenda
To quantify the scale of the tropical forest agenda, consistent indicators were developed across three dimensions: forest area, forest loss, and potential for carbon sequestration.
The analysis covers countries within the Tropical & Subtropical Moist Broadleaf Forests ecoregion. For simplicity, the term “tropical forests” is used to refer to this ecological region. The geographic boundaries of the biome follow the original delineation by Olson et al. (2001) in their global terrestrial ecoregion typology, as later refined by Dinerstein et al. (2017). All sovereign countries with any portion of their territory overlapping the biome were considered, regardless of the relative size of that overlap, totaling 91 countries. National borders were sourced from the Natural Earth dataset. Overseas territories, administrative dependencies, and other non-sovereign subdivisions were excluded.
Forest extent is calculated using the latest available version (v1.11, 2023) of the Hansen et al. (2013) global tree cover dataset, restricted to pixels with canopy cover greater than or equal to 30% and vegetation taller than five meters as of the year 2000. Only pixels located within the boundaries of the Tropical and Subtropical Moist Broadleaf Forests ecoregion were considered, using 30-meter resolution data. According to this method, the ecoregion covers approximately 1.93 billion ha globally, of which 1.27 billion ha were forested in 2023, representing approximately 65% of the ecoregion’s total area. See Figure 1 for the tropical forest areas in 2023 and the deforested areas.
Figure 1. Tropical Forest Areas in 2023 and Areas Deforested between 2001–2023
![]() Click to expand the figure
Click to expand the figure
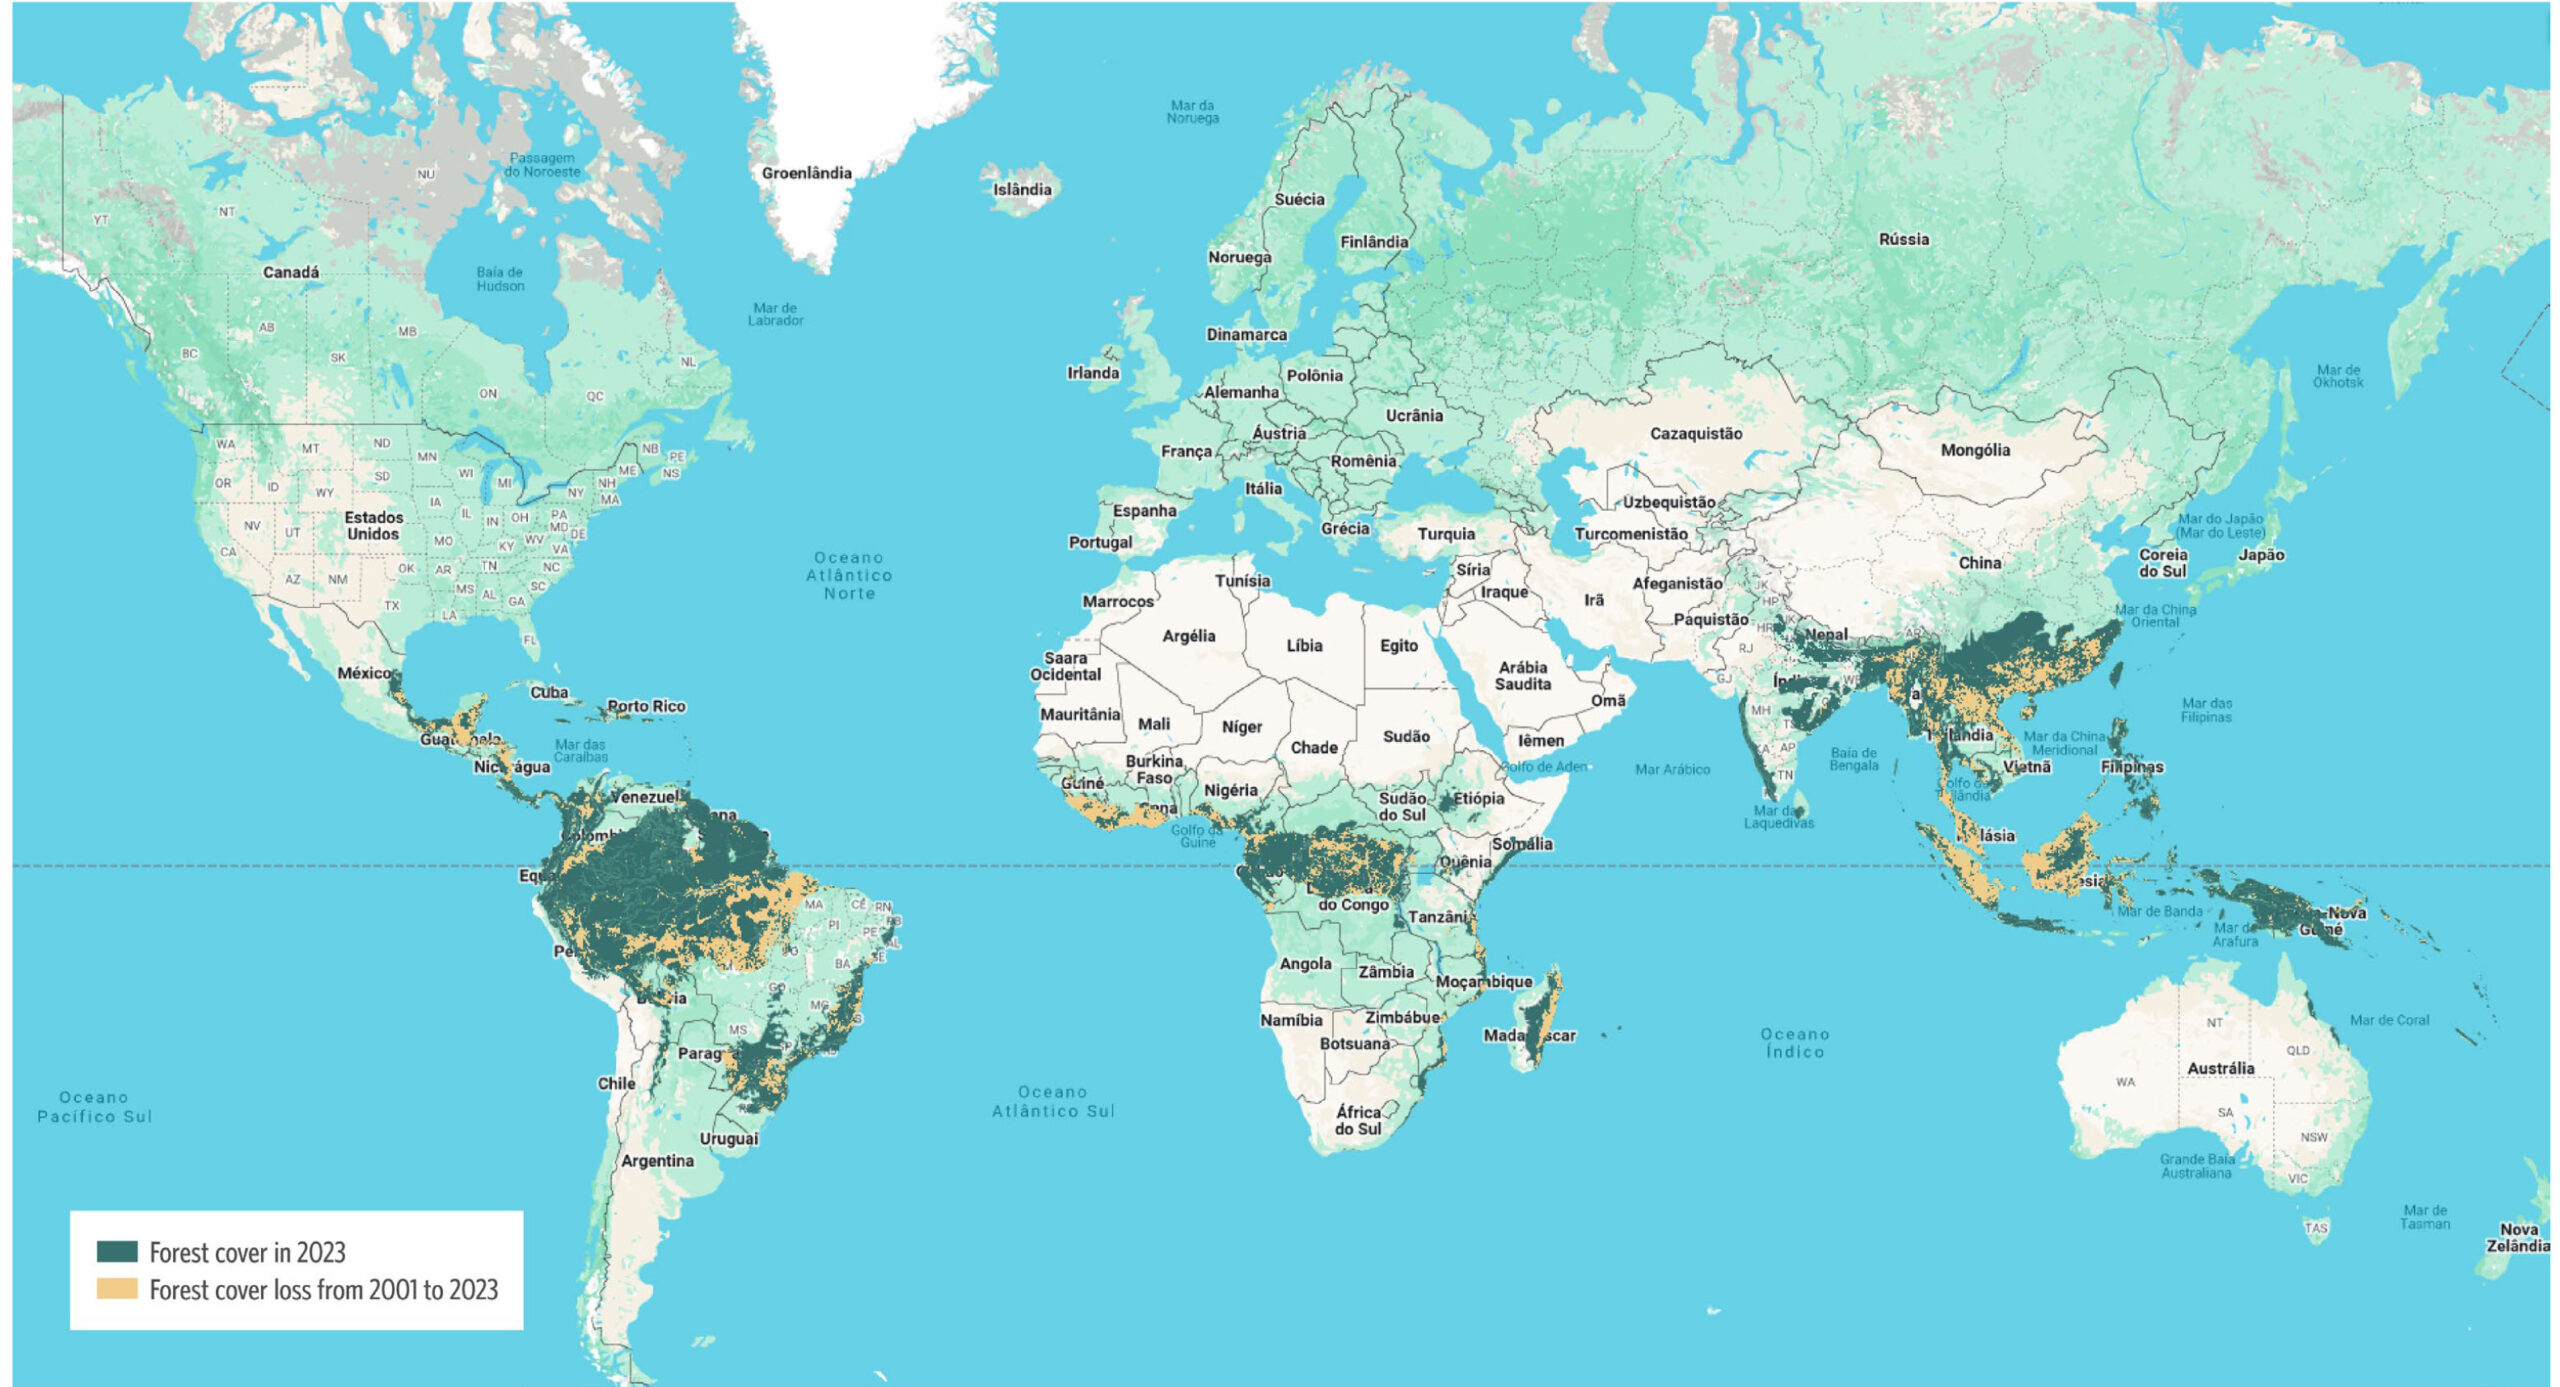
Source: CPI/PUC-RIO with data from Hansen et al. (2013) – v1.11, 2025
Across the 91 countries analyzed, these forests hold an estimated 593 GtCO2—roughly one-third of all historical global emissions. This value is estimated using the global biomass potential maps by Santoro and Cartus (2024), with 500m resolution. Brazil accounts for the largest share, primarily due to the vast Amazon biome. Notably, while the forested area of the Democratic Republic of the Congo is about 20% smaller than that of Indonesia, it stores over 75% more carbon. This difference, which is also observed in other cases, underscores significant heterogeneity in forest density and biomass across tropical nations. Figures 2 and 3 show the top 20 countries with the largest tropical forest area and the largest carbon stock, respectively.
Figure 2. Top 20 Countries with the Largest Tropical Forest Area, 2023
![]() Interactive chart
Interactive chart
Source: CPI/PUC-RIO with data from Hansen et al. (2013) – v1.11, 2025
Figure 3. Top 20 Countries with the Largest Carbon Stock, 2023
![]() Interactive chart
Interactive chart
Source: CPI/PUC-RIO with data from Hansen et al. (2013) – v1.11, 2025
Analysis estimates deforestation based on annual tree cover loss from 2001 to 2023 (Figure 4). Over the full 2001–2023 period, around 180 million ha of forest were lost, which represents nearly 10% of the ecoregion’s area. In more recent years, the average annual deforestation has exceeded 10 million ha.
Figure 4. Top 20 Countries with the Highest Tropical Forest Deforestation, 2001-2023
![]() Interactive chart
Interactive chart
Source: CPI/PUC-RIO with data from Hansen et al. (2013) – v1.11, 2025
The potential for carbon capture in areas deforested between 2001 and 2023 is estimated following the methodology developed by Assunção, Hansen, Munson, and Scheinkman (2025), which uses a spatial regression approach based on environmental and geographic covariates. Above-ground biomass is modeled as a function of precipitation, temperature, latitude, and longitude, using observed carbon values from intact forest pixels. This model is then applied to pixels that were deforested between 2001 and 2023 to predict potential biomass that can be captured through natural regeneration. This approach yields a spatially explicit estimate of the carbon that could be recovered if these areas were restored, under the assumption of full biophysical regeneration. The estimate corresponds to a global sequestration potential of 49 GtCO2 captured via restoration of the areas deforested between 2001 and 2023. Figure 5 lists the top 20 countries with the highest GtCO2 capture potential.
Figure 5. Top 20 Countries with the Highest GtCO2 capture Potential from Deforested Areas between 2001-2023
![]() Interactive chart
Interactive chart
Source: CPI/PUC-RIO with data from Hansen et al. (2013) – v1.11, 2025, CHIRPS precipitation (2023), and TerraClimate temperature (2020), 2025
The Diversity of the Forest Agenda
To capture the diversity of forest-related challenges and opportunities across countries with tropical forests, a classification exercise was conducted based on three core dimensions: recent deforestation, standing forest, and potential for forest restoration.
An unsupervised machine learning technique—k-means clustering—was applied using standardized, relative indicators: the share of national territory covered by tropical forest, the share of forest lost to recent deforestation, and estimated carbon removal potential from restoration. The use of relative, rather than absolute values, enables meaningful cross-country comparisons regardless of geographic size. All variables were normalized using z-scores to ensure comparability across different units and scales.
The number of clusters was fixed at three to balance interpretability and differentiation, aiming to capture broad patterns rather than fine-grained distinctions.
- Cluster 1 (High Forest Cover, Low Deforestation, Low Carbon Potential) includes countries with extensive standing forests and relatively low recent deforestation, such as Guyana and Papua New Guinea.
- Cluster 2 (Low Forest Cover, High Deforestation, Low Carbon Potential) comprises countries experiencing high deforestation pressures, including Mexico, China, and Nigeria.
- Cluster 3 (High Forest Cover, High Deforestation, High Carbon Potential) consists of countries with large forested areas and significant restoration potential due to past deforestation, such as Brazil, the Democratic Republic of the Congo, and Indonesia.
As shown in Figure 6, these groups are geographically dispersed, underscoring the role of national governance, economic structure, and land-use policies in shaping forest outcomes.
Figure 6. Clusters of Countries with Tropical Forests
![]() Interactive map
Interactive map
Source: CPI/PUC-RIO with data from Dinerstein et al. (2017), Hansen et al. (2013) – v1.11, CHIRPS precipitation, and TerraClimate temperature (2020), 2025
High Forest Cover, Low Deforestation, Low Carbon Potential
Countries in this group are defined by a consistently high share of tropical forest within the portion of their territory that overlaps with the tropical and subtropical moist broadleaf ecoregion. These countries have maintained relatively low rates of deforestation over the past two decades and, as a result, the central challenge is not to restore what was lost, but to safeguard the standing forests. Policies that focus on long-term conservation, enforcement of protected areas, and support for forest-dependent communities are especially relevant in this group, where natural capital and carbon stocks remain largely intact but not necessarily immune to rising pressures.
This group plays a crucial role in providing global and regional ecosystem services. In Oceania, for example, countries like Papua New Guinea and Vanuatu function as ecological sanctuaries, preserving high levels of endemism and acting as buffers against biodiversity collapse in the region (Oliver et al. 2022; Kier et al. 2009; Hamilton, Klein and Austin 2010). Their forests help regulate rainfall patterns, maintain coastal resilience, and store vast amounts of living biomass (Spraklen et al. 2012; Theeuwen et al. 2023; Smith, Baker, and Spracklen 2023). In South America, Suriname stands out for having one of the highest percentages of intact forest cover in the world, serving both as a carbon sink and a biodiversity reservoir (Potapov et al. 2022; FAO 2020). These forests provide services that go far beyond national borders, including climate stability, hydrological regulation, and pollination corridors.
Despite their relatively strong conservation profiles, some countries in this cluster face emerging threats. While countries in the Congo Basin face increasing deforestation from smallholder clearing and shifting cultivation and charcoal, countries across the Amazon–Andean region confront deforestation largely driven by cattle ranching, crop expansion and, especially in 2024, fires. Suriname maintains low levels of deforestation, while Guyana’s deforestation spiked in 2024 and faces increasing pressure from mining (Goldman et al. 2025; Potapov et al. 2022). In Central America and the Caribbean, as well as in the Pacific islands, deforestation is primarily driven by agriculture and settlements, while in Africa and Asia cropland and urban growth, with hydropower flooding in parts of Asia, threaten forest conservation.
Low Forest Cover, High Deforestation, Low Carbon Potential
Countries in this group are characterized by high levels of deforestation. In many of these cases, forest cover was historically low or has been extensively degraded over time, resulting in landscapes dominated by agricultural land, other types of vegetation, or urban settlements. Consequently, the estimates for carbon sequestration potential of restoration are also low, either due to limited forest area or because biophysical and socioeconomic conditions constrain regeneration. While these countries may not be central to large-scale restoration efforts, they are critical to the agenda of halting residual deforestation and avoiding further degradation of already fragile ecosystems.
Deforestation across this set of countries is driven mainly by conversion to permanent agriculture and the expansion of settlements and infrastructure, with region-specific patterns: in Latin America and the Caribbean countries, an exceptional 2024 fire season sharply amplified loss while agricultural clearing remained central—fires accounted for a large share of primary forest loss in Belize, Guatemala, and Mexico (Goldman et al. 2025; Potapov et al. 2022).
In South and Southeast Asia countries, agricultural clearing is prominent, especially in Cambodia, Laos, Vietnam, Thailand. There are also signs of plantations replacing tall forests, small but non-negligible hydropower reservoir flooding, and strong urban/settlement growth, notably in China. In Sub-Saharan Africa countries, forest loss is more diffuse but consistently co-occurs with cropland expansion, together with growth in settlements and infrastructure development (Goldman et al. 2025; Potapov et al. 2022).
High Forest Cover, High Deforestation, High Carbon Potential
The last group includes three countries—Brazil, Indonesia, and the Democratic Republic of the Congo—which concentrate a disproportionately large share of the world’s tropical forests. These countries combine vast remaining forest areas, significant deforestation in recent decades, and an extremely high potential for carbon regeneration. All three hold portions of the planet’s major tropical forest basins: the Amazon, the Congo Basin, and the tropical archipelagos of Southeast Asia. Their land-use trajectories have global implications, as changes in forest cover within these territories directly affect atmospheric carbon, biodiversity conservation, and hydrological cycles across continents. In climate terms, they are irreplaceable.
Despite commonalities, deforestation dynamics in these countries differ markedly. In Brazil, a mix of land speculation, cattle ranching, soy expansion, and infrastructure development, especially in the Amazon biome, drive deforestation. Legal ambiguities, weak enforcement, and political oscillations have shaped a landscape of intense land-use conflict (Lima Filho, Bragança, and Assunção 2021; Santos et al. 2025; Skidmore et al. 2021).
In Indonesia, forest clearing has historically been tied to palm oil production, timber extraction, and peatland drainage, leading not only to deforestation but also to significant GHG emissions from peat oxidation and fires. More recent policy shifts, including moratoria on primary forest conversion and peatland restoration programs, have slowed loss but not eliminated it (Austin et al. 2017; Austin et al. 2019).
In the Democratic Republic of the Congo, the deforestation drivers are more fragmented and localized, including slash-and-burn agriculture, fuelwood collection, and artisanal logging, often underpinned by rural poverty and limited state presence (Ickowitz et al. 2015; Achille, Zhang, and Anoma 2021). Across all three countries, land governance remains a key bottleneck, and forest loss continues even in areas officially protected.
Together, these three countries account for an estimated 29.45 GtCO2 in potential carbon that could be removed from the atmosphere through restoration of areas deforested between 2001 and 2023. Individually, the figures are staggering: Brazil alone holds 16.67 GtCO2, equivalent to the total emissions of all passenger vehicles worldwide for over 4 years (IEA 2024). Indonesia and the Democratic Republic of the Congo each hold more than 6 GtCO2. These numbers demonstrate how forest restoration can play a critical role in the fight against climate change.
Forests and Economic Development
Forest conservation is often regarded as involving costly policies that restrict agricultural expansion, infrastructure development, and resource extraction, suggesting a trade-off between environmental protection and economic growth. However, environmental conservation and economic growth can be compatible goals and advance together depending on the nature of technological progress and the historical pattern of land occupation.
Figures 7 and 8 examine the relationship between the share of the tropical forest area and per capita income as well as GDP growth. The distribution of income levels shows no consistent pattern relative to forest cover, with countries spanning low to high incomes regardless of their forest share. GDP growth rates similarly exhibit wide variation among nations with large and small proportions of forest. These visual analyses demonstrate the absence of a clear association between forest area and economic performance and reinforce the compatibility of economic and environmental goals.
Figure 7. Tropical Forest Cover and GDP per capita, 2023
![]() Interactive chart
Interactive chart
Note: Mexico’s forest area figure is sourced from INEGI (2019) and refers to the year 2014. Countries with GDP per capita above US$ 20,000 and with no GDP information available were removed to facilitate visualization. The base year for US$ parity is 2015.
Source: CPI/PUC-RIO with data from Hansen et al. (2013) and World Development Indicators (World Bank 2023), 2025
Figure 8. Tropical Forest Cover and GDP Growth, 2023
![]() Interactive chart
Interactive chart
Note: Mexico’s forest area figure is sourced from INEGI (2019) and refers to the year 2014. Guyana, with GDP growth of 34% and forest area of 87%, was removed to facilitate visualization.
Source: CPI/PUC-RIO with data from Hansen et al. (2013) and World Development Indicators (World Bank 2023), 2025
Charting a Differentiated Forest-Climate Strategy
Collectively, these findings reveal the considerable diversity of forest contexts across tropical nations and reinforce the need for strategies that are both ambitious in scale and tailored in design. A one-size-fits-all approach will fall short. Countries differ not only in the extent of their standing forest and loss but also in their restoration potential, economic structure, and institutional capacity. Moving forward, a successful forest-climate strategy must account for this diversity while leveraging the shared opportunity that tropical forests offer: an immediate, cost-effective, and globally significant instrument for climate mitigation. The next chapter builds on this foundation to explore how customized policy instruments, innovative finance, and international cooperation can unlock this potential in practice.
↑ Go back to the top of the page
[1] Countries were classified using hierarchical agglomerative clustering (Ward’s method, Euclidean distance) based on three variables: share of forest area within the biome, share of deforestation in 2013–2023, and relative carbon stock.
