Paris Misaligned: A Look at the U.S. Transport Sector
Electric vehicles1 (EVs) are seen as the sustainable solution for the future of road transport. Led by bankable names (Musk’s Tesla) and backed by ambitious public policies (European Green Deal), the EV sector has been growing steadily in recent years.
In 2017, global EV sales reached one million for the first time. The year after, sales had almost doubled. But what kind of impact are these vehicles having, and how far are we from road transport systems that are compatible with a world of less than 2°C warming? In other words, is current expenditure on new light vehicles2 aligned with the pathway set out by the Paris Agreement?
Data on light road vehicles allow us to answer this for particular countries. The U.S. presents a test case thanks to data availability on its light vehicle fleet (composition and fuel efficiency by model year) provided by the U.S. Department of Transportation and the Environmental Protection Agency, as well as light road CO2 emission scenarios from the International Energy Agency (IEA, 2017).
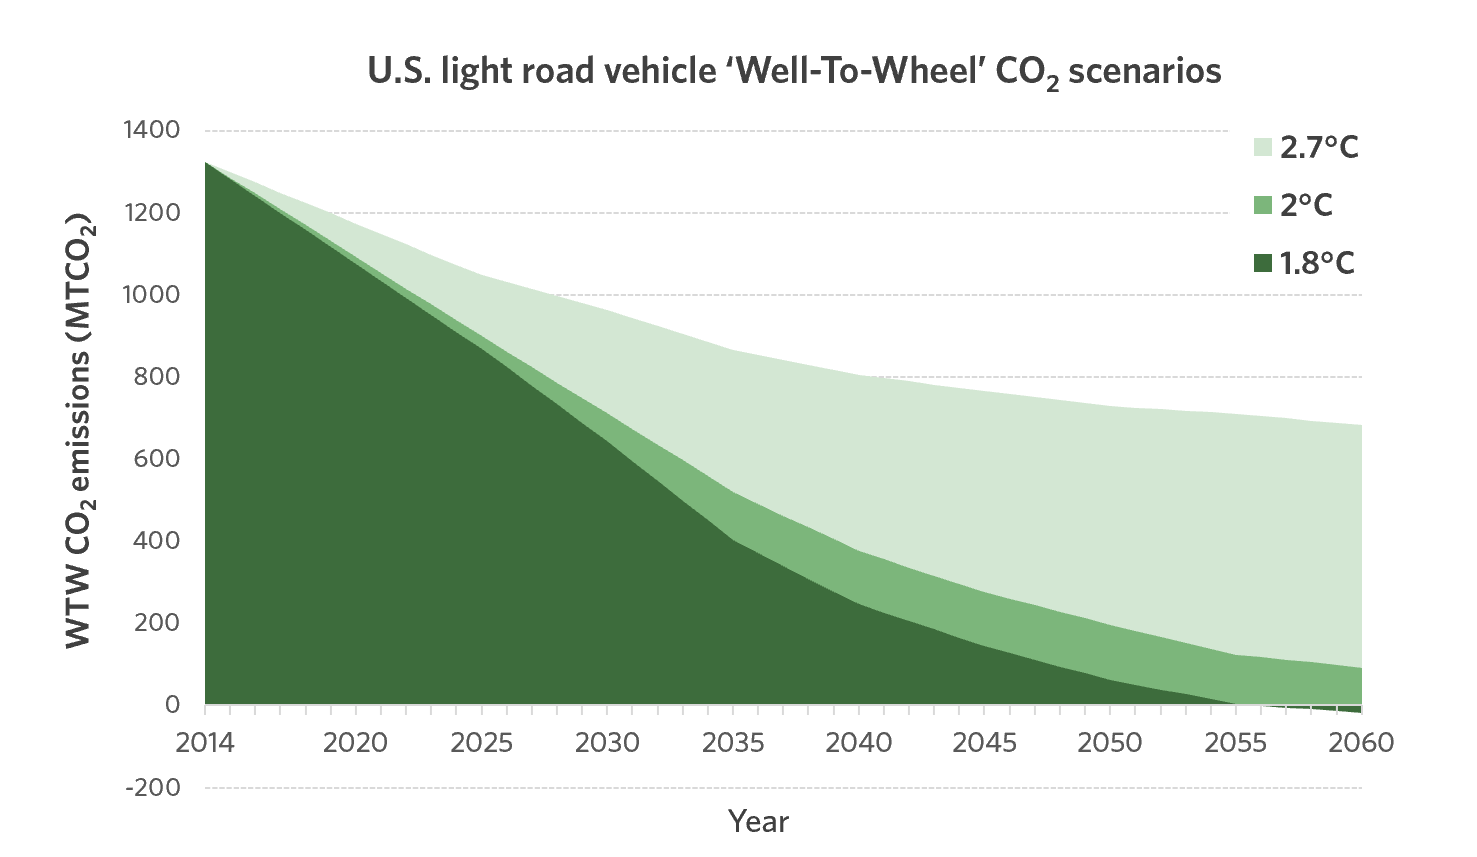
Figure 1- IEA CO2 emissions scenarios for U.S. light road vehicles. These are Well-To-Wheel (WTW) emissions: meaning both on-road CO2 emissions (Tank-To-Wheel, TTW) and the CO2 emissions of the fuel lifecycle (Well-To-Tank, WTT) are included. Other indirect CO2 emissions (such as vehicle manufacturing) are not included.
‘Locked-in’ emissions and how they are accounted for
These CO2 scenarios are in fact our starting point. Each corresponds to a different global warming outcome. They are based on three carbon budgets the IEA has created for light road transport (B2DS: <1.8°C, 2DS: <2°C, REF: <2.7°C). However, these scenarios alone do not allow us to analyze investments in new vehicles as they only represent one facet of the problem.
The inertia of the light vehicle fleet results in ‘locked in’ GHG emissions, a phenomenon shared with other long-lifespan emitting assets, such as fossil fuel power generation plants. Indeed, we have little control over vehicles that are already on the road. Their fuel efficiency remains roughly identical throughout their life, and other critical factors, such as their scrappage rate or their annual mileage, depends on a combination of socio-economic factors and public policies. Either way, a large share of short-term emissions will come from vehicles that were already on the road in 2017. Indeed, we estimate that 75% of the 2025 Paris-aligned carbon budget (<1.8°C) will be spent by these same vehicles.
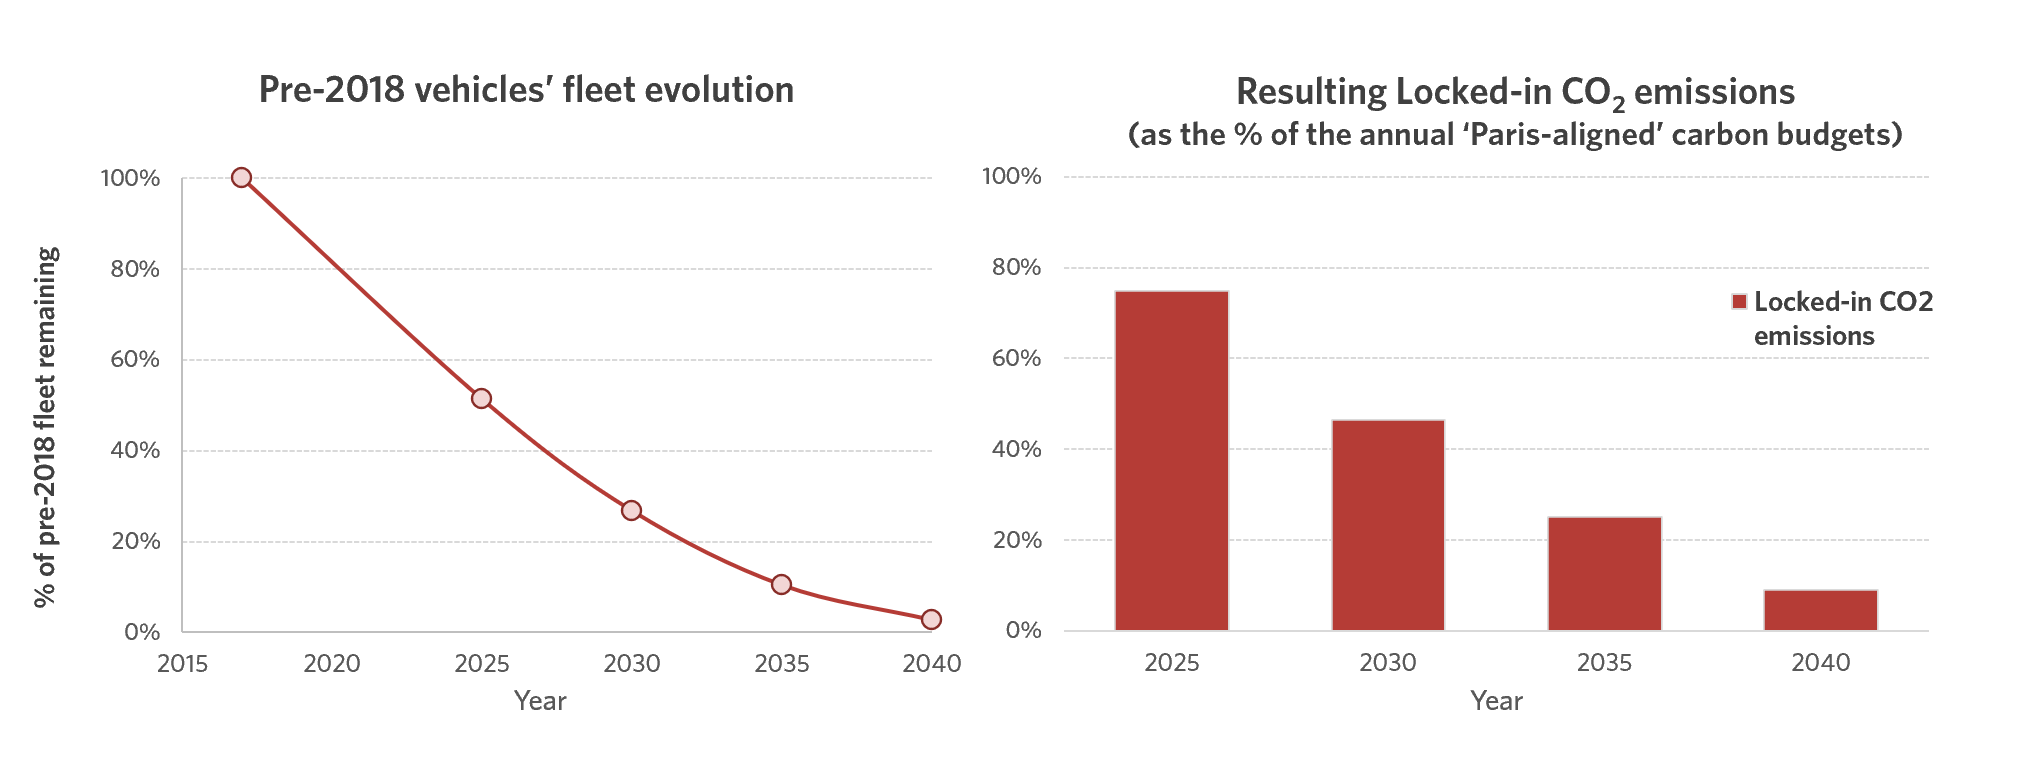
Figure 2- Estimated evolution of the pre-2018 fleet (left) and locked-in CO2 emissions it will be responsible for as a percentage of the Paris-aligned carbon budget (<1.8C) for milestone scenario years (right).
Increasingly stringent carbon budgets
As a result, new vehicles (here defined as vehicles entering the fleet in 2018) need to comply with stringent carbon intensity (gCO2/mile) thresholds in order to compensate for locked-in emissions and meet the scenarios’ emission targets. Carbon intensity thresholds corresponding to each temperature increase can be obtained by dividing the CO2 emission budget allocated to new vehicles by vehicle-miles traveled derived from IEA demand scenarios.
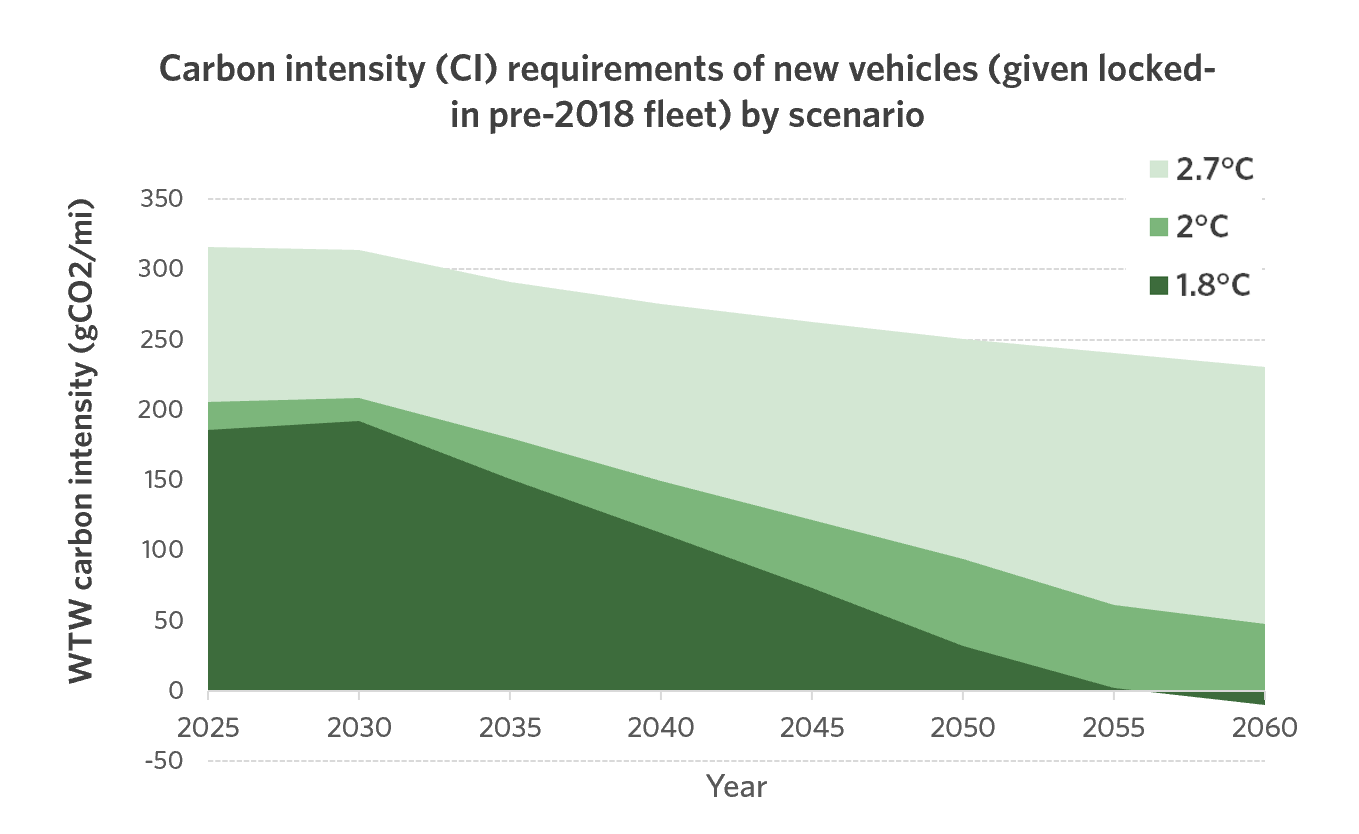
Figure 3- Carbon intensity (CI, in gCO2/mile) requirements of 2018 new vehicles. These CI levels factor in the projected CO2 emissions and the distance travelled by pre-2018 vehicles.
In this study, we assess the alignment of new vehicle carbon intensity (CI) with temperature increase trajectories in two milestone scenario years: 2025 and 2030. A range of U.S. power generation sector scenarios (from sustainable to current ‘business as usual’ policies) are used to compute CI. That alignment analysis is conducted for private (households and businesses) and government expenditures.
Critically misaligned financial flows
U.S. vehicle sales in 2018 are misaligned with the pathways that would meet Paris Agreement goals3 when compared to 2025 and 2030 CI requirements (Table 1). Indeed, new vehicle CI is more than two times greater than the target set for these two years (186 gCO2/mi and 192 gCO2/mi respectively). What is more alarming is that expenditure on new vehicles is misaligned with all three temperature rise trajectories (>2.7C).
| 2018 investment (USDm) | 2025 carbon intensity of 2018 investment (g/mi) | 2025 temperature trajectory | 2030 carbon intensity of 2018 investment(g/mi) | 2030 temperature trajectory | |
| Total | 581,450 | 440 – 441 | >2.7°C | 439 – 441 | >2.7°C |
| Households and Businesses | 578,369 | 440 – 441 | >2.7°C | 439 – 441 | >2.7°C |
| Government | 3,081 | 201 – 220 | <2°C – <2.7°C | 180 – 219 | <1.8°C – <2.7°C |
Table 1 – Carbon intensity (CI) and corresponding temperature increase trajectories of investments in new vehicle, by financial actor.
CI ranges correspond to decreasingly ambitious IEA power sector scenarios (2019b). The lower bounds reflect Paris-aligned power sector scenarios.
Financial flows corresponding to household and business purchases (99% of total) is on a pathway to >2.7°C of warming. Their high carbon intensity is driven by a predominant market share of Internal Combustion Engine (ICE) vehicles (98%), whose fuel efficiencies are nowhere near what scenarios would require (IEA, 2019a).
Government expenditure is aligned with less severe pathways of warming. Its CI could be aligned with the 2025 and 2030 requirements of a 2°C scenario, should the U.S. power sector meet Paris Agreement goals. With less stringent CI thresholds in 2030 due to decreased locked-in emissions, government spending could even be aligned with a 1.8°C scenario. Compared to the private sector, such a reduction should be achieved through the federal fleet vehicle acquisition policy and government incentives on EVs (DOE, 2020).
The road ahead for EVs
Despite a sharp increase in recent years, the market penetration of EVs remains too weak to substantially impact light road CO2 emissions and thus fleet CI. In 2018, EVs represented only 2% of light road sales (3% of financial flows). However, sales volume is not the only challenge requiring attention for EVs to scale up their climate impact. EV CO2 emissions depend highly on the CI of the electricity they are charged with. Given the 2018 U.S. electricity CI and the lock-in effect of the fleet, not all 2018 EV models match the 2025 1.8°C threshold (28% of PHEV and 87% of BEV models). In fact, EVs are less subject to the ‘lock-in’ phenomenon because as the power sector transitions to lower emissions the CI of EVs can be improved after their deployment.
In Figure 4, we have modeled the CI of new 2018 EVs with multiple U.S. power sector trajectories (IEA, 2019b). If the power sector complies with IEA “Paris-aligned” scenario requirements, the CI of 2018 EV could drop by 39% by 2030, while the business as usual scenario would only allow for a 10% decrease.
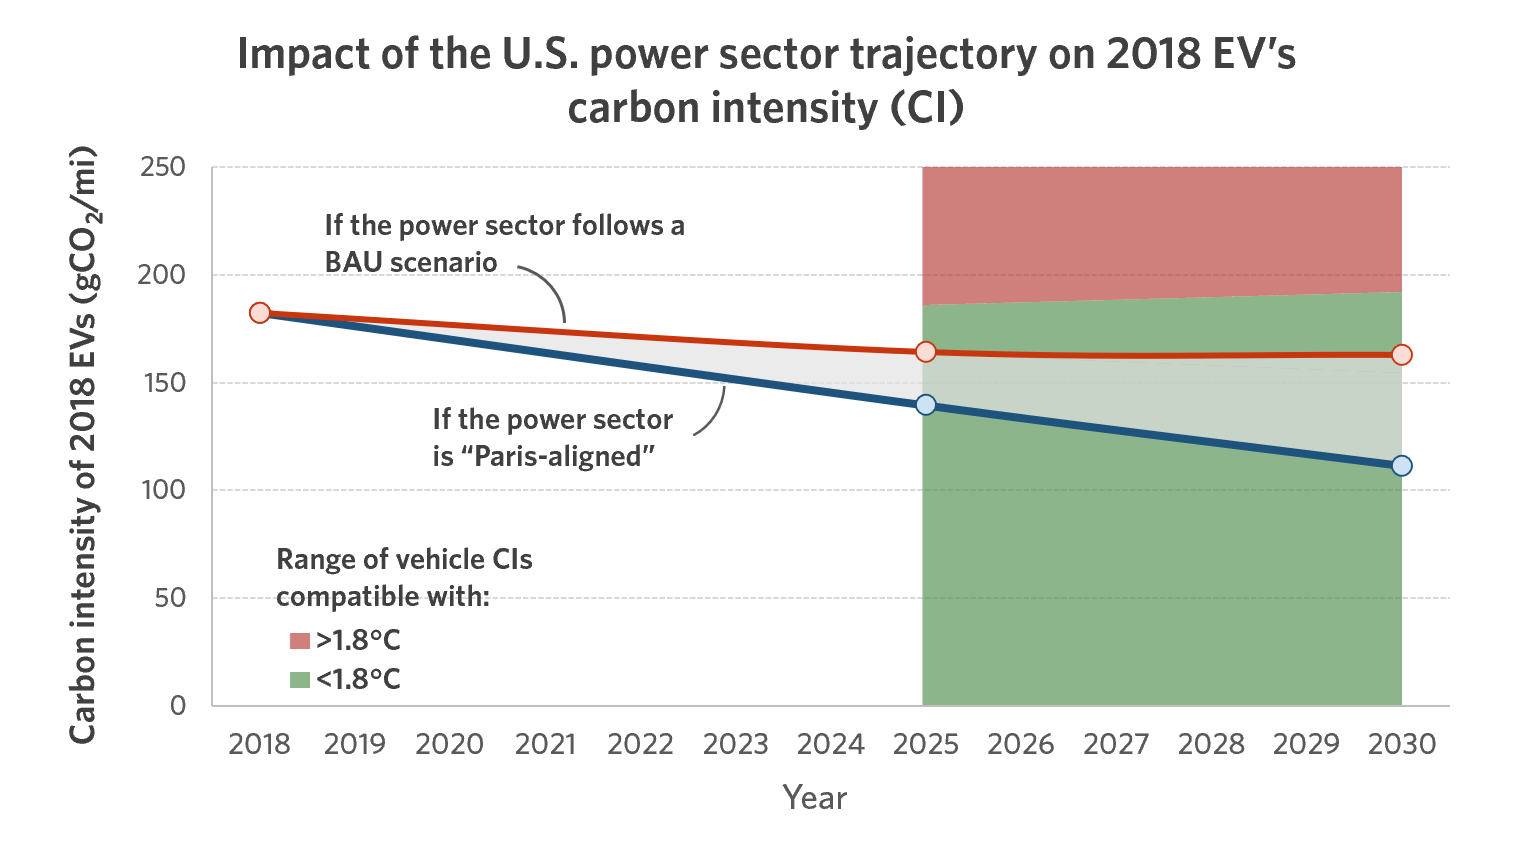
Figure 4 – Outlook of 2018 EVs carbon intensity with multiple power sector scenarios (BAU and “Paris-aligned”). <1.8°C- (green) compliant carbon intensities are displayed from 2025 to 2030.
Three levers to reverse current trends
In light of this analysis, several concerted steps are needed. First, internal combustion engine (ICE) vehicles should come with higher fuel efficiency standards. However, current signs are not promising. In 2020, the U.S. government lowered the fuel efficiency requirements of new light vehicles for the 2021-2026 period (NHTSA, 2020) because the initial standards – set back in 2012 – will not be met. The decade since 2009 has seen light vehicle fuel efficiency improvements progressively slowing (+2.9% year-to-year average until 2013, +0.8% since then). This is part due to the increasing market share of SUVs (50% of light vehicle sales in North America in 2019), which is a major setback for fuel efficiency and CI improvements (IEA, 2020). Reducing CO2 emissions calls for smaller, lighter, more aerodynamic vehicles.
Second, policies should encourage a rapid and mass roll-out of EVs (i.e. not just luxury). In 2018, EVs remained substantially more expensive than ICE vehicles (+45%). Yet battery costs are falling. On this basis, U.S. battery electric vehicles (BEVs) would reach price parity with ICE vehicles in 2024 (BNEF, 2020). In the meantime, government incentives are needed now more than ever. In 2018, incentives allowed closed 45% of the price gap. However, the budget for subsidy policies partially expired in 2020 (Fuel Economy, 2020), but could be replenished under the Biden administration (Welch et al., 2020). In parallel, continued investment in low-carbon power generation will be the main driver of how efficient the vehicles will be at reducing emissions.
Finally, and particularly in the U.S., the recovery from Covid-19 should target long-term modal shifts (e.g. from personal vehicles to public transport), especially in urban areas. Our analysis was technology-oriented and already included reduced use of personal vehicles. Modal shifts are yet to be demonstrated. In spite of a sharp but momentary contraction in personal vehicle usage due to the pandemic, pre-Covid-19 levels (Zormorano, 2020) should return shortly. Back to normal means more than three out of four workers commuting to work by car (BTS, 2016).
In the short term, public bodies must provide the data required to conduct similar studies in other countries. Understanding the dynamics of investments in light road vehicles is more than ever needed to give early indications of future CO2 emissions. The current economic situation could further prevent households from replacing their old, carbon intensive vehicles, and alter current trends in resulting emissions (Jacobsen et al., 2015).
Country-level data on light vehicle fleet compositions and light road transport CO2 emission scenarios would allow us to study this in other regions. Indeed, some European countries (Norway, Germany, France, UK) and more remarkably China show interesting EV market penetrations.
[1] Electric Vehicles (EVs) refer to Plug-in Hybrid Vehicles (PHEV) and Battery Electric Vehicles (BEV).
[2] All highway vehicles under 10,000 pounds.
[3] e.g. the 1.8°C pathway
References
BNEF, 2020. Long-Term Electric Vehicle Outlook 2020. Bloomberg New Energy Finance (BNEF). Available at: https://www.bnef.com/flagships/ev-outlook
BTS, 2016. Commute Mode Share: 2015. U.S. Bureau of Transportation Statistics (BTS). Available at: https://www.bts.gov/content/commute-mode-share-2015
DOE, 2020. Federal Laws and Incentives. U.S. Department of Energy (DOE). Available at: https://afdc.energy.gov/laws/all?state=US#:~:text=Under%20the%20Energy%20Policy%20Act,alternative%20fuel%20vehicles%20(AFVs).&text=Fleets%20that%20use%20fuel%20blends,credits%20toward%20their%20annual%20requirements
Fuel Economy, 2020. Federal Tax Credits for New All-Electric and Plug-in Hybrid Vehicles. U.S. Department of Energy (DOE). Available at: https://www.fueleconomy.gov/feg/taxevb.shtml
IEA, 2017. Energy Technology Perspectives 2017. International Energy Agency (IEA), Paris. Available at: https://www.iea.org/reports/energy-technology-perspectives-2017
IEA, 2019a. Fuel Economy in Major Car Markets: Technology and Policy Drivers 2005-2017. International Energy Agency (IEA), Paris. Available at: https://www.globalfueleconomy.org/media/708177/gfei-wp19.pdf
IEA, 2019b. World Energy Outlook 2019. International Energy Agency (IEA), Paris. Available at: https://www.iea.org/reports/world-energy-outlook-2019
IEA, 2020. Fuel Consumption of Cars and Vans. International Energy Agency (IEA), Paris. Available at: https://www.iea.org/reports/fuel-consumption-of-cars-and-vans
Jacobsen M. R., A.A. Van Benthem, 2015. Vehicle scrappage and gasoline policy. American Economic Review, 105(3), 1312-38. Available at: https://www.aeaweb.org/articles?id=10.1257/aer.20130935
NHTSA, 2020 (access). Fact Sheet: SAFE Vehicles Rule. National Highway Traffic Safety Administration (NHTSA). Available at: https://www.nhtsa.gov/corporate-average-fuel-economy/safe-fact-sheet
Welch D., J. Ellis, 2020. Biden’s Win Means Help for Automakers Selling Electric Vehicles. Bloomberg, 12 November 2020. Available at: https://www.bloomberg.com/news/articles/2020-11-12/biden-means-sales-boost-for-volkswagen-gm-tesla-tsla-electric-car-makers
Zamorano A., 2020. Covid-19 indicators: Automotive and Shared Mobility. Bloomberg New Energy Finance (BNEF). Available at: https://www.bnef.com/insights/24125/view
